Introduction to the Testing Tool
Overview
Let's explore one of the most powerful tools in the Unqork Designer Platform — the Testing tool. You can use this tool to create and monitor tests in Unqork.
The tool lets you perform a variety of tests on API (application programming interface) modules. These include:
-
Testing the execution sequence of your API modules.
-
Comparing an expected API response to the actual API response received.
-
Confirming data fields in your API response meet specific criteria.
So, why should you set up tests in your configuration? Running tests on your module ensures your modules run as expected. And the Testing tool is here to help track your module's behavior. Not only does the tool show you the test status but it also notifies you of status changes and the module affected.
The email notification includes links to the:
-
Module whose test failed.
You can review the test in the Testing tool and use the Module Revisions Dashboard tool to see what led to the failure.
To learn more about creating API tests with the Testing tool, view our Creating API Tests article.
This
To learn more about API modules and how to configure them, view our API Specification Snippet article. Likewise, to learn more about the Module Revisions Dashboard tool, view our Module Revisions Dashboard Tool article.
What You'll Learn
In this
Enabling the Testing Tool Workflow
For convenience, you have access to a prebuilt Testing tool workflow. This workflow automatically executes your tests each time you save your module. All you need to do is enable this workflow.
When you first access the Testing tool, you'll see a notification at the top of the page. In this notification, you'll find a link to enable the Testing tool workflow in your environment. This notification displays in new environments and at each promotion level—like staging and UAT (User Acceptance Testing). Without enablement, the tool still functions, but you must execute your tests manually.
When you click the link, you open the Testing tool's workflow for your environment. The first thing you need to do is unlock the workflow so you can enable its Signal Start node.
To enable the workflow:
| 1. | Click the Enable the Workflow link. |
| 2. | Click Viewing at the top of the Workflow Builder. |
| 3. | Click Editing. |
| 4. | Click the Signal Start node. |
| 5. | Click Run. |

| 6. | Click Save... |
| 7. | Save the workflow. |
Just like that, you're ready to start. Let's head back to the Testing tool and look at its dashboards.
Navigating the Testing Tool's Dashboards
The Testing tool is made up of a variety of sequential dashboards. As you move from one dashboard to the next, you'll see more details about your modules and their tests. The Testing tool's dashboards include the:
| 1. | Testing Workspace Dashboard. |
| 2. | Testing App Dashboard. |
| 3. | Testing Module Dashboard. |
Testing Workspace Dashboard
The Testing Workspace Dashboard is the entry point to Unqork's Testing tool. After selecting your workspace, you'll see all tests set up in that workspace. You'll see everything from:
-
The test metrics of your workspace.
-
The number of workspace applications with tests.
-
The success and failure rates of those tests.
A Failed test on the dashboards is the result of 0% component coverage. All component tests must be successful to receive a Pass.
This dashboard also populates with all the applications in your workspace. The dashboard includes a variety of filters to help you find and sort this information. Some of these filters include:
-
Finding workspace applications with no tests.
-
Sorting application tests by success rate.
-
Sorting applications by test coverage.
Once you find your application, you can view its modules and tests in greater detail.
Breadcrumbs at the top left of the page show which Testing tool dashboard you're viewing.
Clicking View App Tests takes you to that application's Testing App Dashboard. Let's take a look.
Testing App Dashboard
The Testing App Dashboard is similar to the Testing Workspace Dashboard. The difference is you are now looking at the test metrics of an application in your workspace. This also means you'll see your application's modules and their individual tests. Along with the dashboard's typical metrics, you'll also find:
-
The number of tests passed.
-
The number of tests failed.
-
And the total number of tests in your application.
This dashboard also populates with all the modules in your application. The dashboard includes a variety of filters to help you find and sort this information. Some of these filters include:
-
Helping to determine which modules are API or non-API modules.
-
Sorting application tests by success rate.
-
Sorting by application test coverage.
Once you find an application, you can view its modules and tests in greater detail.
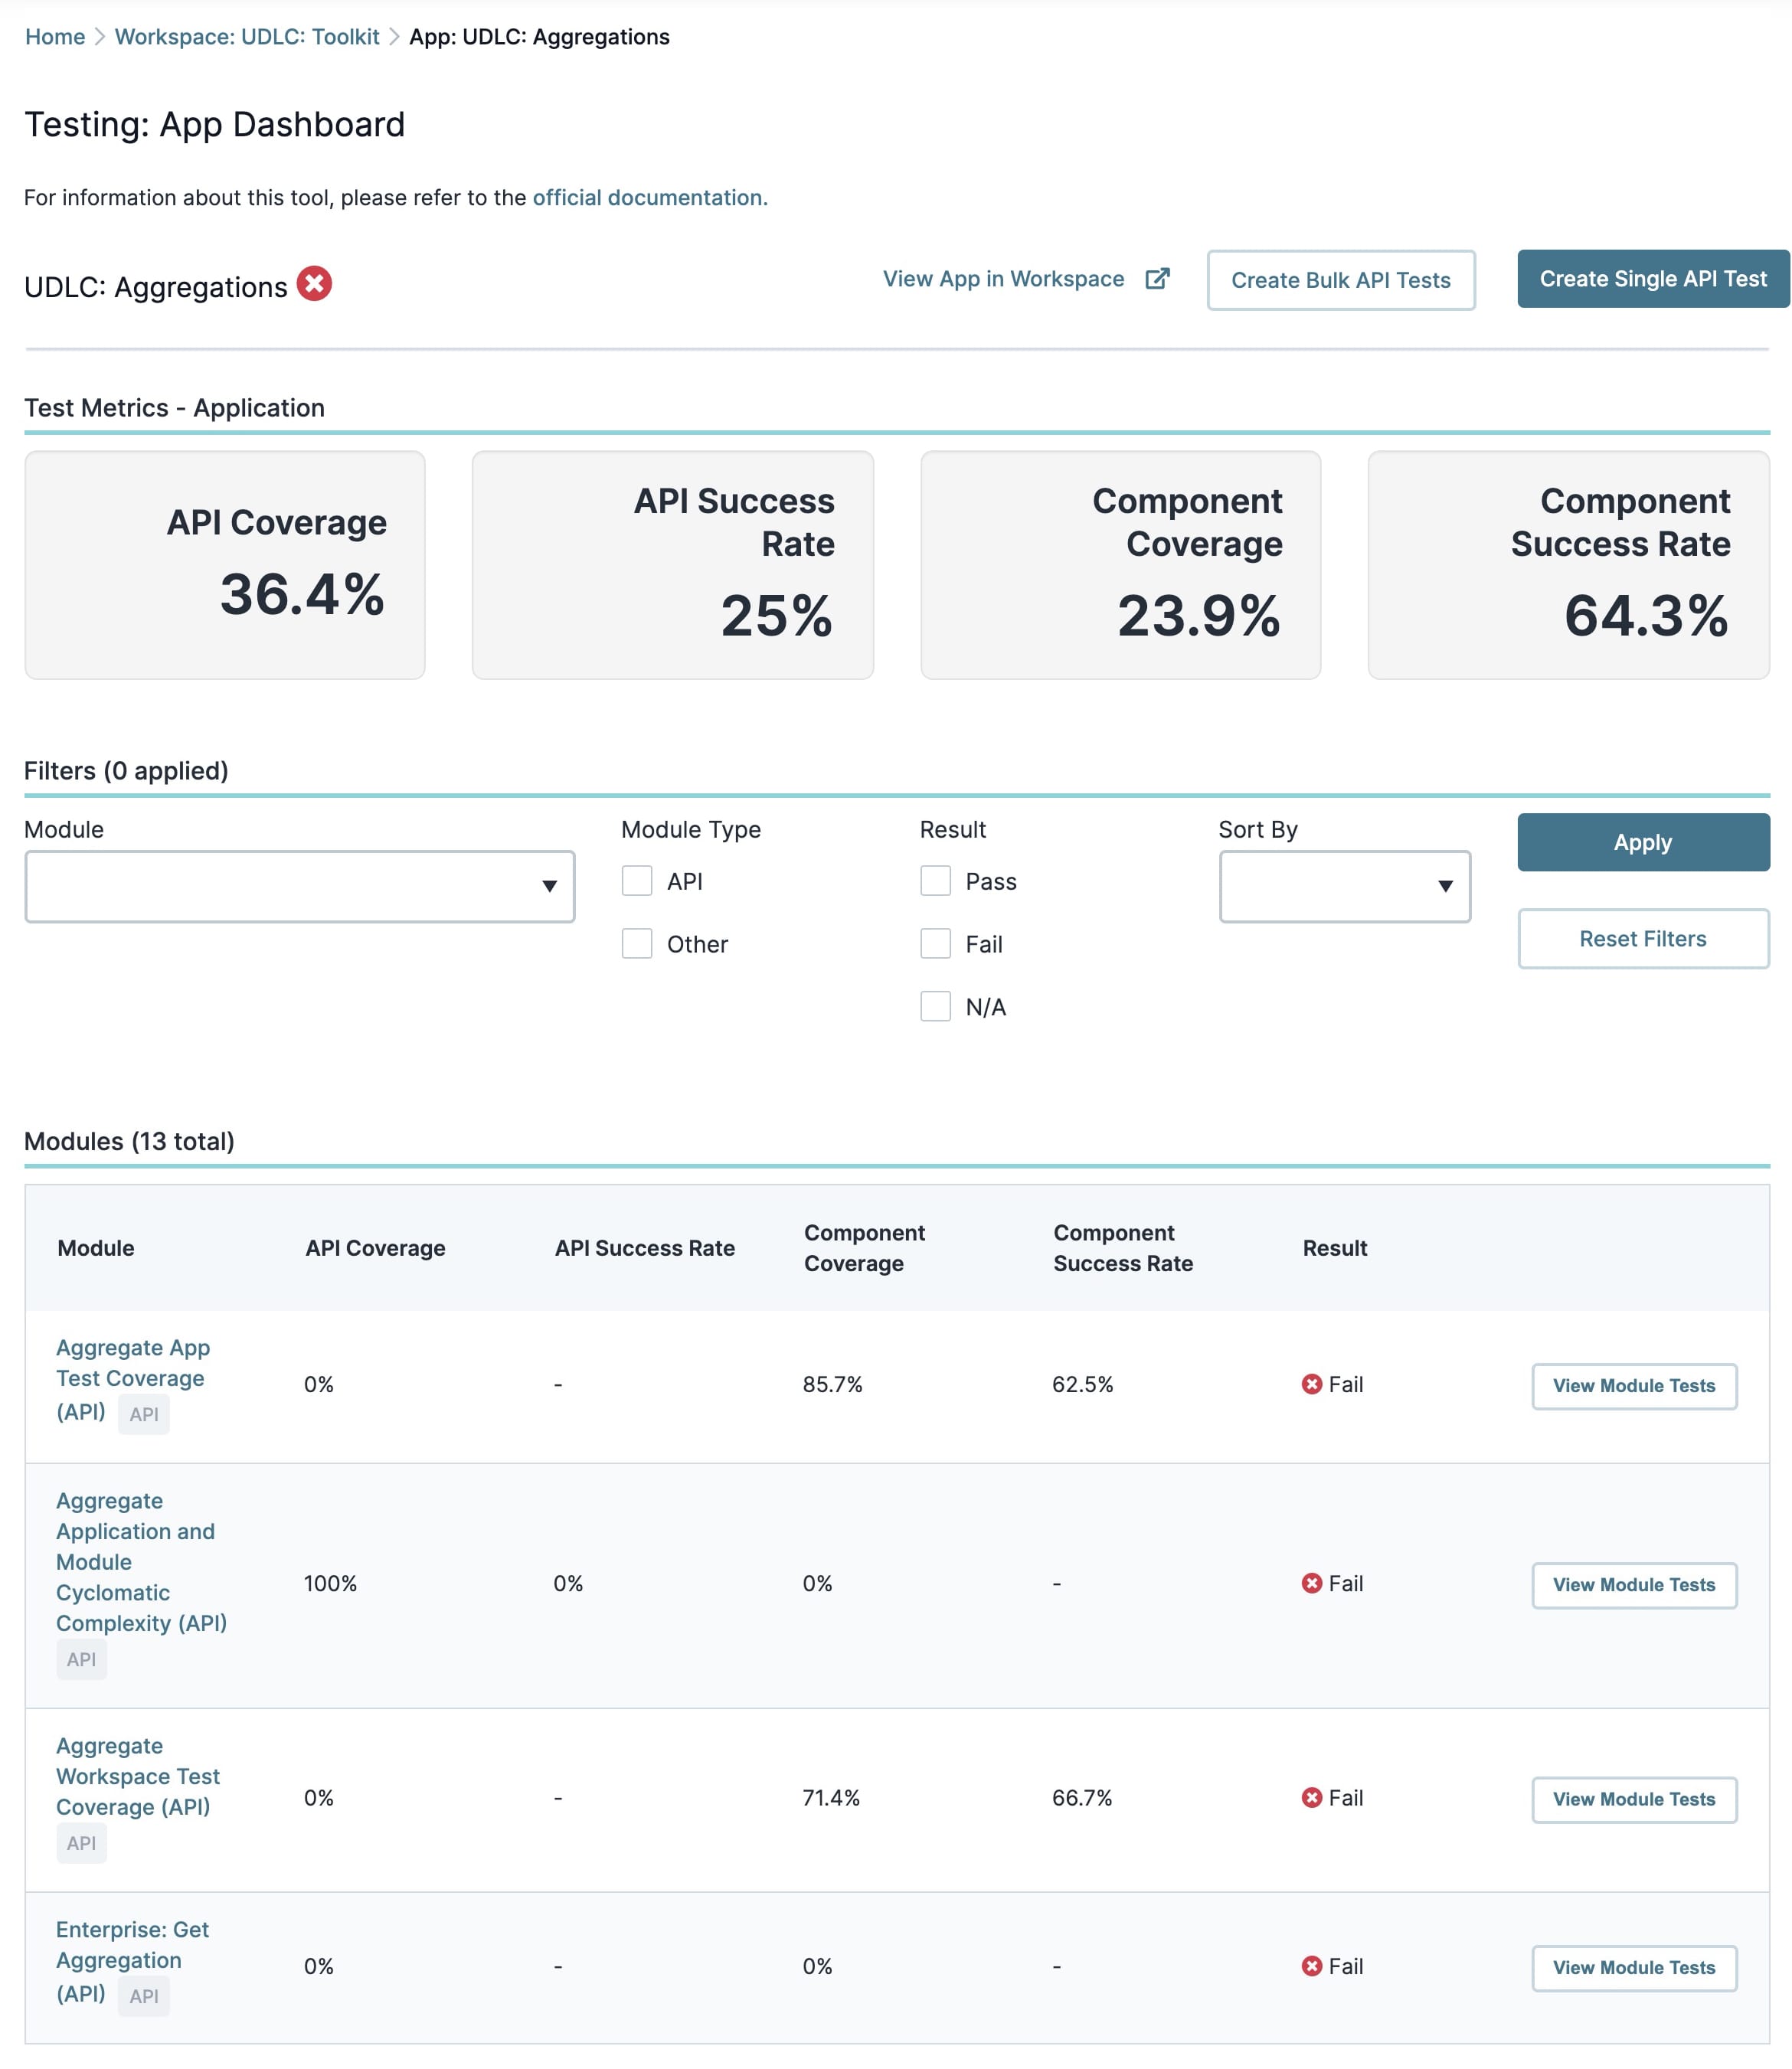
Clicking View Module Tests takes you to that module's Testing Module Dashboard. Let's take a look.
Testing Module Dashboard
The Testing Module Dashboard is like the Testing App Dashboard. The difference is that you're now looking at the test metrics of a specific module in your application. You see:
-
Test metrics for your module.
-
The module's test coverage.
-
The total number of passed and failed tests.
This dashboard also populates with all the tests in your module. To help you find and sort this information, the dashboard includes a variety of filters. Some of these filters include:
-
Finding specific tests in your module.
-
Filtering by test and component type.
-
Sorting by date and time of the test's creation.
Once you find a test, you can view it in greater detail.
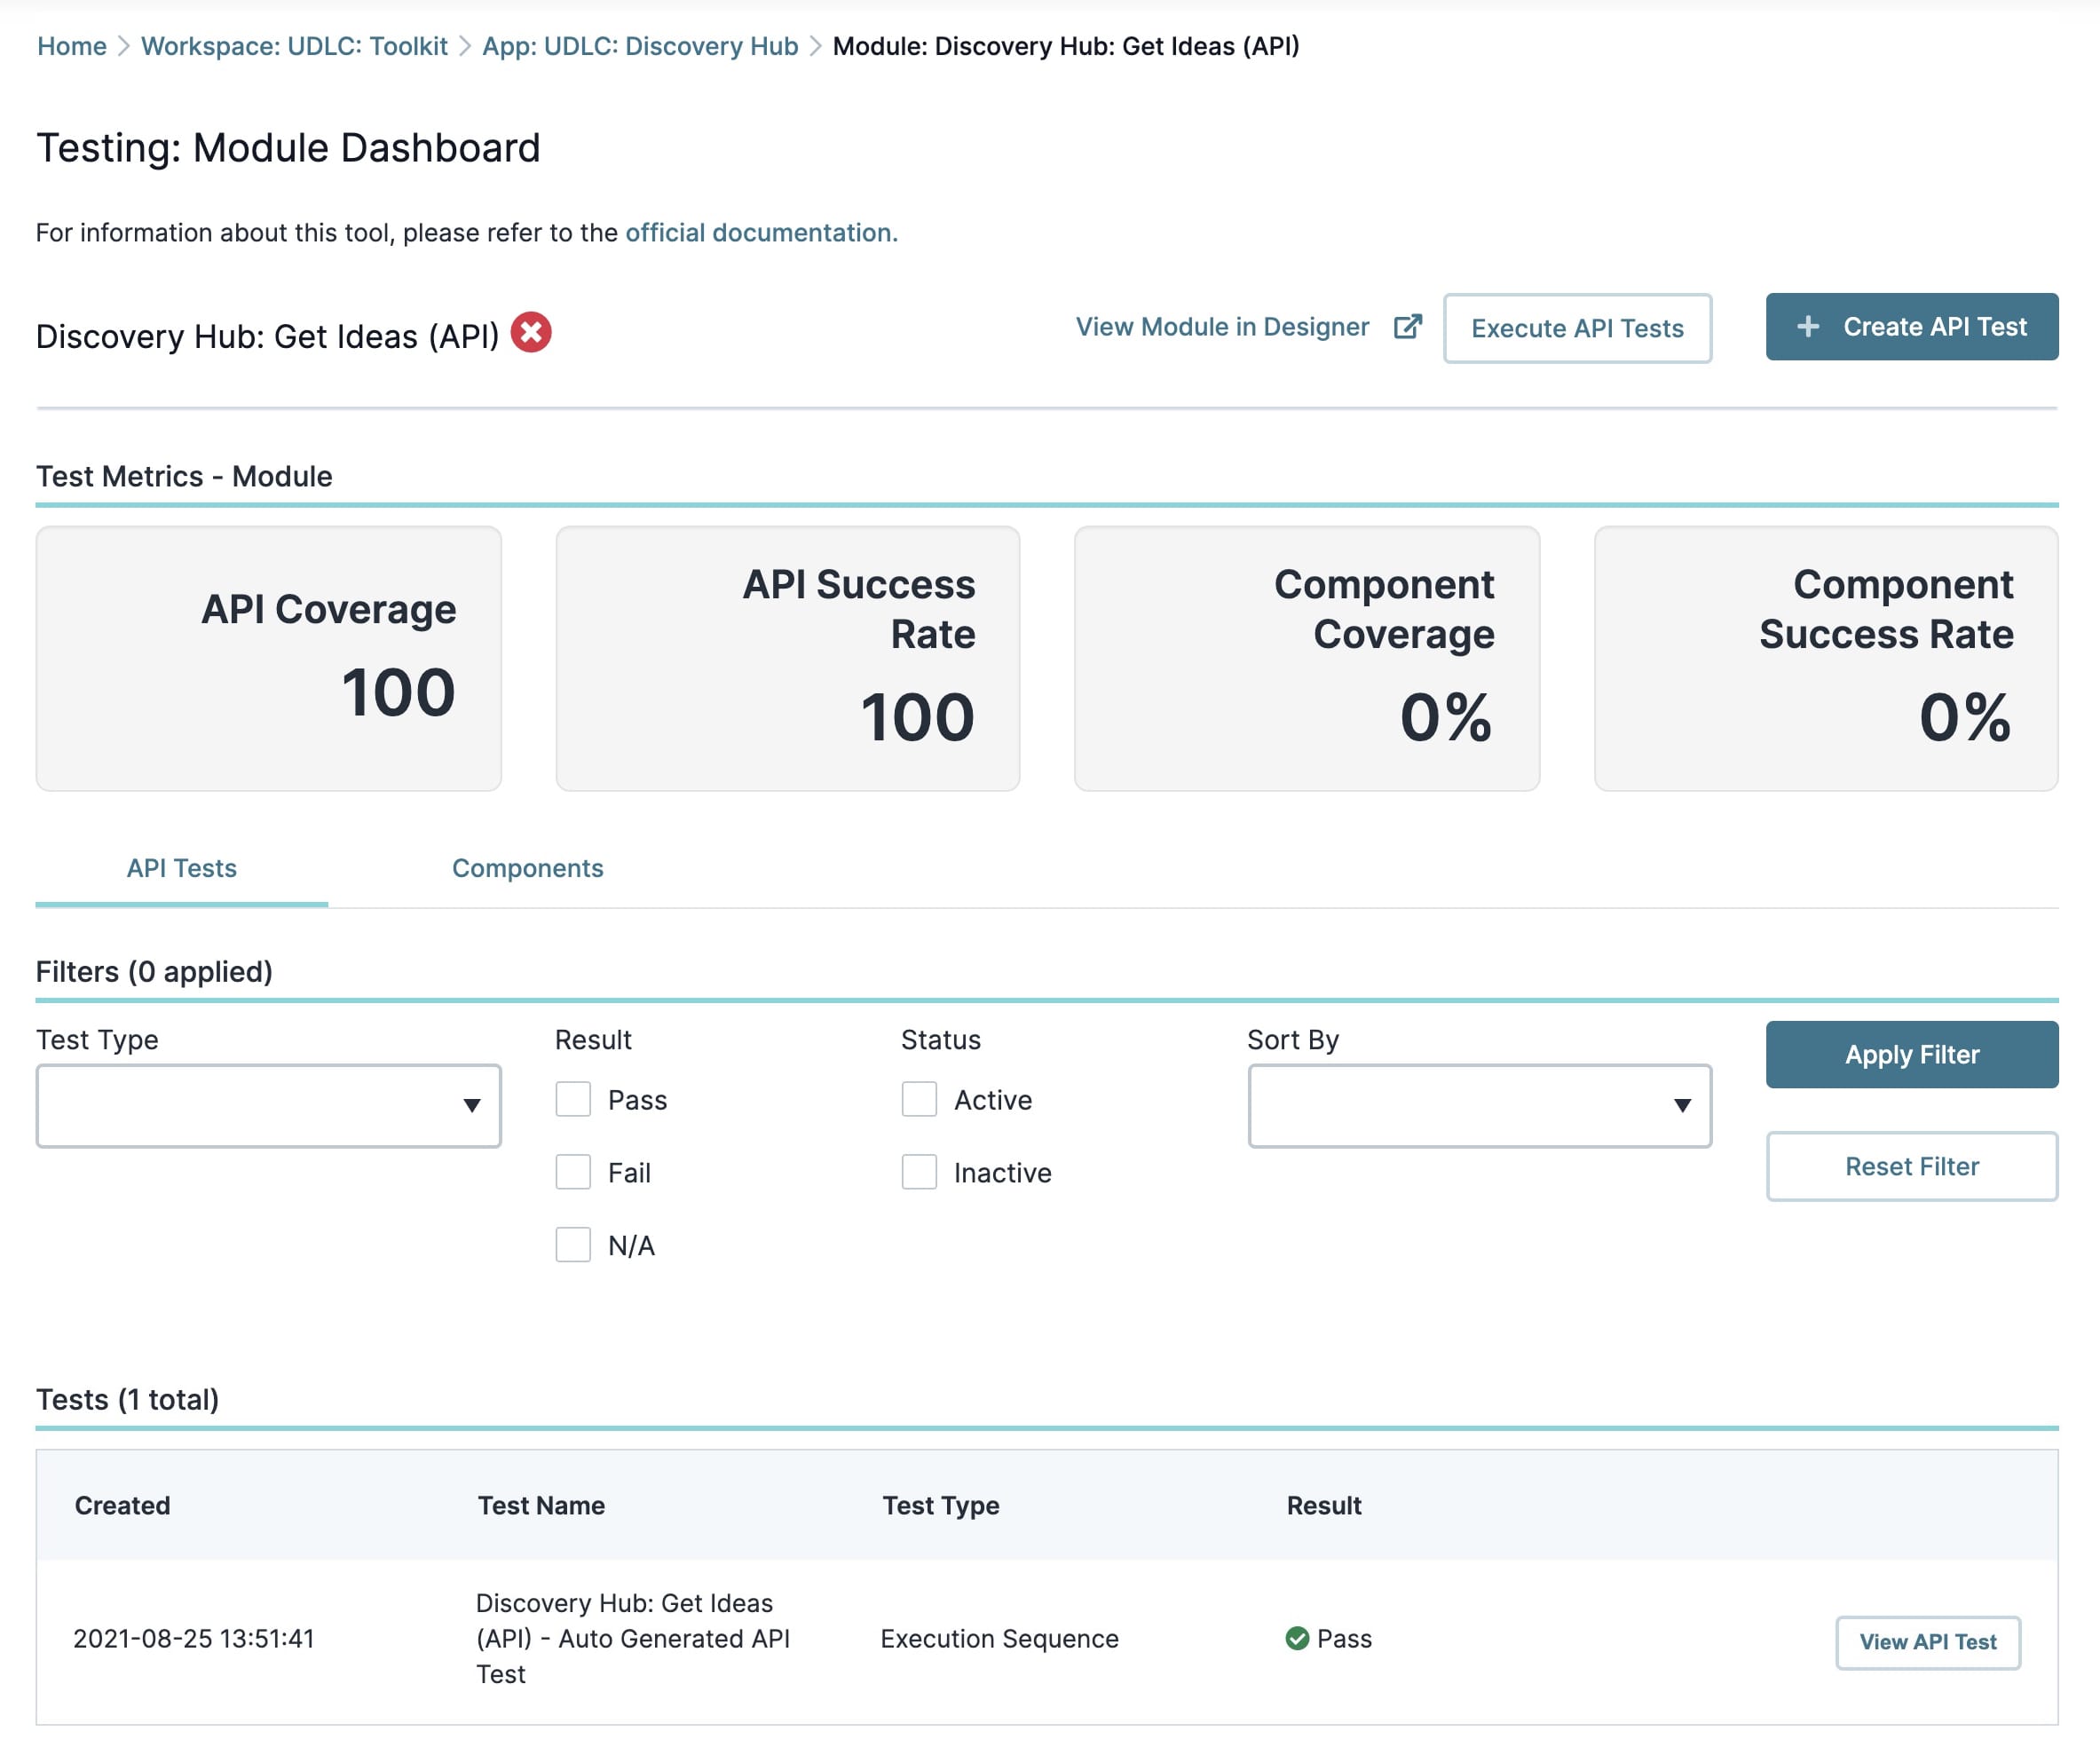
Test results (details) vary based on the type of test run. For example, component test details show the component type and the result. You'll also see grids listing the key and value for each Input and Output. API Request test details show the test name, test type, module ID, the API request, the result, and service logs. You also have the option to execute, edit, and delete the test from this details page.
To learn more about creating API tests with the Testing tool, view our Creating API Tests article.
