The Testing tool’s Module Dashboard lets you view test details for a specific module in your application.
On the dashboard, you can explore your module’s:
Test coverage.
Test success rate.
Overall test status.
You can also view which tests are active and inactive. Active tests are those that run on module save. Inactive tests do not run on module save. The dashboard also features a range of filters to help you locate and organize your information.
Some of these filters include:
Finding active or inactive tests.
Sorting tests based on the date of creation.
Sorting tests by test type.
Once you locate a test, you can view it in greater detail.
To learn more about creating API tests with the Testing tool, view our Creating API Tests article.
Viewing a Module
The tool's dashboards are sequential. So, when you open the tool, you begin at the highest level of your Unqork creations: Workspaces. After selecting a workspace, you'll view its applications:
From the Workspace drop-down, select a workspace.
Use the dashboard's filters to locate a specific application.
To the right of an application tile, click View App Tests to view its test details.
You've now opened the Testing App Dashboard for that specific application.
If you want to view the application in the Unqork Designer Platform, click the View App in Workspace link in the top-right corner.
The following video shows you how to view your application's tests from the Testing Workspace Dashboard:
.gif)
After selecting your workspace and application, you can locate a specific module's tests:
Use the Testing App Dashboard filter to locate a module.
To the right of a module tile, click View Module Tests to view its test details.
You've now opened the Testing Module Dashboard for a specific module.
If you want to view the module in the Module Builder, click the View Module in Designer link at the top-right of the dashboard.
The following video shows you how to view your module's tests from the Testing App Dashboard:
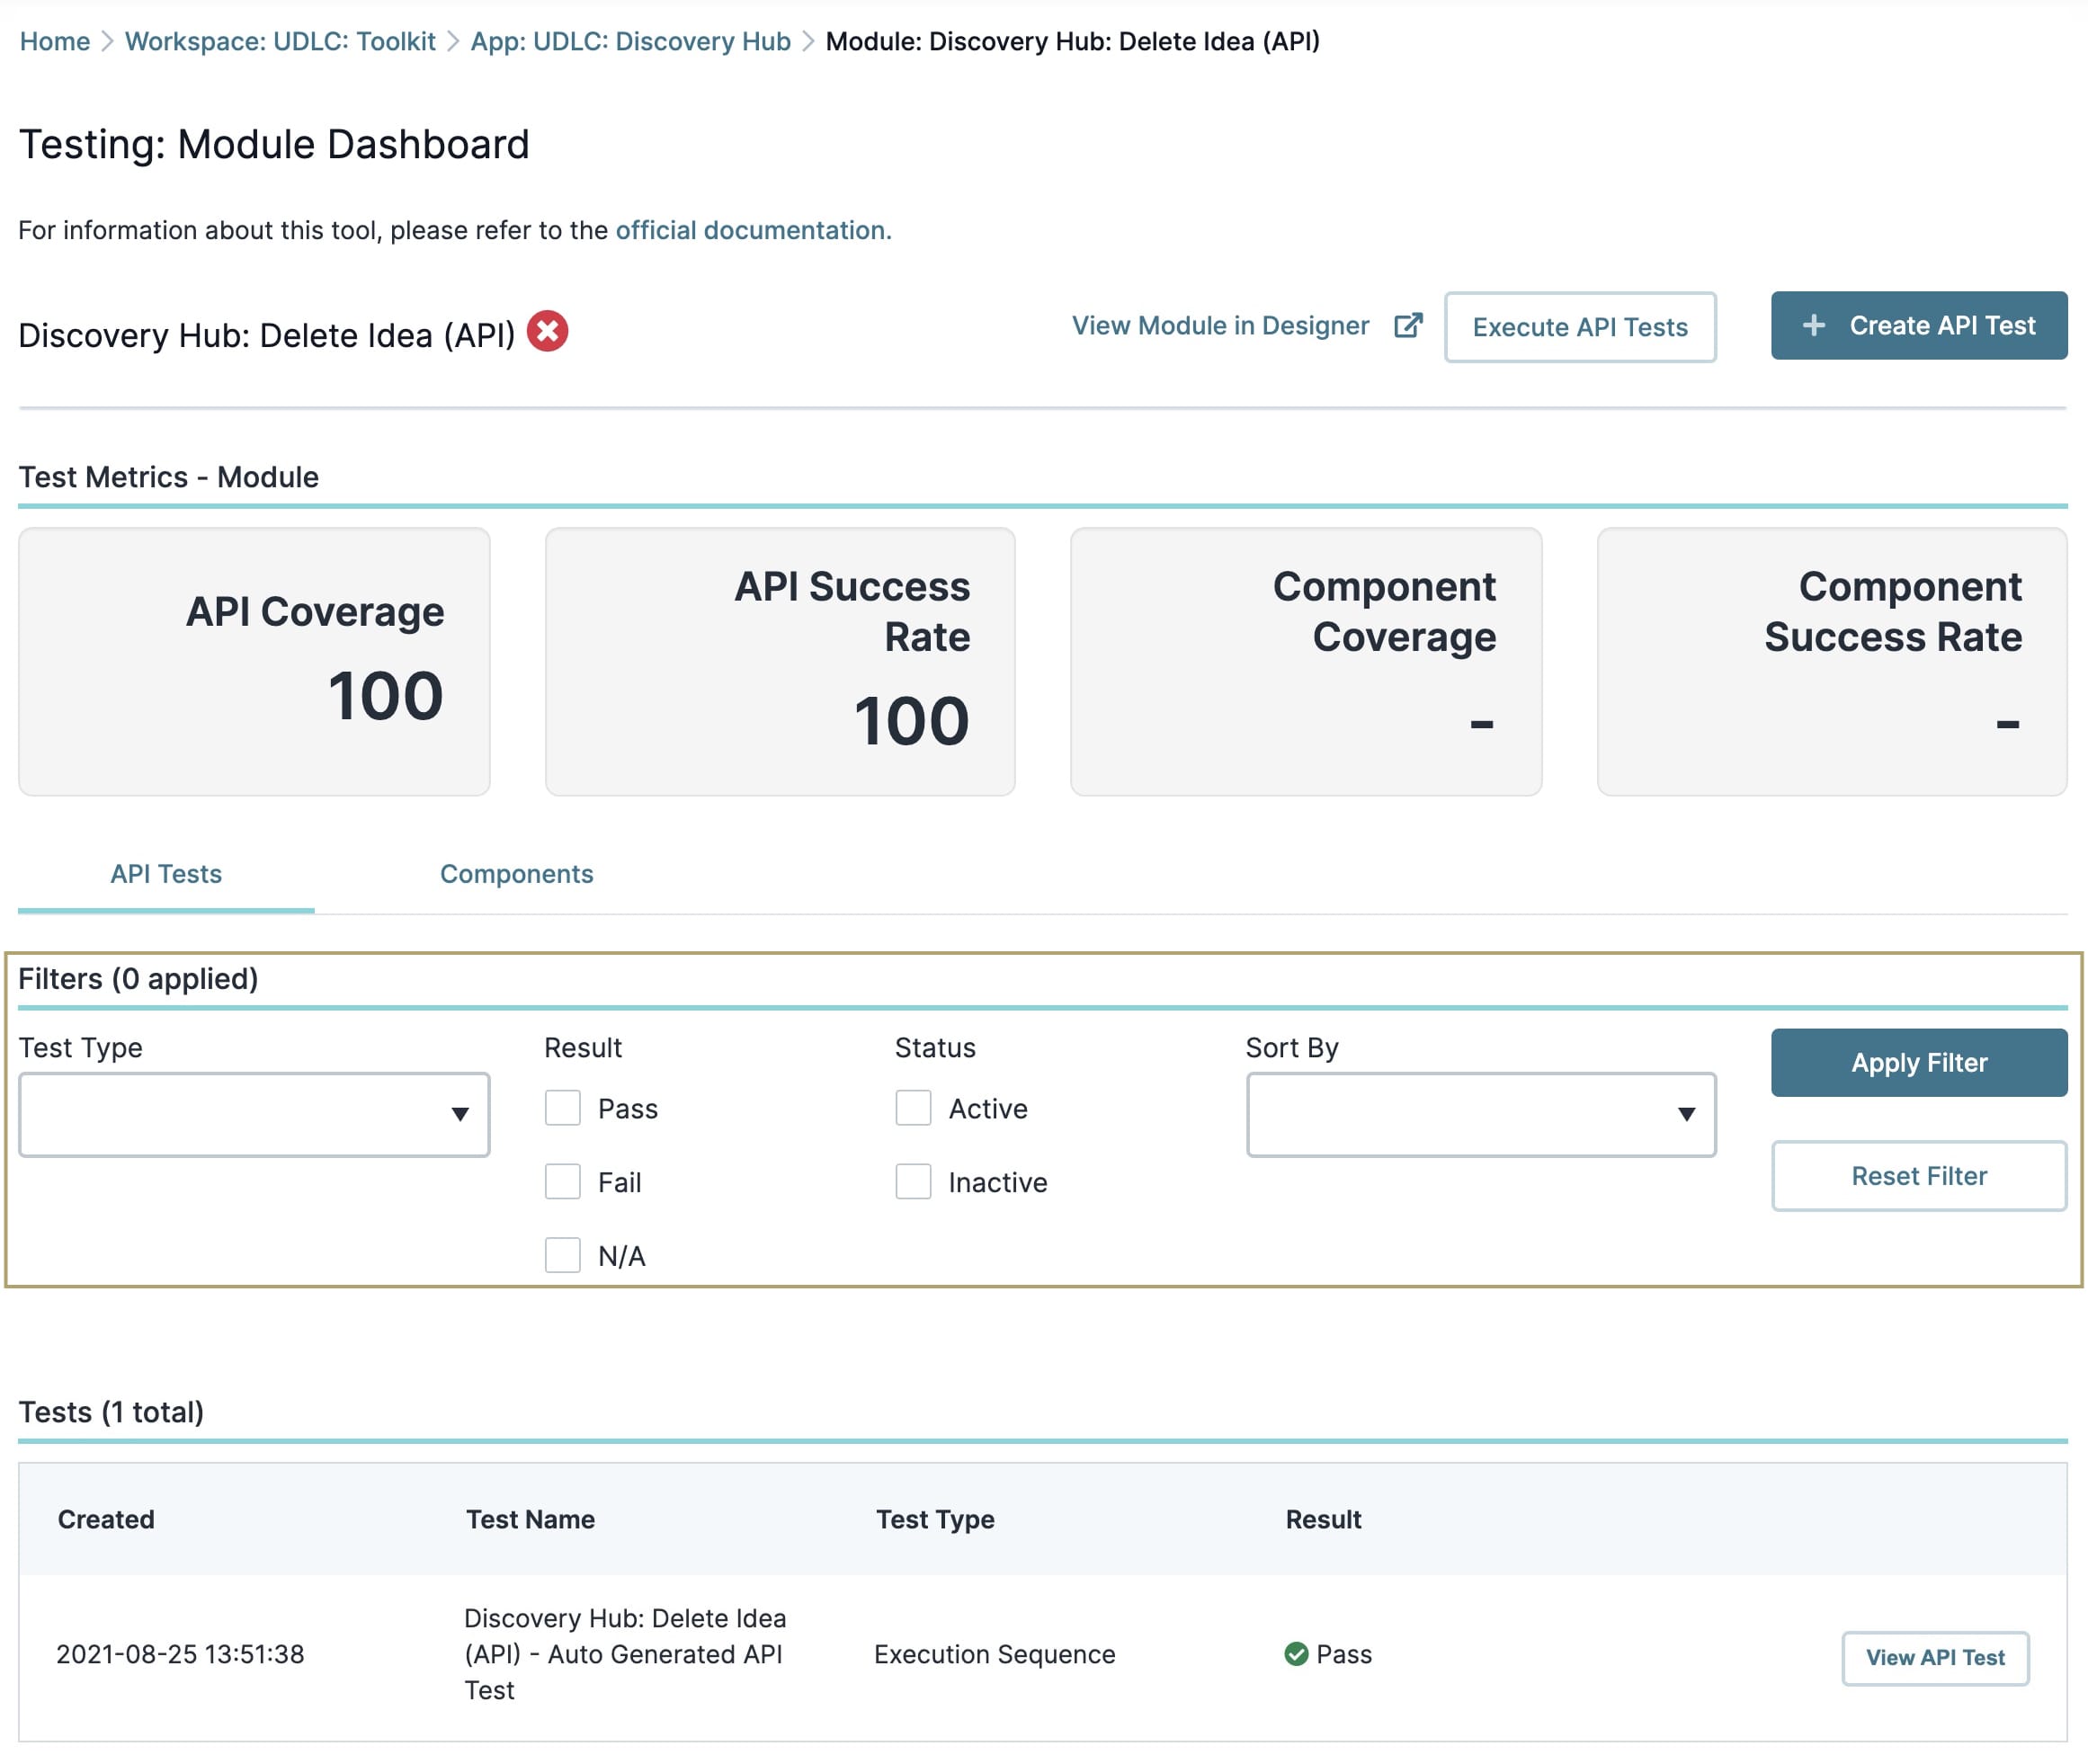
Navigating the Testing Module Dashboard
In the Testing Module Dashboard, you can perform various actions:
View that module in the Module Builder.
Manually execute all API tests in that module.
Remember, as long as the Testing workflow in your environment is running, tests execute automatically on module save. To learn more about enabling the Testing workflow, view our Testing Tool article.
Create an API test.
To learn more about creating API tests, search Creating API Tests article.
You can also view the following sections:
The dashboard's test metrics.
The dashboard's filters.
The Tests table, which displays all your API and component tests.
What displays in the Tests table depends on the type of test. Tests in this table are either API tests or component tests. If your module contains both test types, you can use the API Tests and Components tabs to be specific.
This is how the tabs look:
For API tests, you'll see the following table attributes:
Attribute | Description |
|---|---|
Created | The date and time the test was created. |
Test Name | The test's name at creation. |
Test Type | The type of test being run. The options you'll see in this column include:
|
Result | You'll see a green icon if your Test Success Rate is 100%. Anything below 100% returns a red icon. |
View API Test | Clicking this button lets you view the test's specific details. |
For component tests, you'll see the following attributes:
Attribute | Description |
|---|---|
Component Key | The Property ID of the component with the test. |
Type | The type of logic component. For example, a Calculator, Decisions, or Data Workflow component. |
Total Tests | The total number of tests set up for that specific component. |
Success Rate | Various options can be displayed here:
|
View Component Tests | Clicking this button lets you view the test's specific details. |
You'll also see that the table information is organized alphabetically. By default, the table shows ten entries. Click the pagination buttons below the table to view more entries.
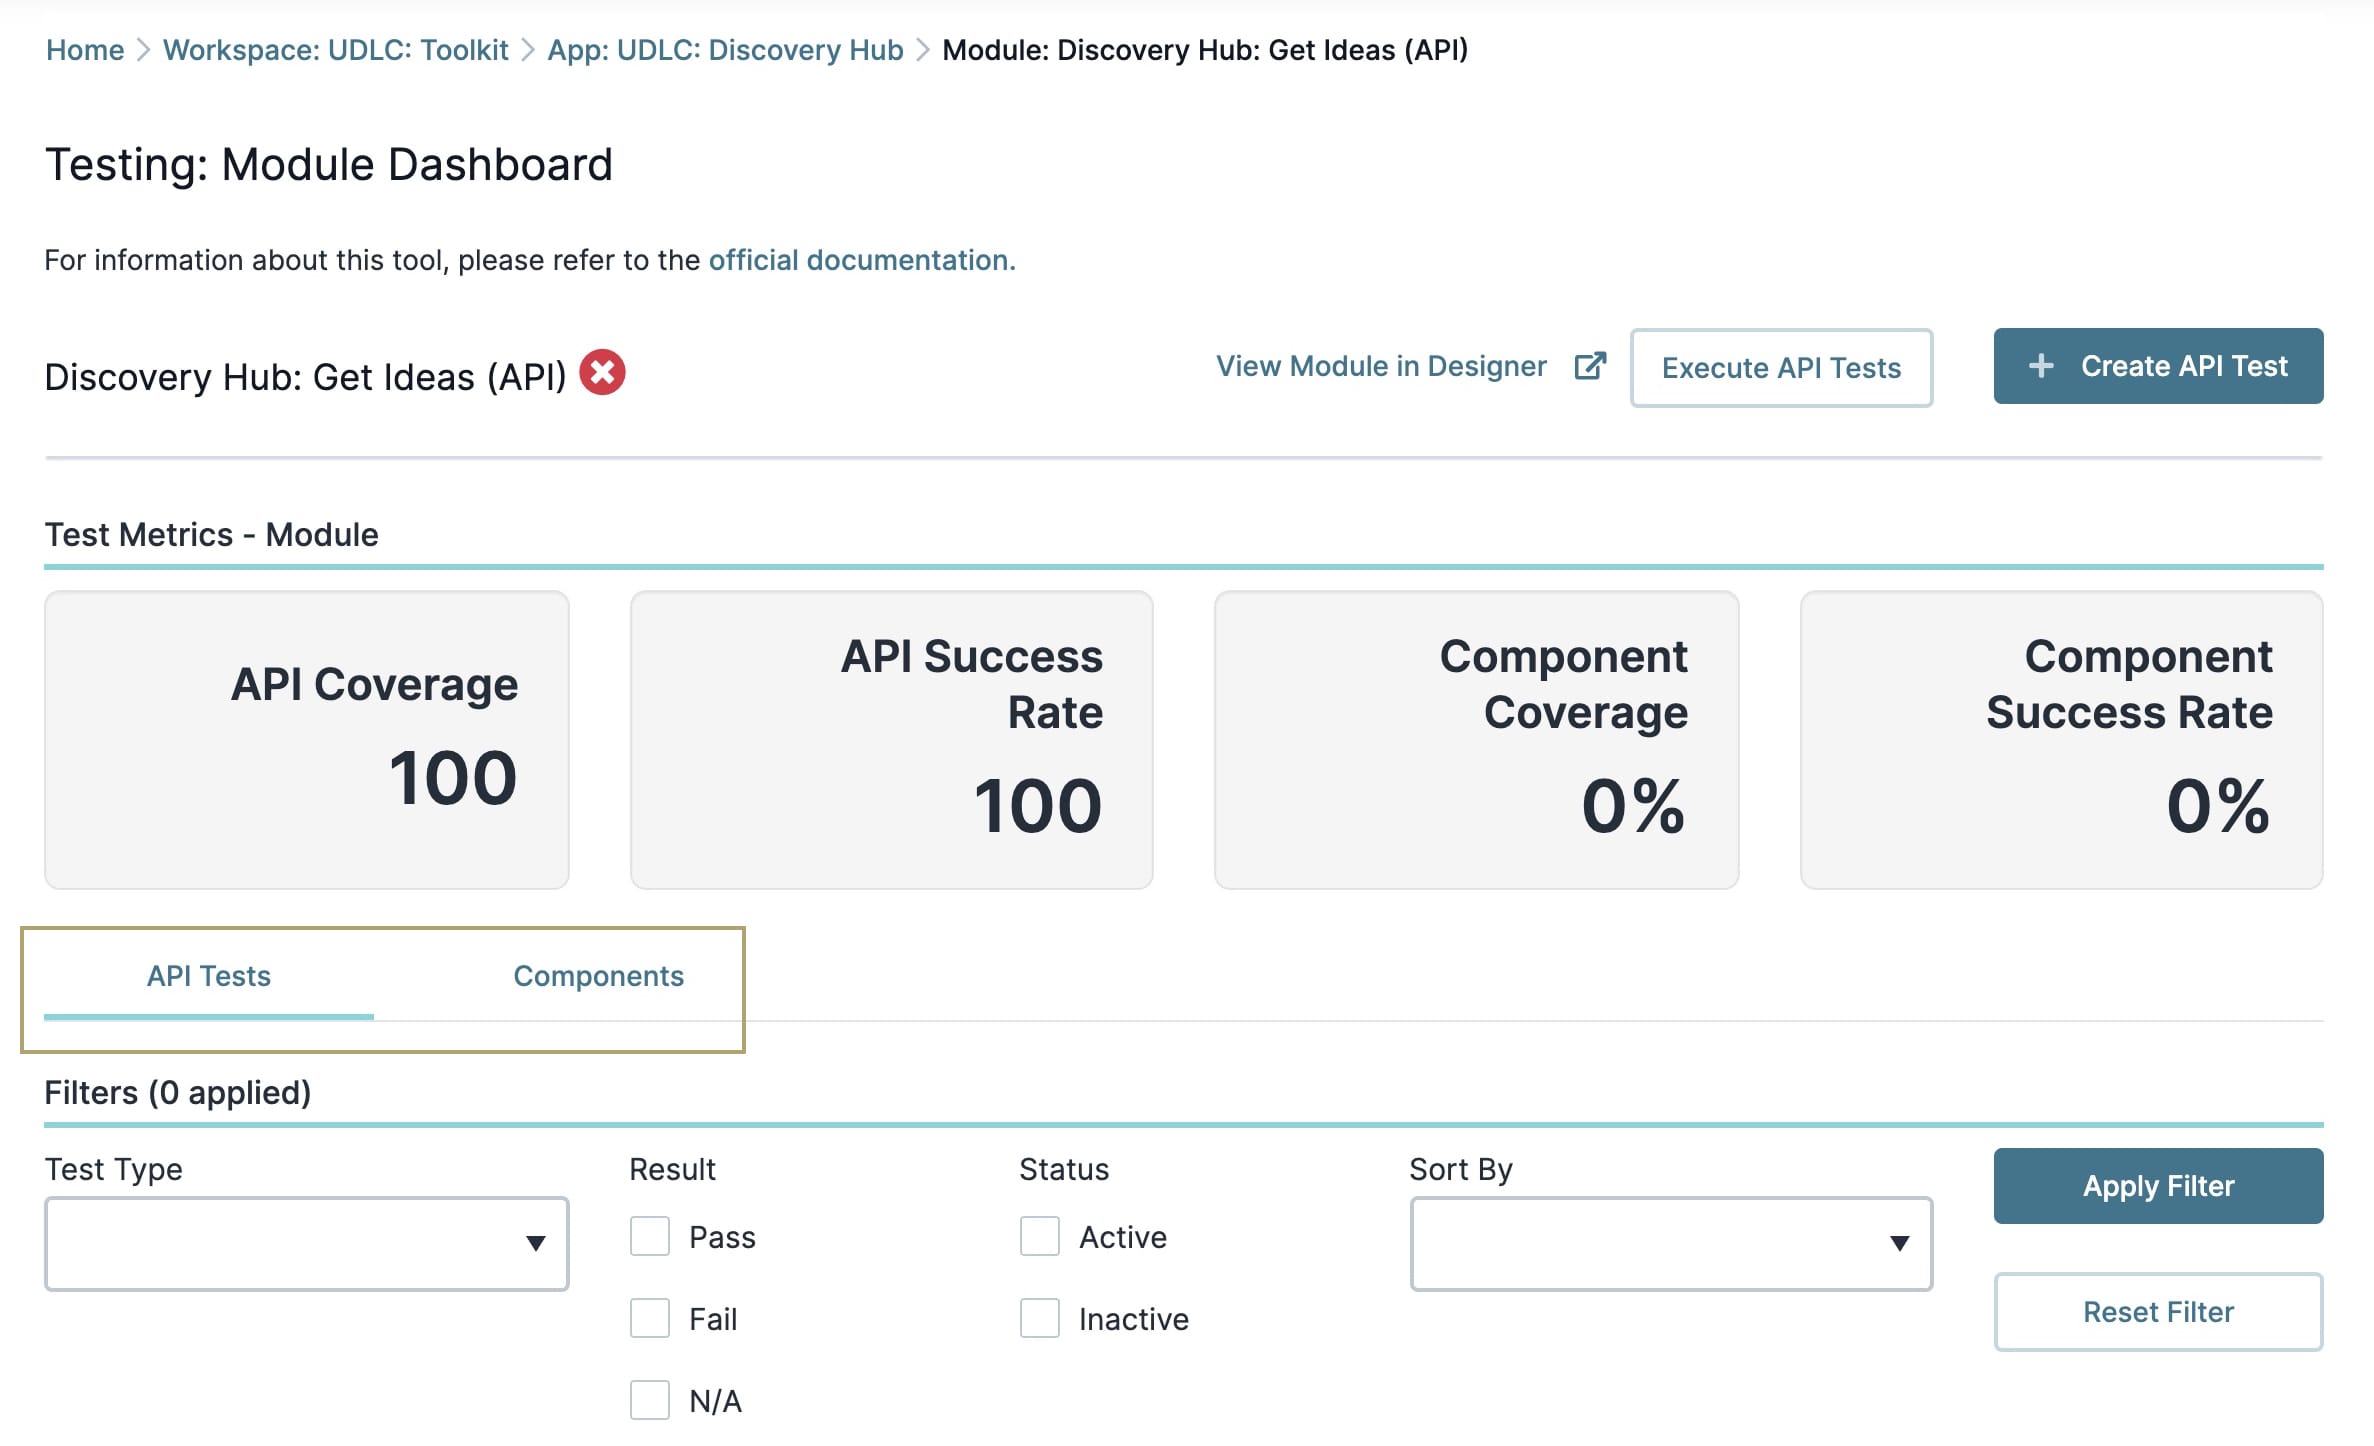
Viewing the Module Test Metrics
Now, let's explore your module's test metrics. As you add, edit, or remove tests in a module, the results in this section change in real-time.
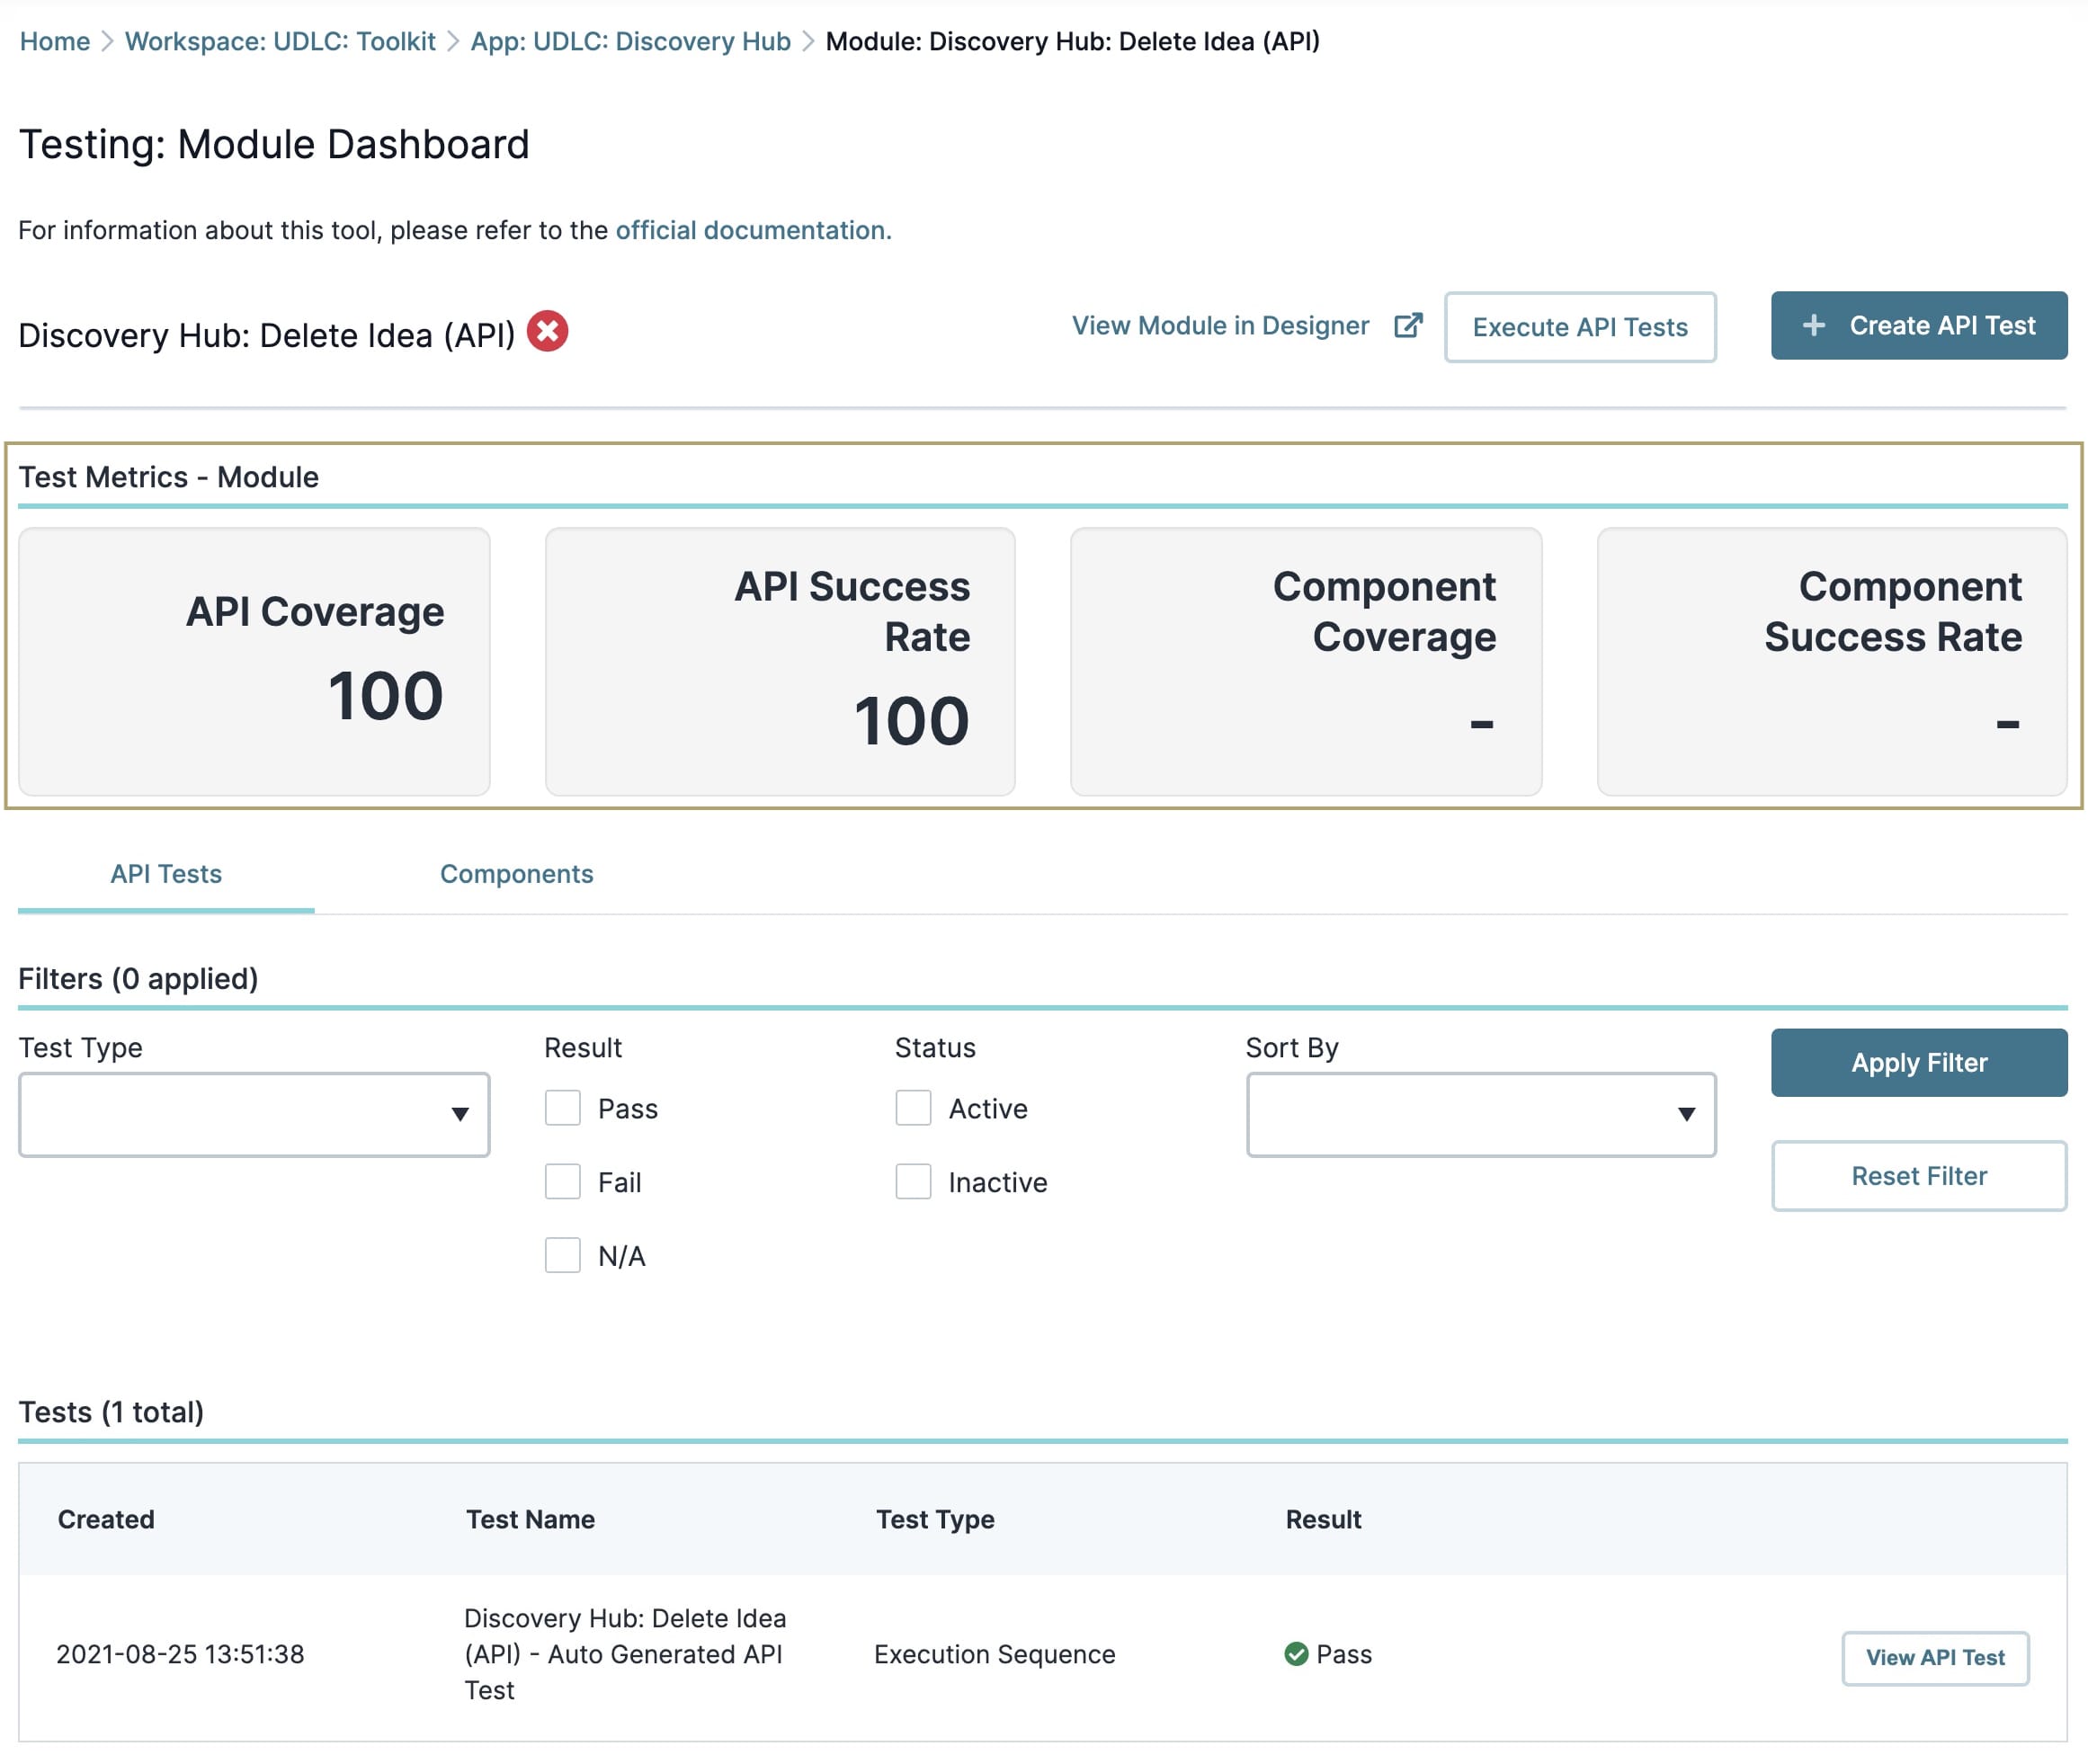
Below is a description of the different metrics in this section:
Test Metric | Description |
|---|---|
API Coverage | The percentage of all API modules that have tests in this module. |
API Success Rate | The percentage of successful API tests in this module. |
Component Coverage | The percentage of all module components that have tests in this module. |
Component Success Rate | The percentage of successful component tests in this module. |
Using the Testing Module Dashboard Filters
Below the metrics, you’ll find the dashboard filters. These filters help you locate specific tests in your module.
Depending on the type of test, different filter options are available. If your API module only has an API test, only the filters specific to API tests display. If you have a module with API and component tests, tabs display on the dashboard for each set of filters.
Filtering API Module Tests
If the module you're viewing has API tests, click the API Tests tab above the filters. Once selected, the Tests table only populates with API tests in that module.
If your module only has one type of test, you do not see these tabs.
You also see the following filters:
Filter | Description |
|---|---|
Test Type | The type of test being run. The options you'll see in this column include:
|
Result | This group of filters lets you locate all tests that passed, failed, or are inactive. Below are explanations of each Result type. |
Pass | Select this checkbox to display all tests with a 100% Test Success Rate. |
Fail | Select this checkbox to display all tests with a Test Success Rate less than 100%. |
N/A | Select this checkbox to display all inactive tests. |
Status | This pair of filters lets you see only active or inactive tests. |
Active | Select this checkbox to display only active tests. Active tests are ones that you can execute. |
Inactive | Select this checkbox to display only inactive tests. Inactive tests are disabled and cannot be executed. |
Sort By | Use this drop-down to sort the Tests table. Sorting options include Created, Result, Test Name, and Test Type. Below are explanations of each option. |
Created | Organizes the table by the test's creation date and time. The most recent test displays at the top of the table. |
Result | Organizes the Tests table by Result. From top to bottom, the table has the following organization:
By default, the results are in ascending (A-Z) order by Test Name. |
Test Name | Organizes the table in ascending (A-Z) order by Test Name. |
Test Type | Organizes the table in ascending (A-Z) order by Test Type. |
Apply Filter | Click this button to apply the filters. |
Reset Filter | Click this button to reset the filters and return the Tests table to its defaults. |
Filtering Component Tests
In the module where you're viewing component tests, click the Components tab above the filters. Once selected, the Tests table only populates with component tests in that module.
If your module only has one type of test, you do not see these tabs.
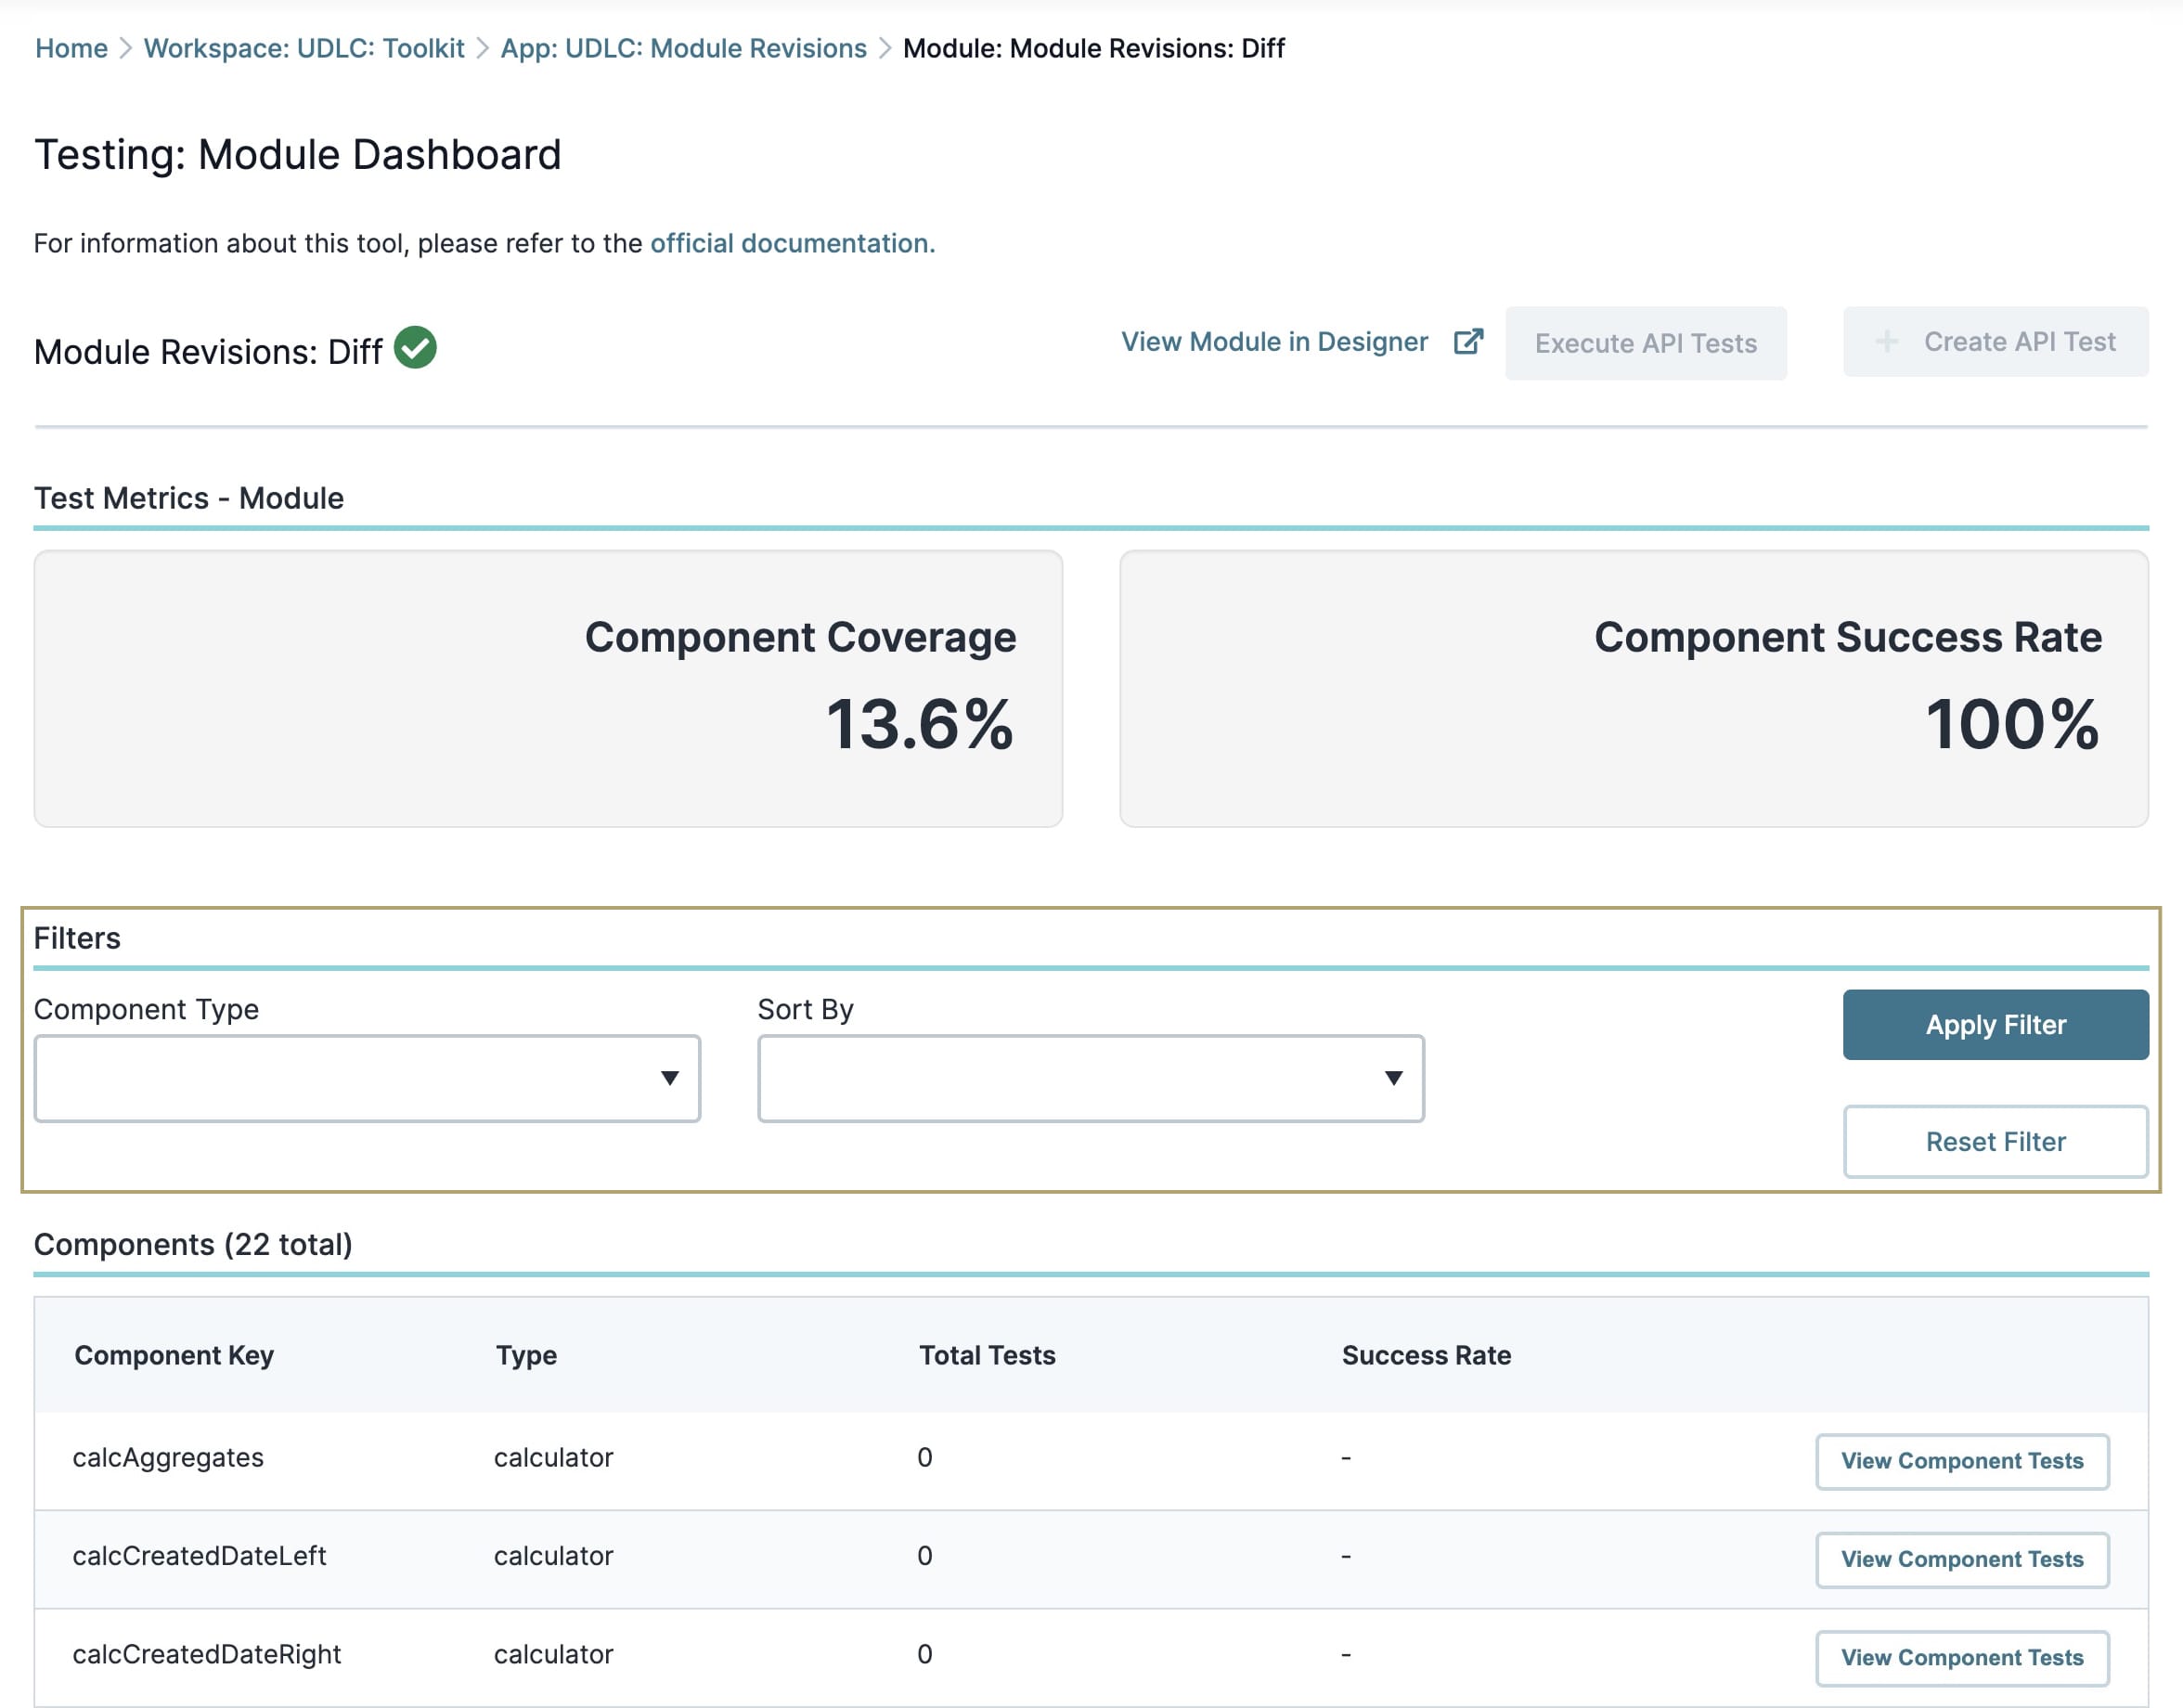
You also see a logic component filter and various sorting options:
Filter | Description |
|---|---|
Component Type | This drop-down lets you select a logic component to filter. The options include a Calculator, Decisions, or Data Workflow component. |
Sort By | Use this drop-down to sort the Tests table. Sorting options include Component Key, Type, Total Tests, and Success Rate. Below are explanations of each option. |
Component Key | Organizes the table in ascending (A-Z) order by component Property ID. |
Type | Organizes the Tests table in ascending (A-Z) order by the component type. |
Total Tests | Organizes the Tests table by total number of tests. Components with the most tests display at the top of the table. |
Success Rate | Organizes the Tests table by Success Rate. From top to bottom, the table has the following organization:
|
Apply Filter | Click this button to apply the filters. |
Reset Filter | Click this button to reset the filters and return the Tests table to its defaults. |
Viewing Component Test Details
After using the dashboard's filters to locate a test, click its View Component Tests button. Clicking this button opens the Component Test Details page. This page displays information specific to your component tests. It also provides you with a link to open your module in the Module Builder.
The page includes the following:
Attribute | Description |
|---|---|
Row | When you create a test in a component, you’ll enter its information into that component's Testing Harness. Doing so references the row the test exists in the component's harness table. The first row of the table is 0. |
Inputs | The component's test inputs. |
Outputs | The component's test outputs. |
Result | The status of the test. Options include:
|
View Details | This button is specifically helpful if your test failed. Clicking it opens a pop-up modal that displays the expected and actual outputs from the test. |
Here's an example of the information you’ll find from a failed test when you click the View Details button.
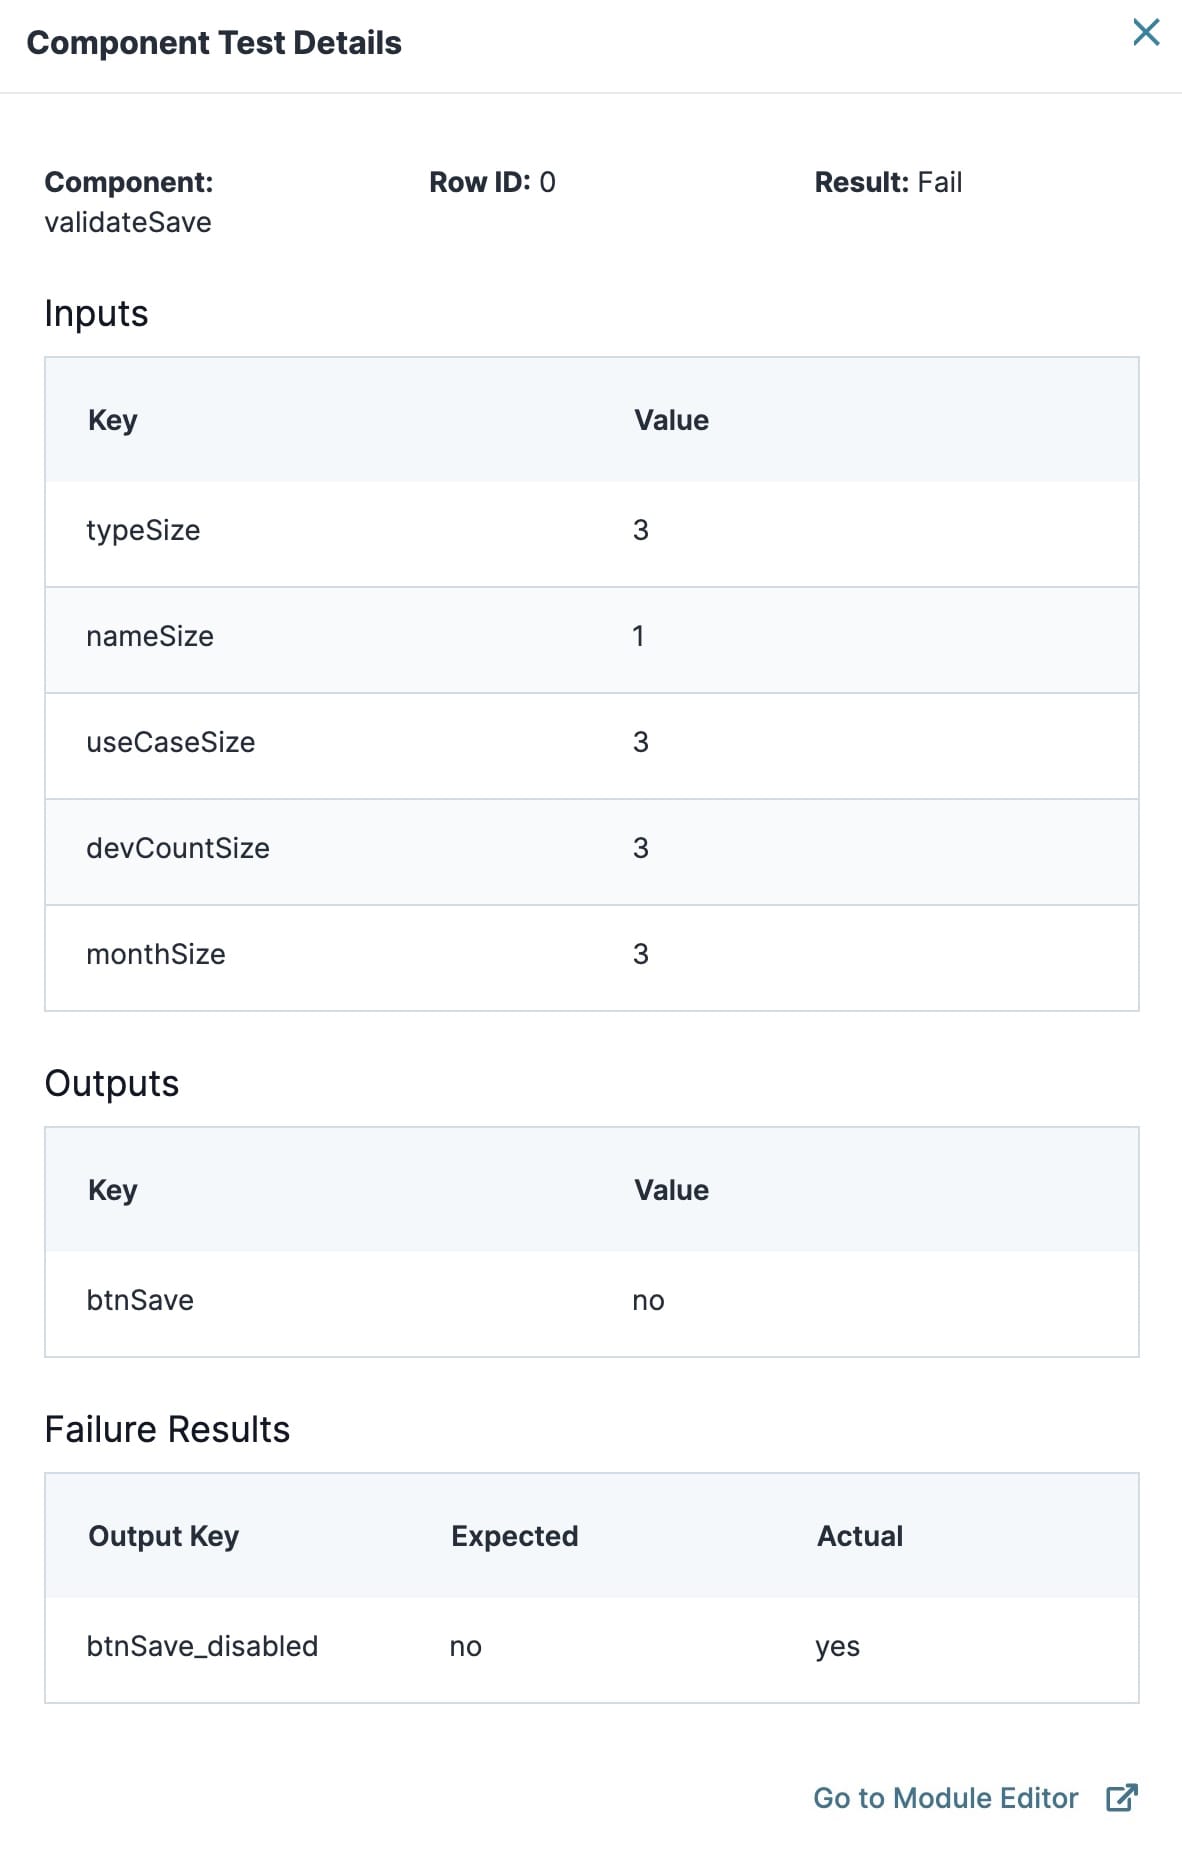
Click the Go to Module Builder link to open that module. Or, click the X (Close) at the top-right of the modal to return your focus to the Component Tests page.
Viewing Test Details
After using the filters to locate a module, you can view its details. The details displayed depend on the type of test you are viewing. Let's look at the test details for each test type.
Viewing API Test Details
After using the dashboard's filters to find a test, click its View API Test button. Clicking this button opens the API Test Details page. This page shows you information specific to your API module tests. The information differs slightly depending on the test, but the page always includes the following:
Attribute | Description |
|---|---|
Execute Test | Clicking this button executes the test manually. A modal displays confirming whether the test passed or failed. |
View Module in Designer | Click this link to open the API module being tested. |
Edit Test | Click this button to edit the test. The button lets you do the following:
|
Delete Test | Click this button to delete the test. |
Below these buttons and links, you'll see three tabs:
Details
Result
Service Logs
Let's look at the kinds of information each tab provides:
Viewing the Details Tab
No matter the API request Test Type, the Details tab has some common information. You'll see the following information for your API request test:
Attribute | Description |
|---|---|
Test Name | The name of the test. |
Test Type | The type of API test being run. The options you'll see in this column include:
|
Created | The date and time the test was created. |
Creator | The user who created the test. |
Active | Whether the test is active or inactive. It displays as either:
|
Module ID | The module ID of the module where this test exists. |
Submission ID | The submission ID of the submission tested. |
The information that displays depends on the test. The following table provides descriptions of the information you'll see for each test:
Test | Test Details |
|---|---|
Execution Sequence | For this test, you'll see the following information:
|
Match Response | For this test, you'll see the following information:
|
Validate Fields | For this test, you'll see the following information:
|
Here's an example of what the Details tab looks like for an Execution Sequence test: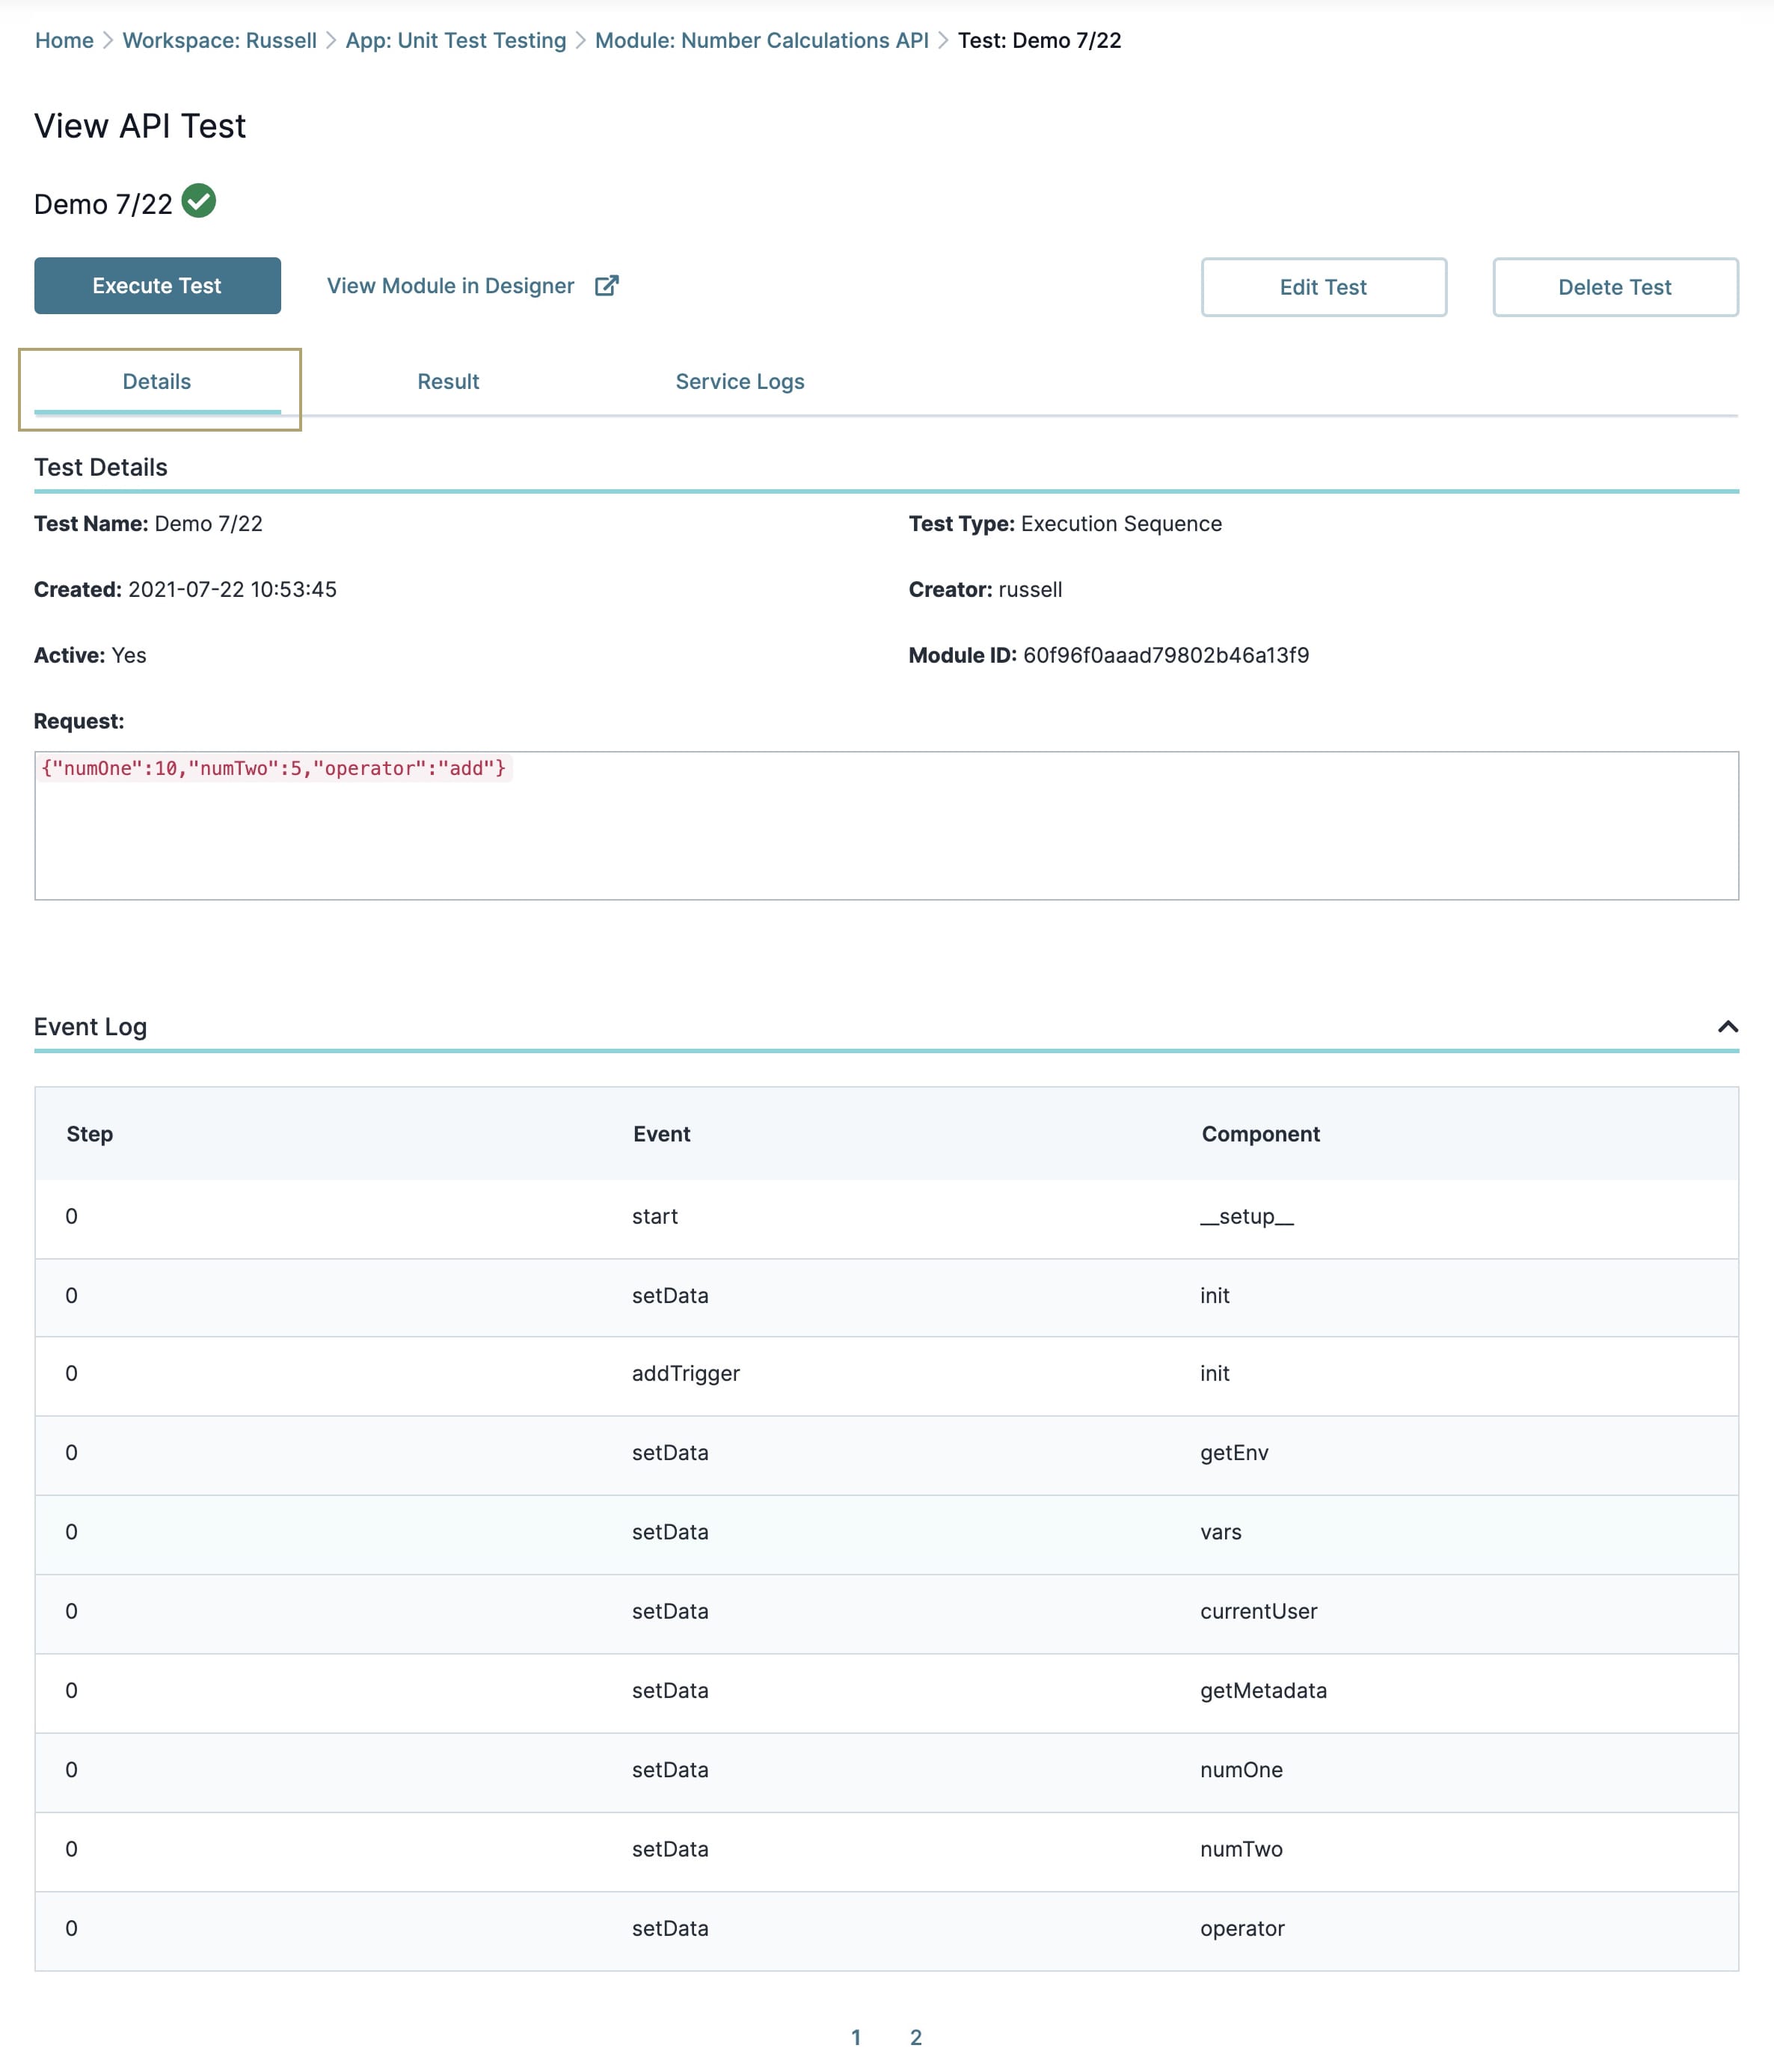
Viewing the Result Tab
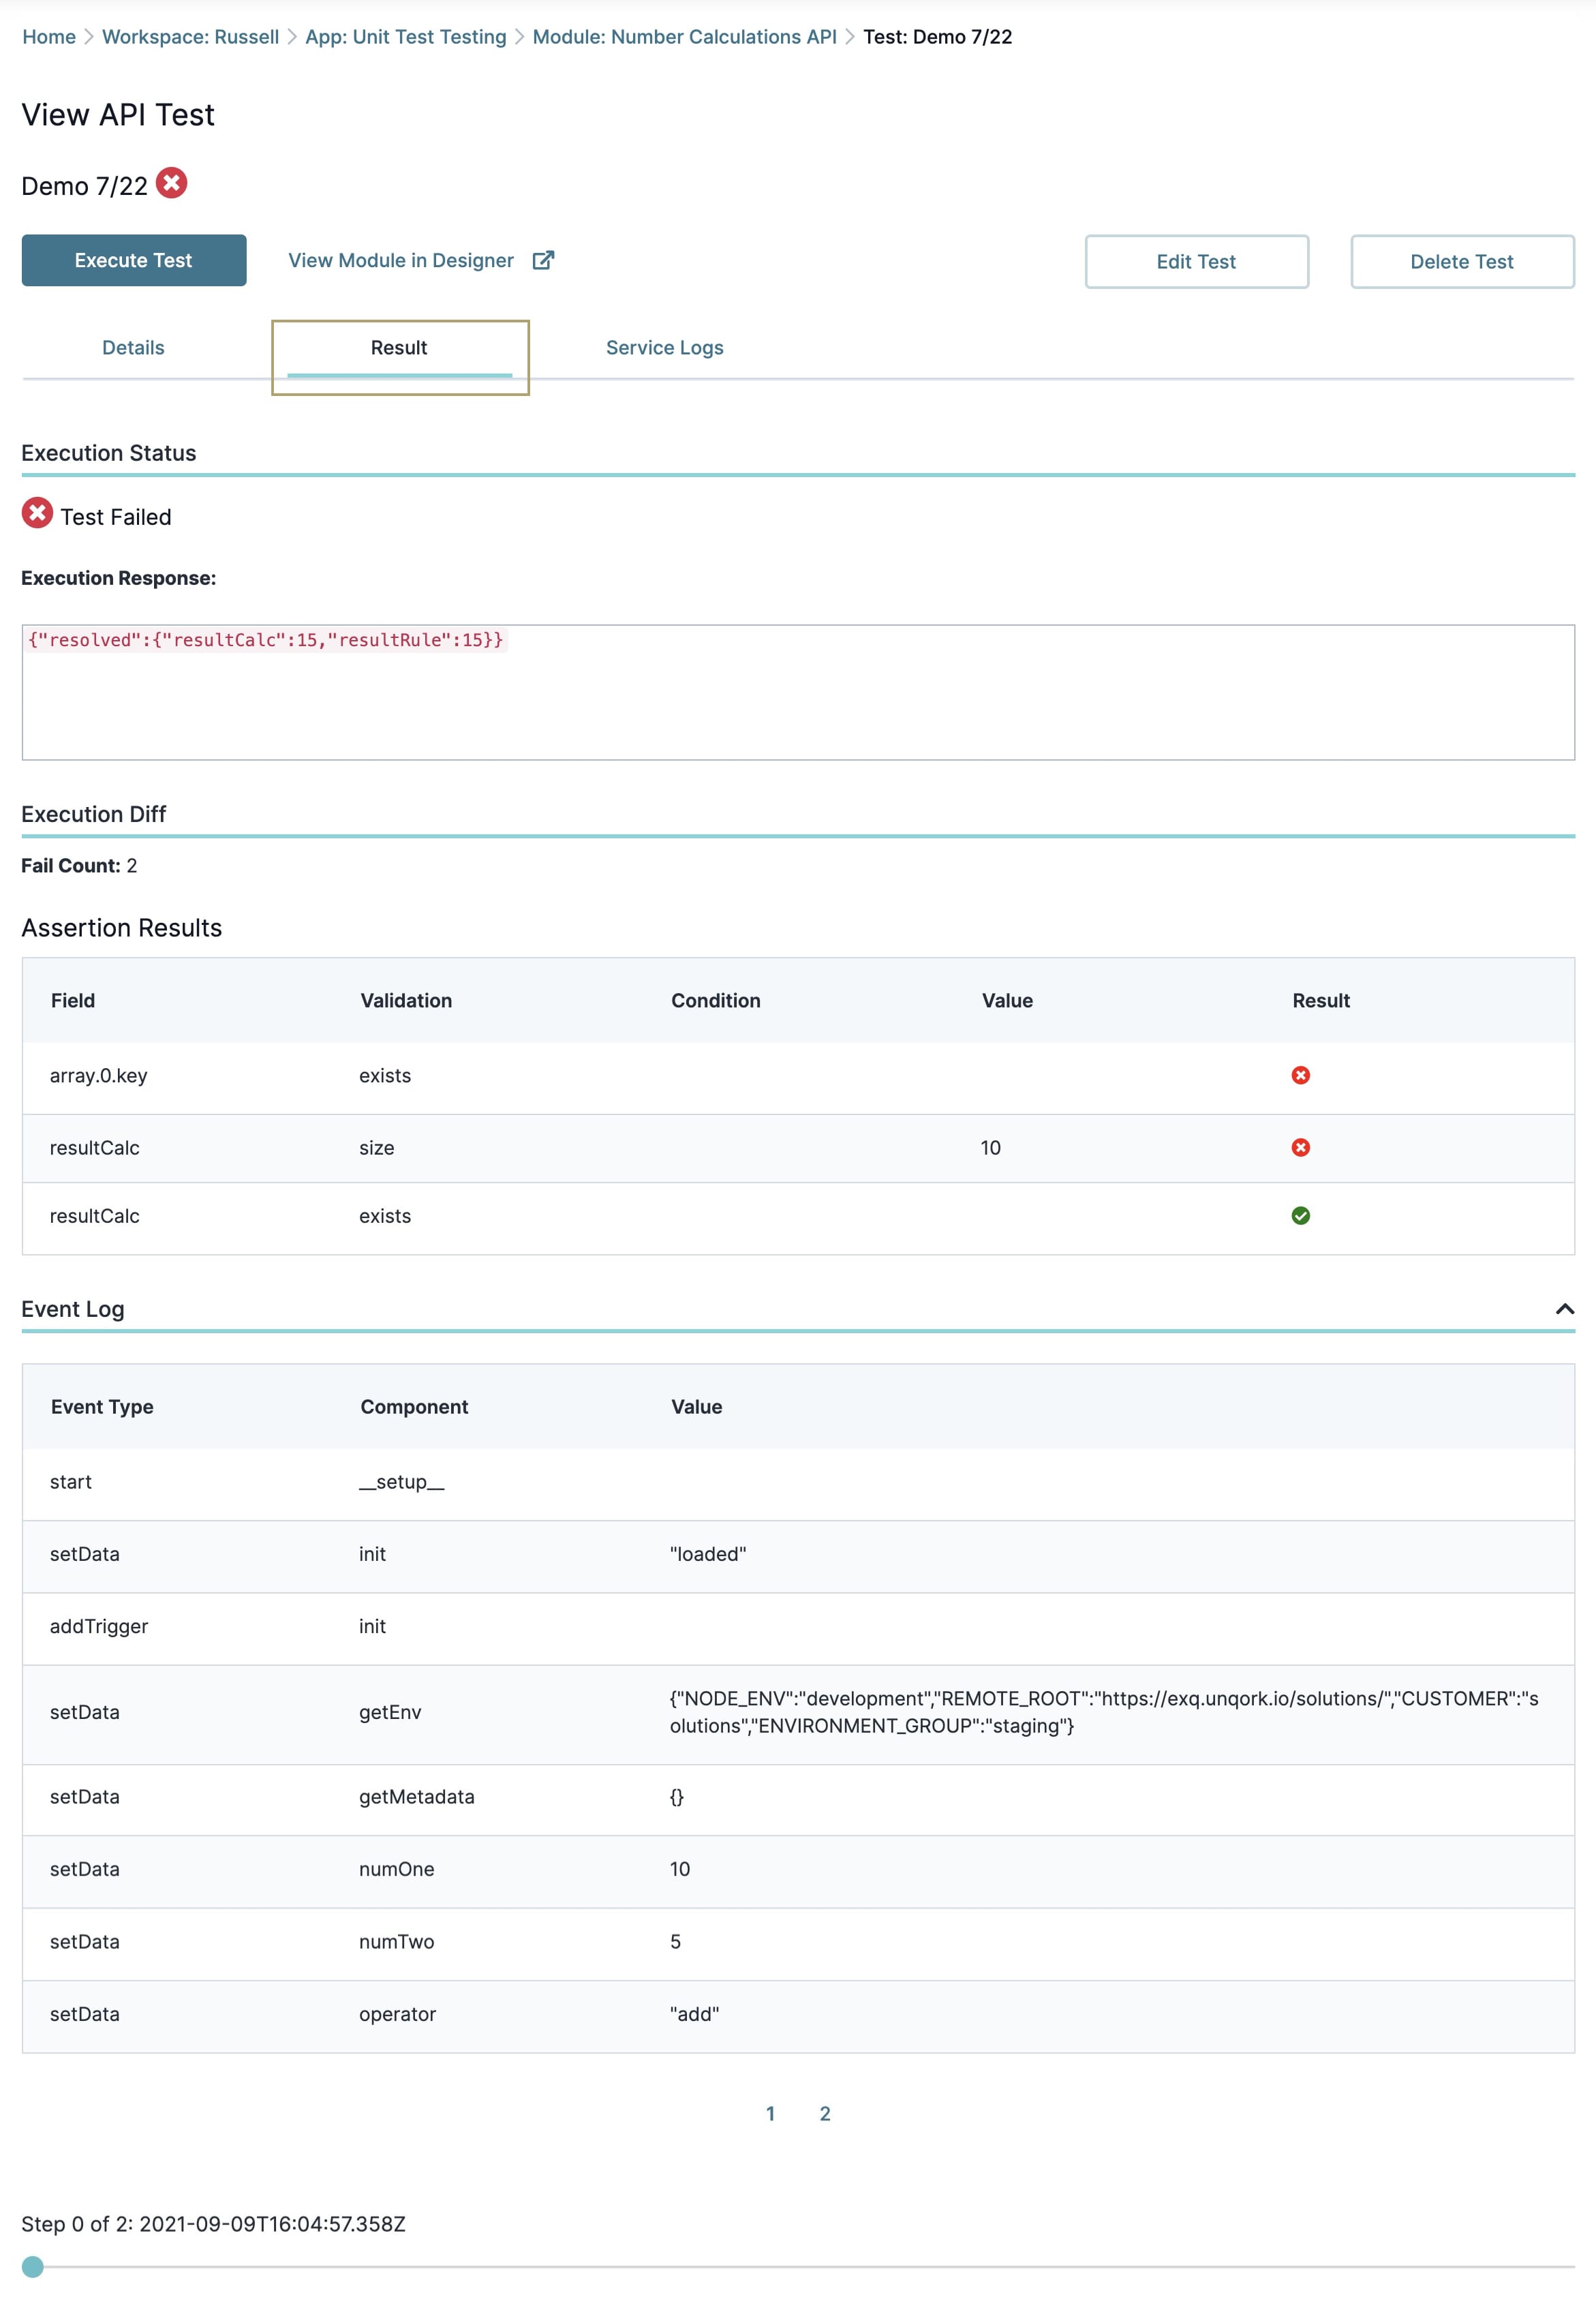
The Result tab is where you'll find out if your test passed or failed. It also shows you the executed API response and the execution sequence of your API call. An Event Log shows the components and their events at each step of the execution sequence. You can use the navigation bar to view all the steps and their events. For Validate Fields tests, you'll also see a table of assertion tests and their pass/fail results.
Below is an example of the Result tab for a failed Validate Fields test.
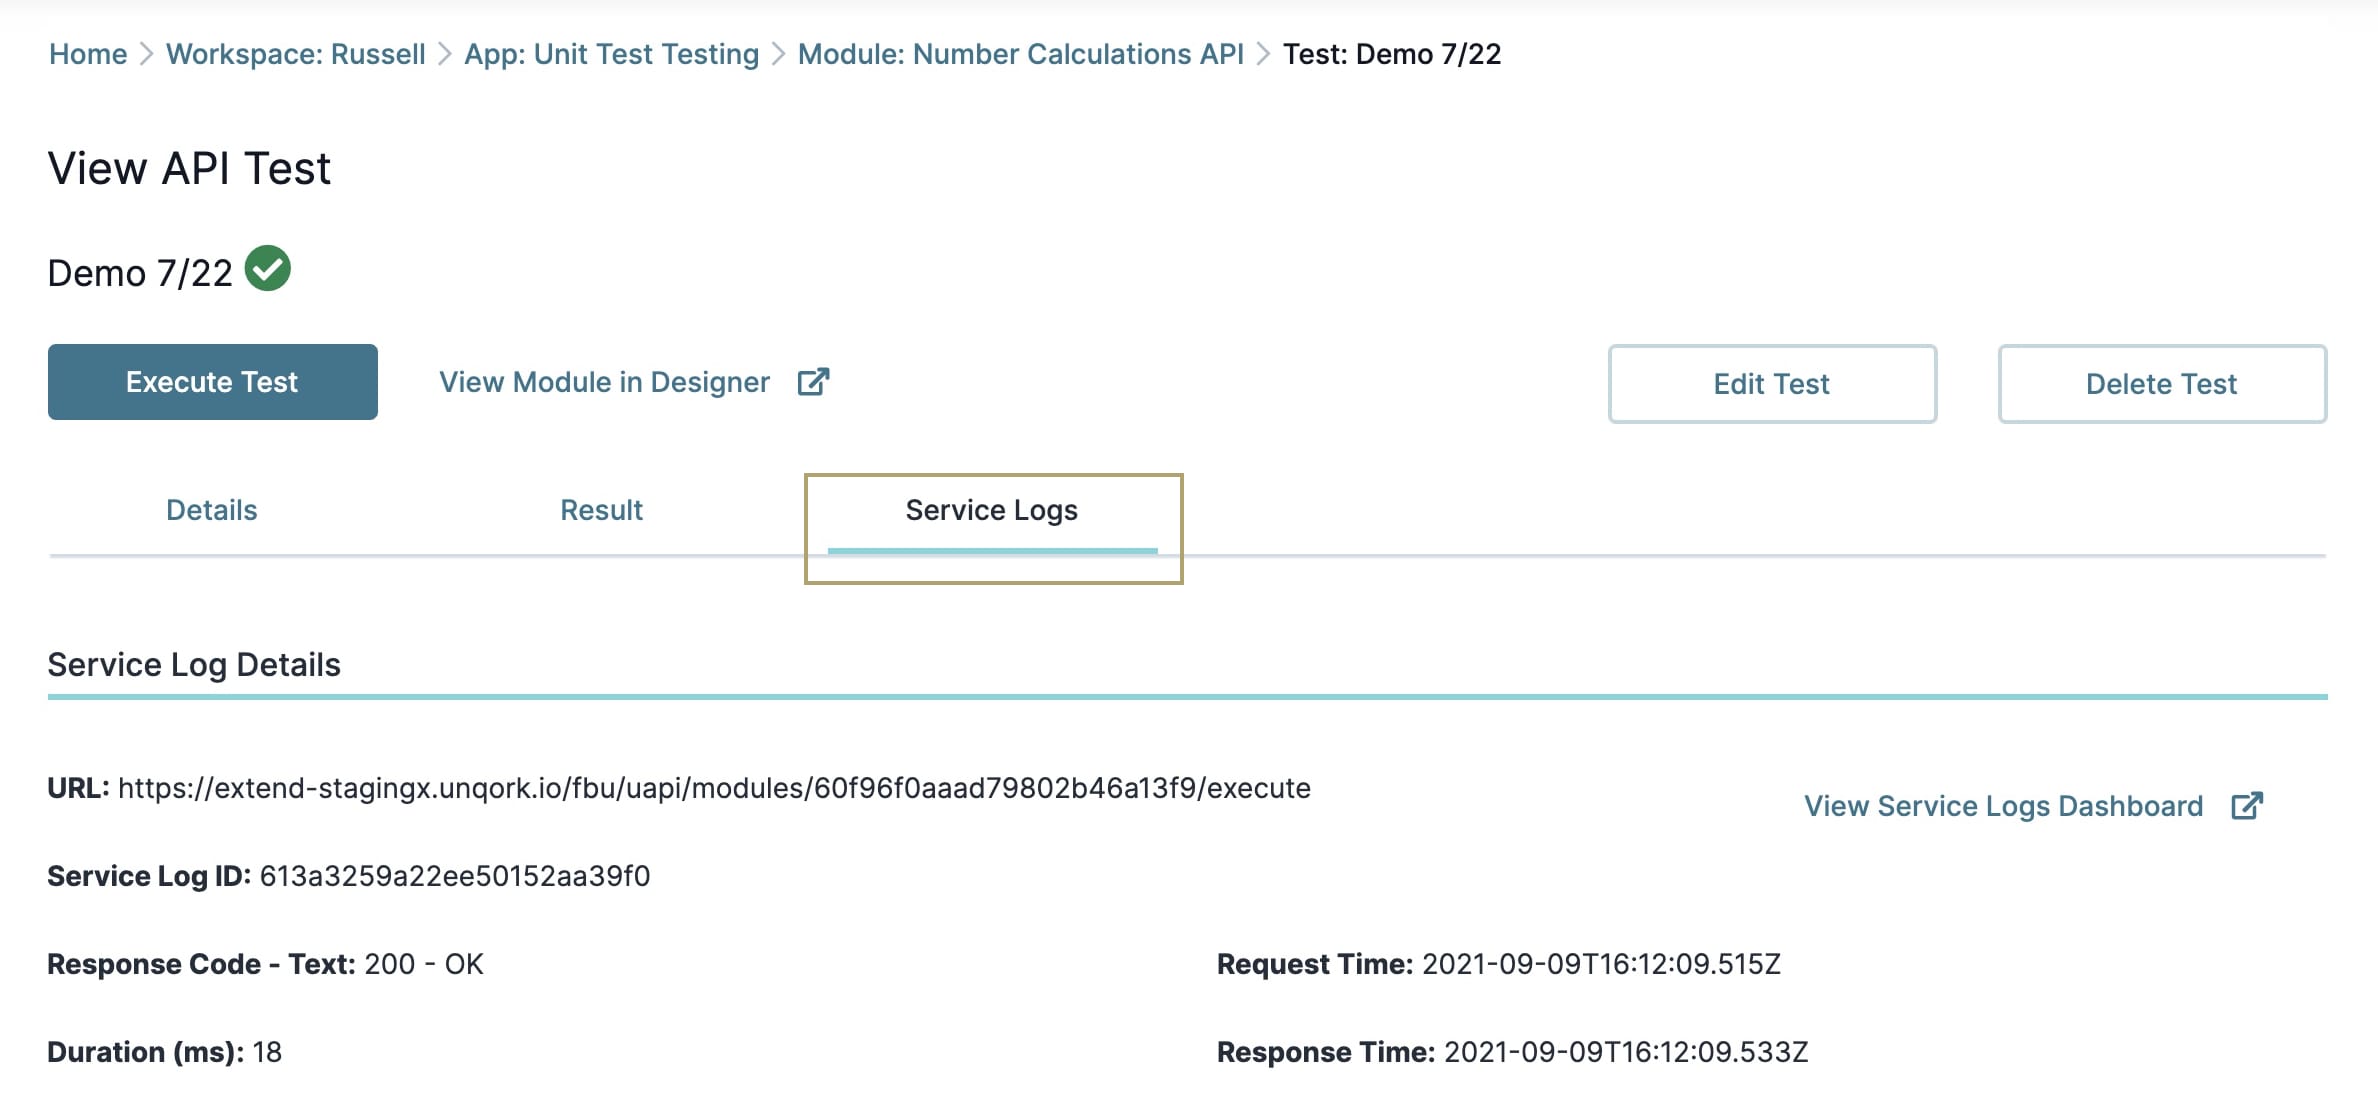
Viewing the Service Logs Tab
Every time an API call executes, you'll create a service log. The Service Logs tab shows you the logs for the most recent test execution. This tab shows the following information:
Attribute | Description |
|---|---|
URL | The URL for the tested API call. |
Service Log ID | The generated identifier when the API request executes. |
Response Code - Text | The response code for the API call. For instance, if the call is successful, you can expect 200 - OK. Other possible response codes can include 400 and 500 error codes. |
Duration (ms) | The time it took for the API call to finish. The time period is measured in milliseconds (ms). |
Request Time | The timestamp detailing when the API call started. |
Response Time | The timestamp detailing when the API call finished. |
View Service Logs Dashboard Link | Click this link to view this API module's service logs in greater detail. |
To learn more about the Service Logs Dashboard tool, search Service Logs Dashboard Tool article.
Here's an example of the Service Logs tab for an Execution Sequence test: