Logs Dashboard Tool
Overview
Use the Logs Dashboard Tool to find troublesome API requests. Without it, you'd have to search through your entire environment's API requests. The tool also comes with extra filters to make it even easier to find a specific request. Once found, you can return to the module performing the request and fix it.
You can use the Logs Dashboard tool to look at 2 types of API (application programming interface) requests in your environment:
-
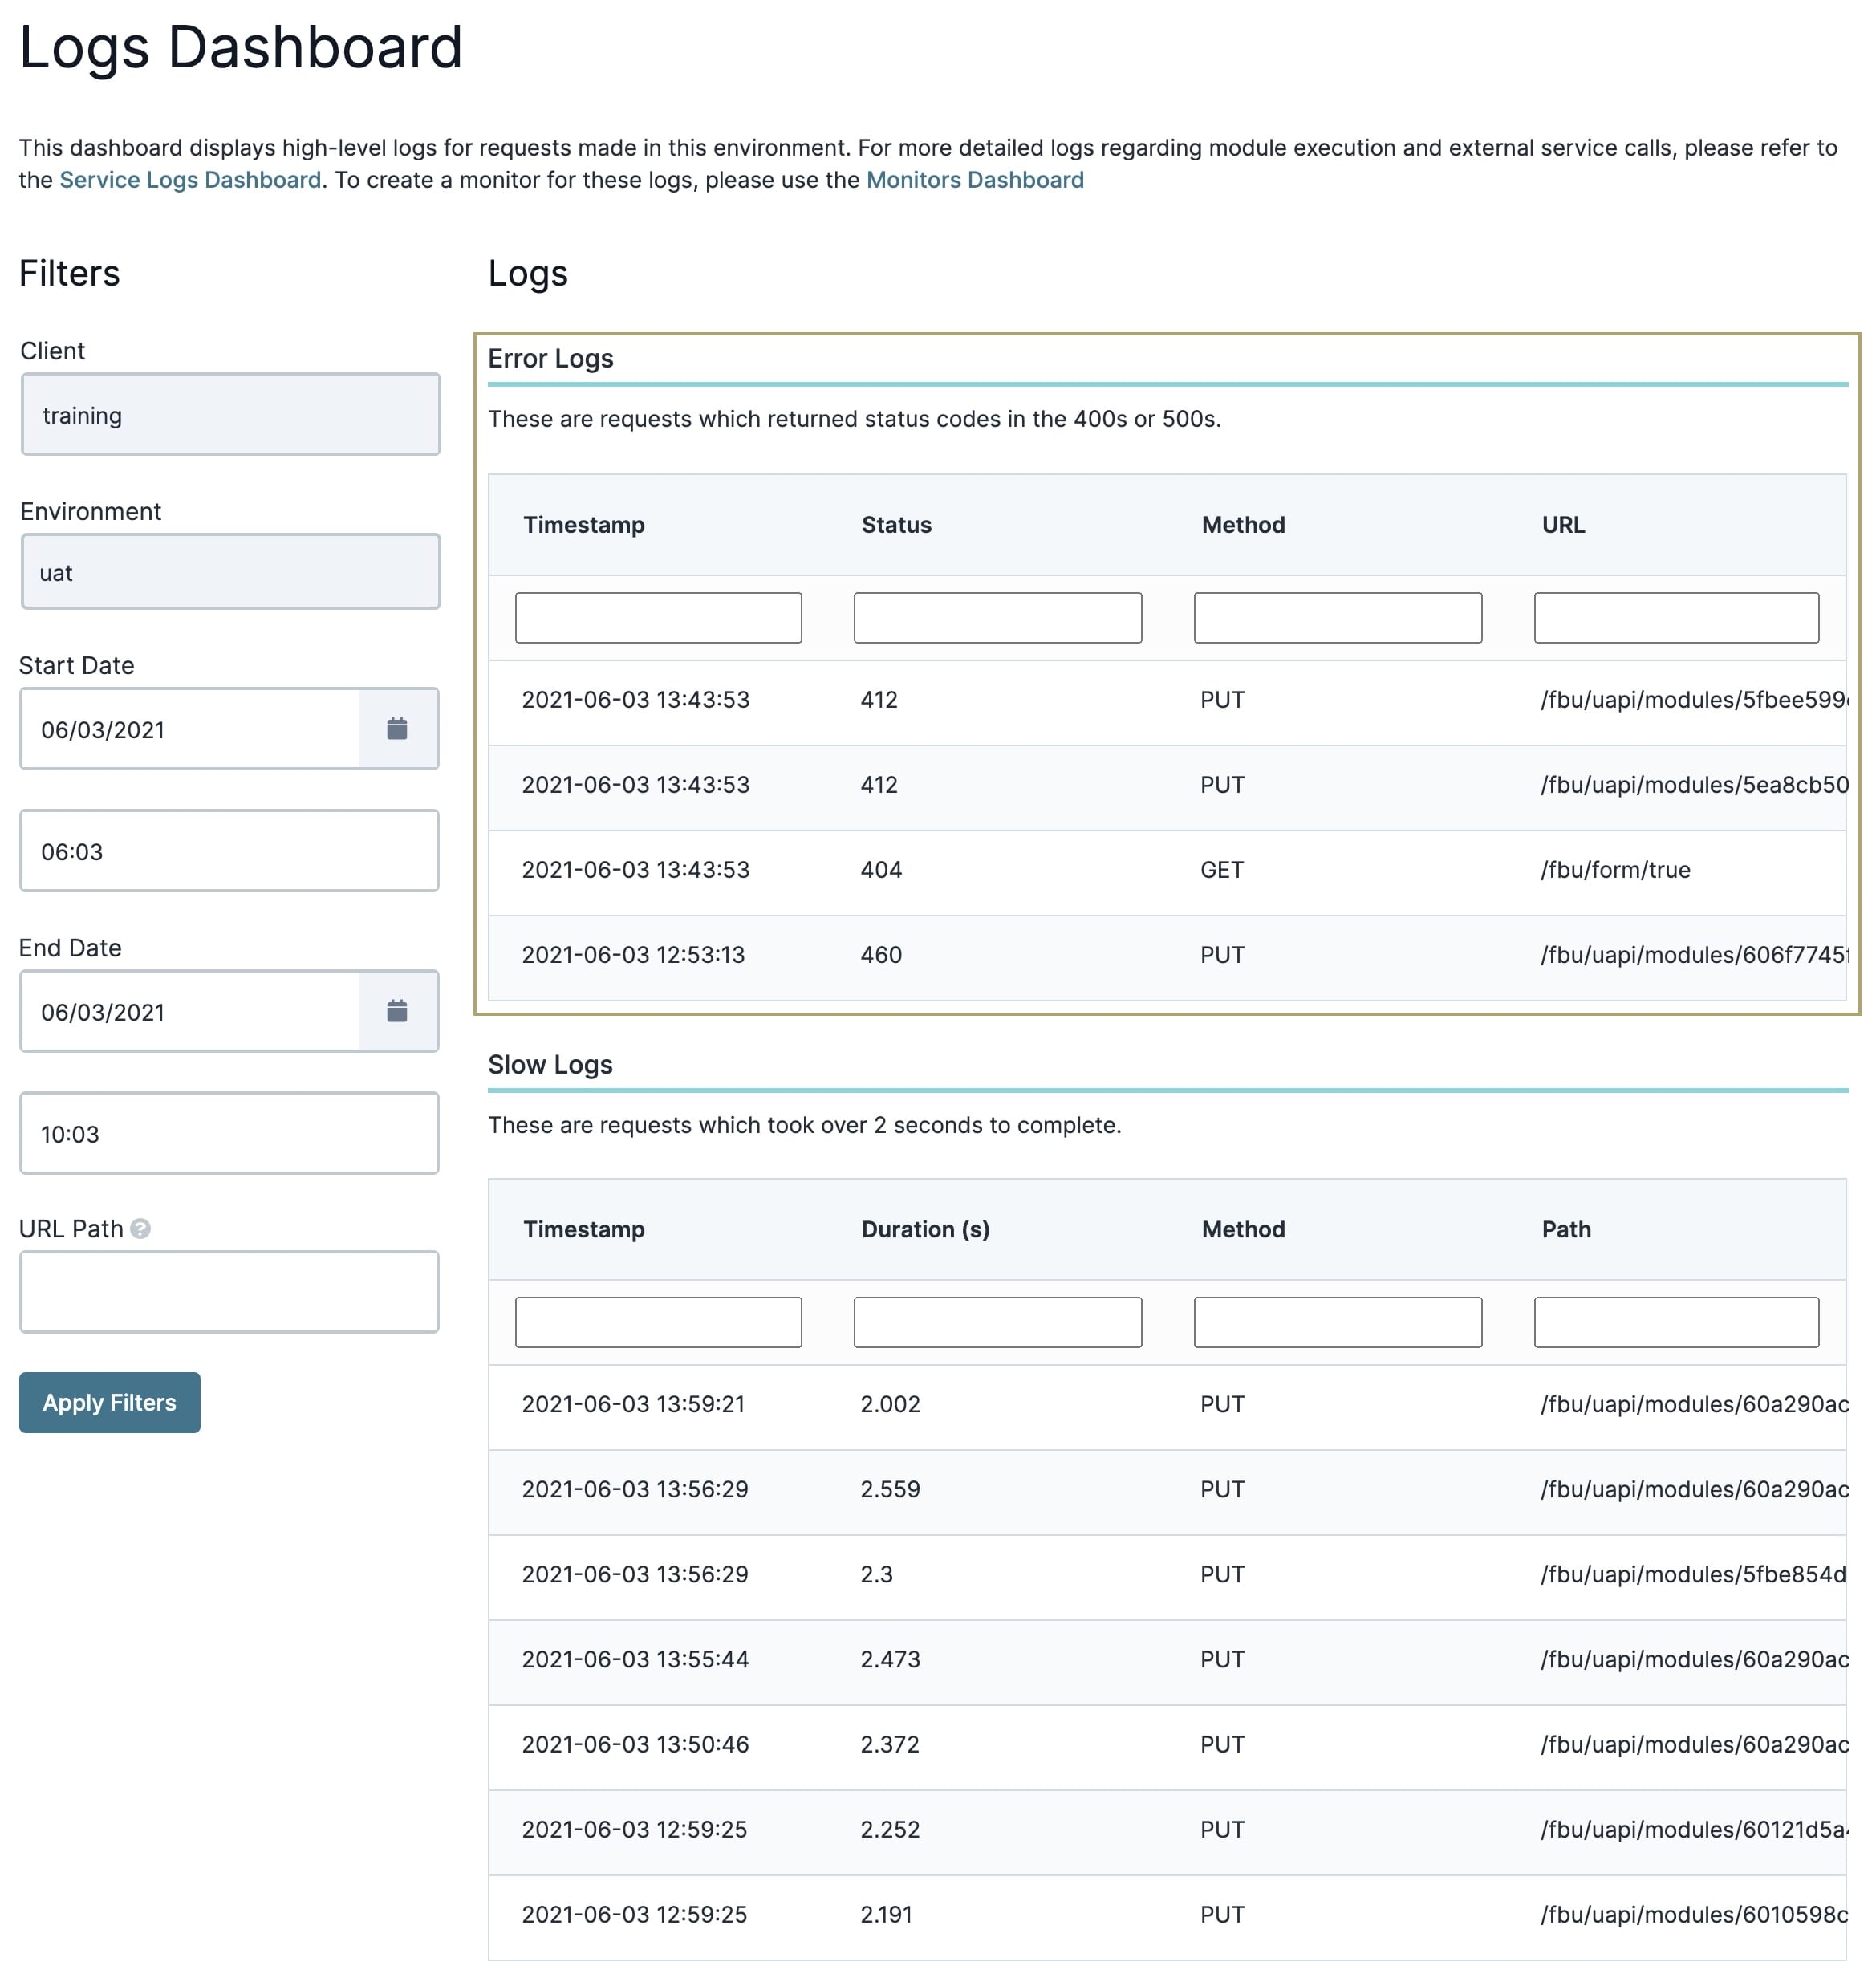
API requests with 400 and 500 level response codes. All 400 codes are client error codes. And 500 codes are server error codes.
-
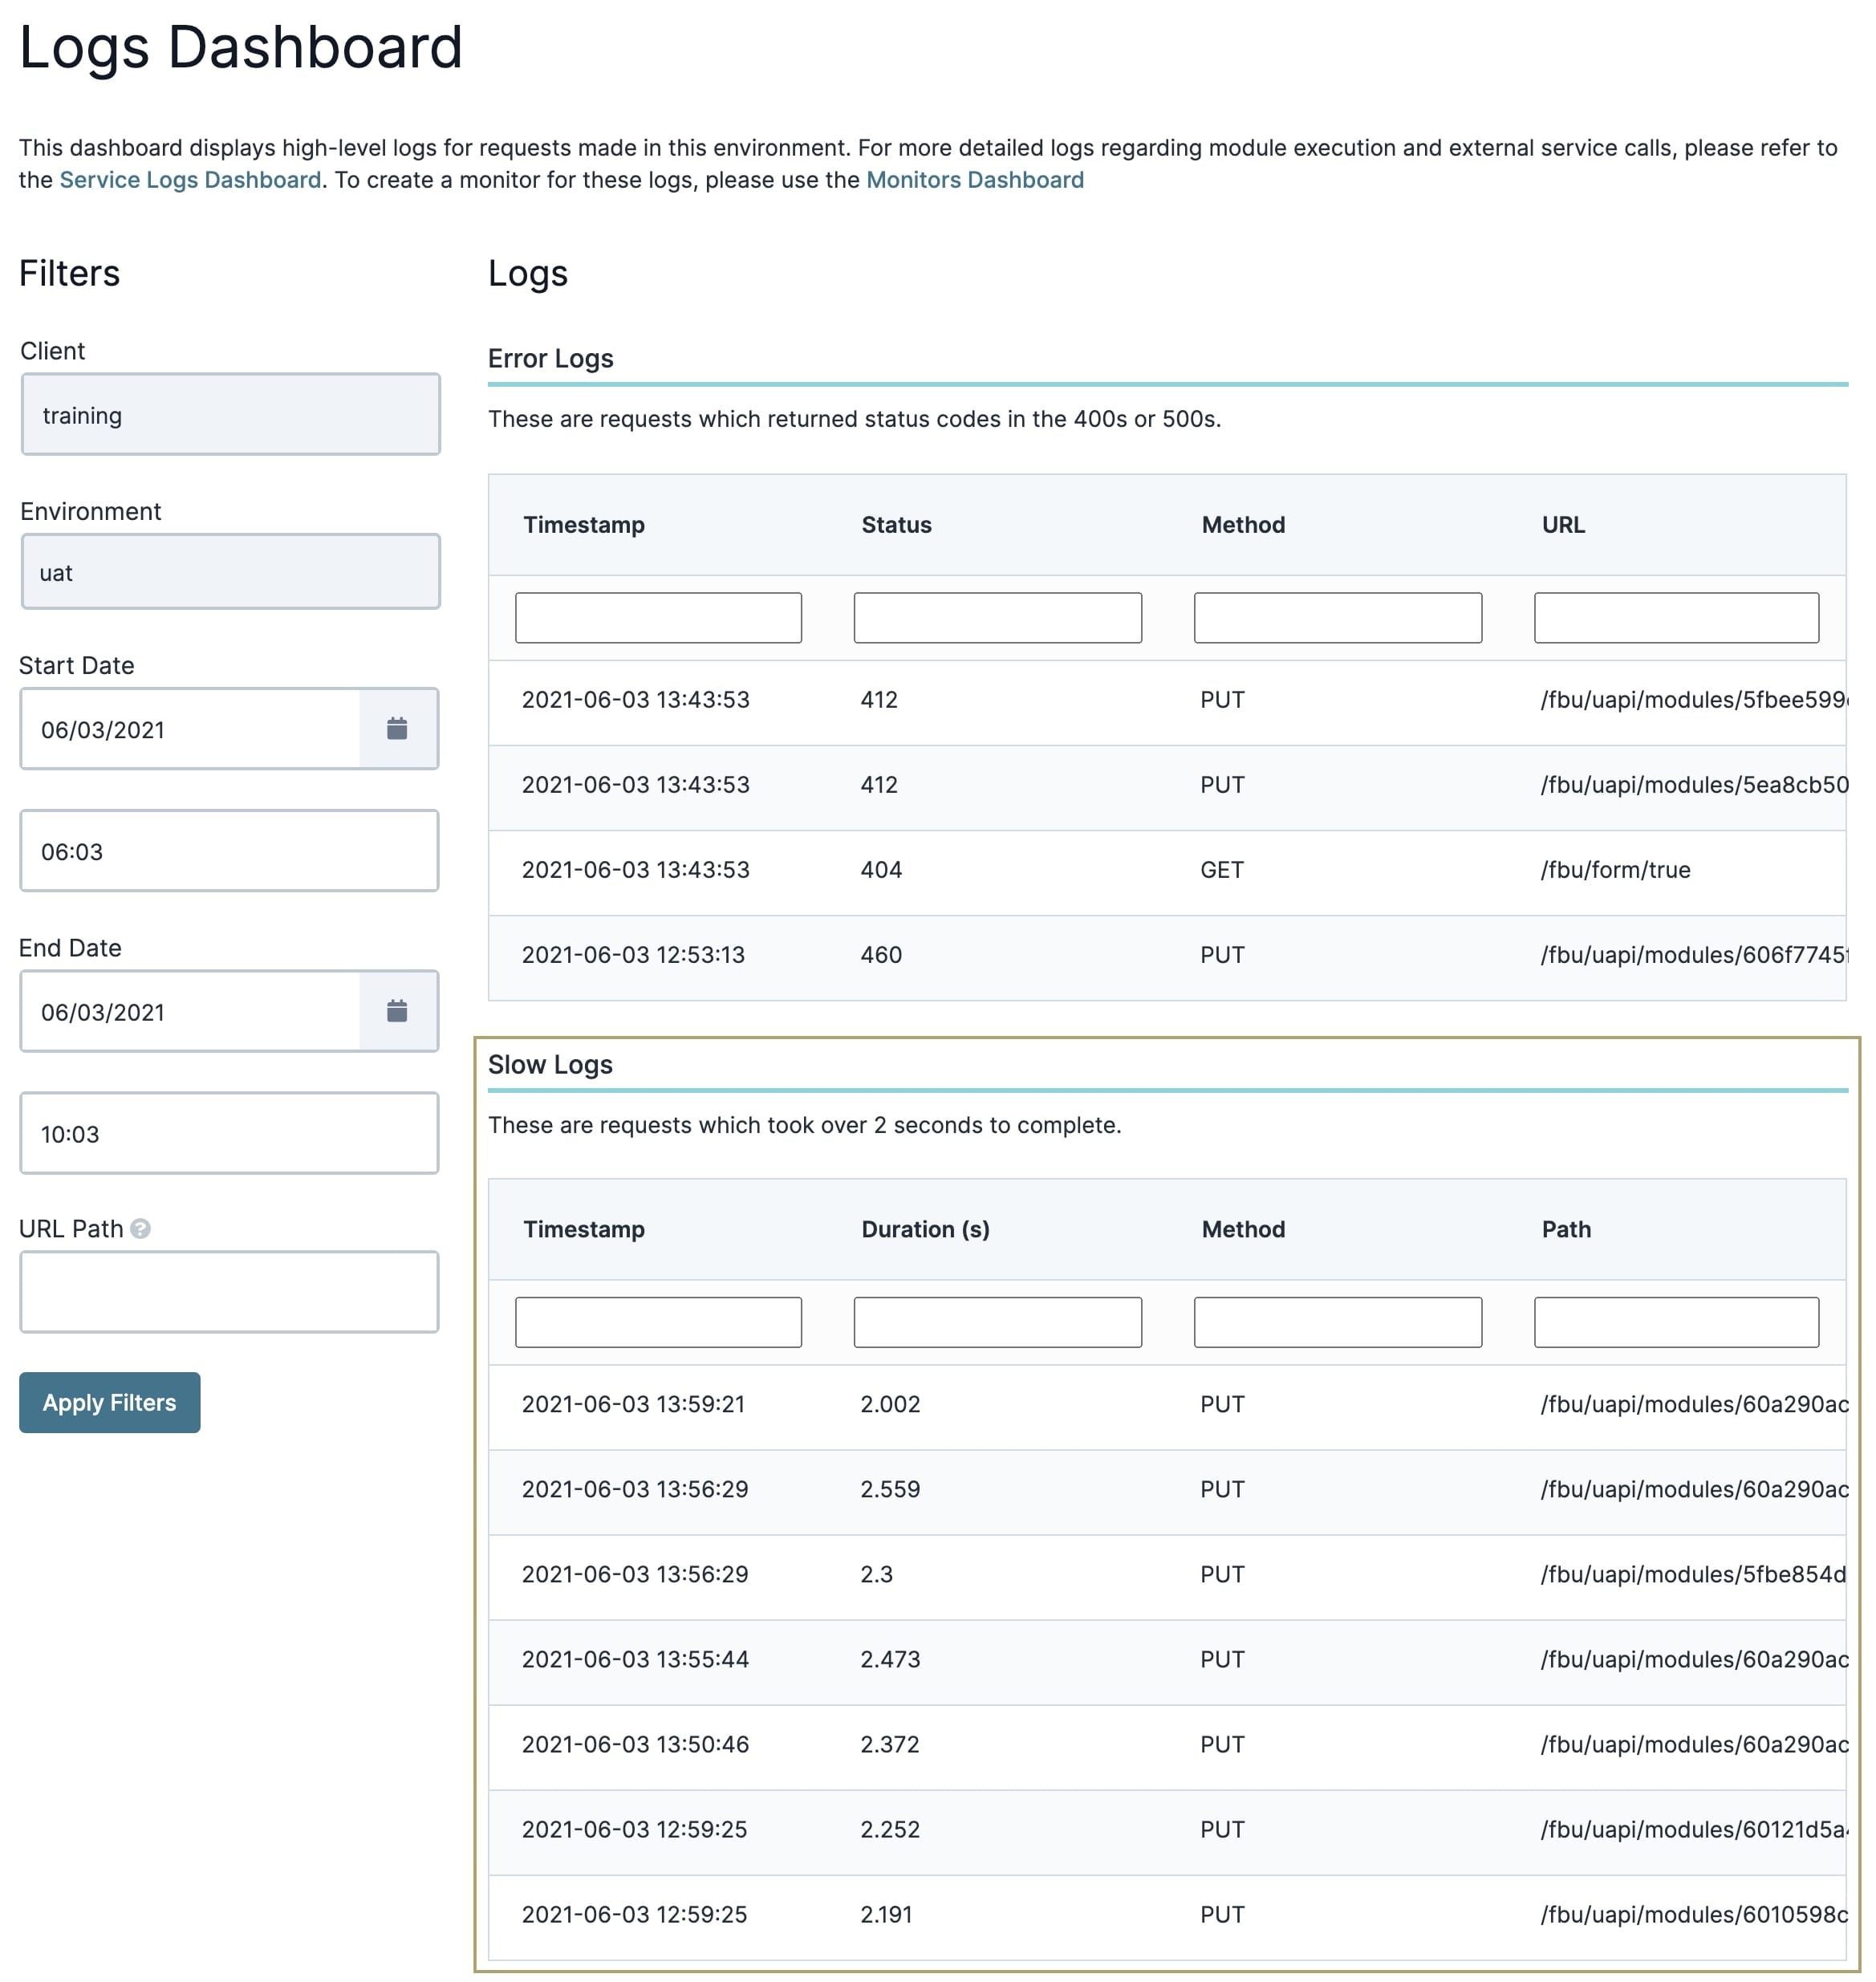
API requests that take longer than 2 seconds to complete.
The Alerts Dashboard tool only supports AWS (Amazon Web Services) integration. It does not currently support Azure source logs.
The UDLC Logs Dashboard captures requests that ingress into the environment and the UDLC Service Logs Dashboard captures requests that egress out of the environment.
The tool only shows you the basic information about your requests. For more detailed information, you'll use the Service Logs Dashboard tool.
To learn more about the Service Logs Dashboard tool, search Service Logs Dashboard Tool in our In-Product Help.
What You'll Learn
In this article, you'll learn how to:
Filtering the Logs Dashboard
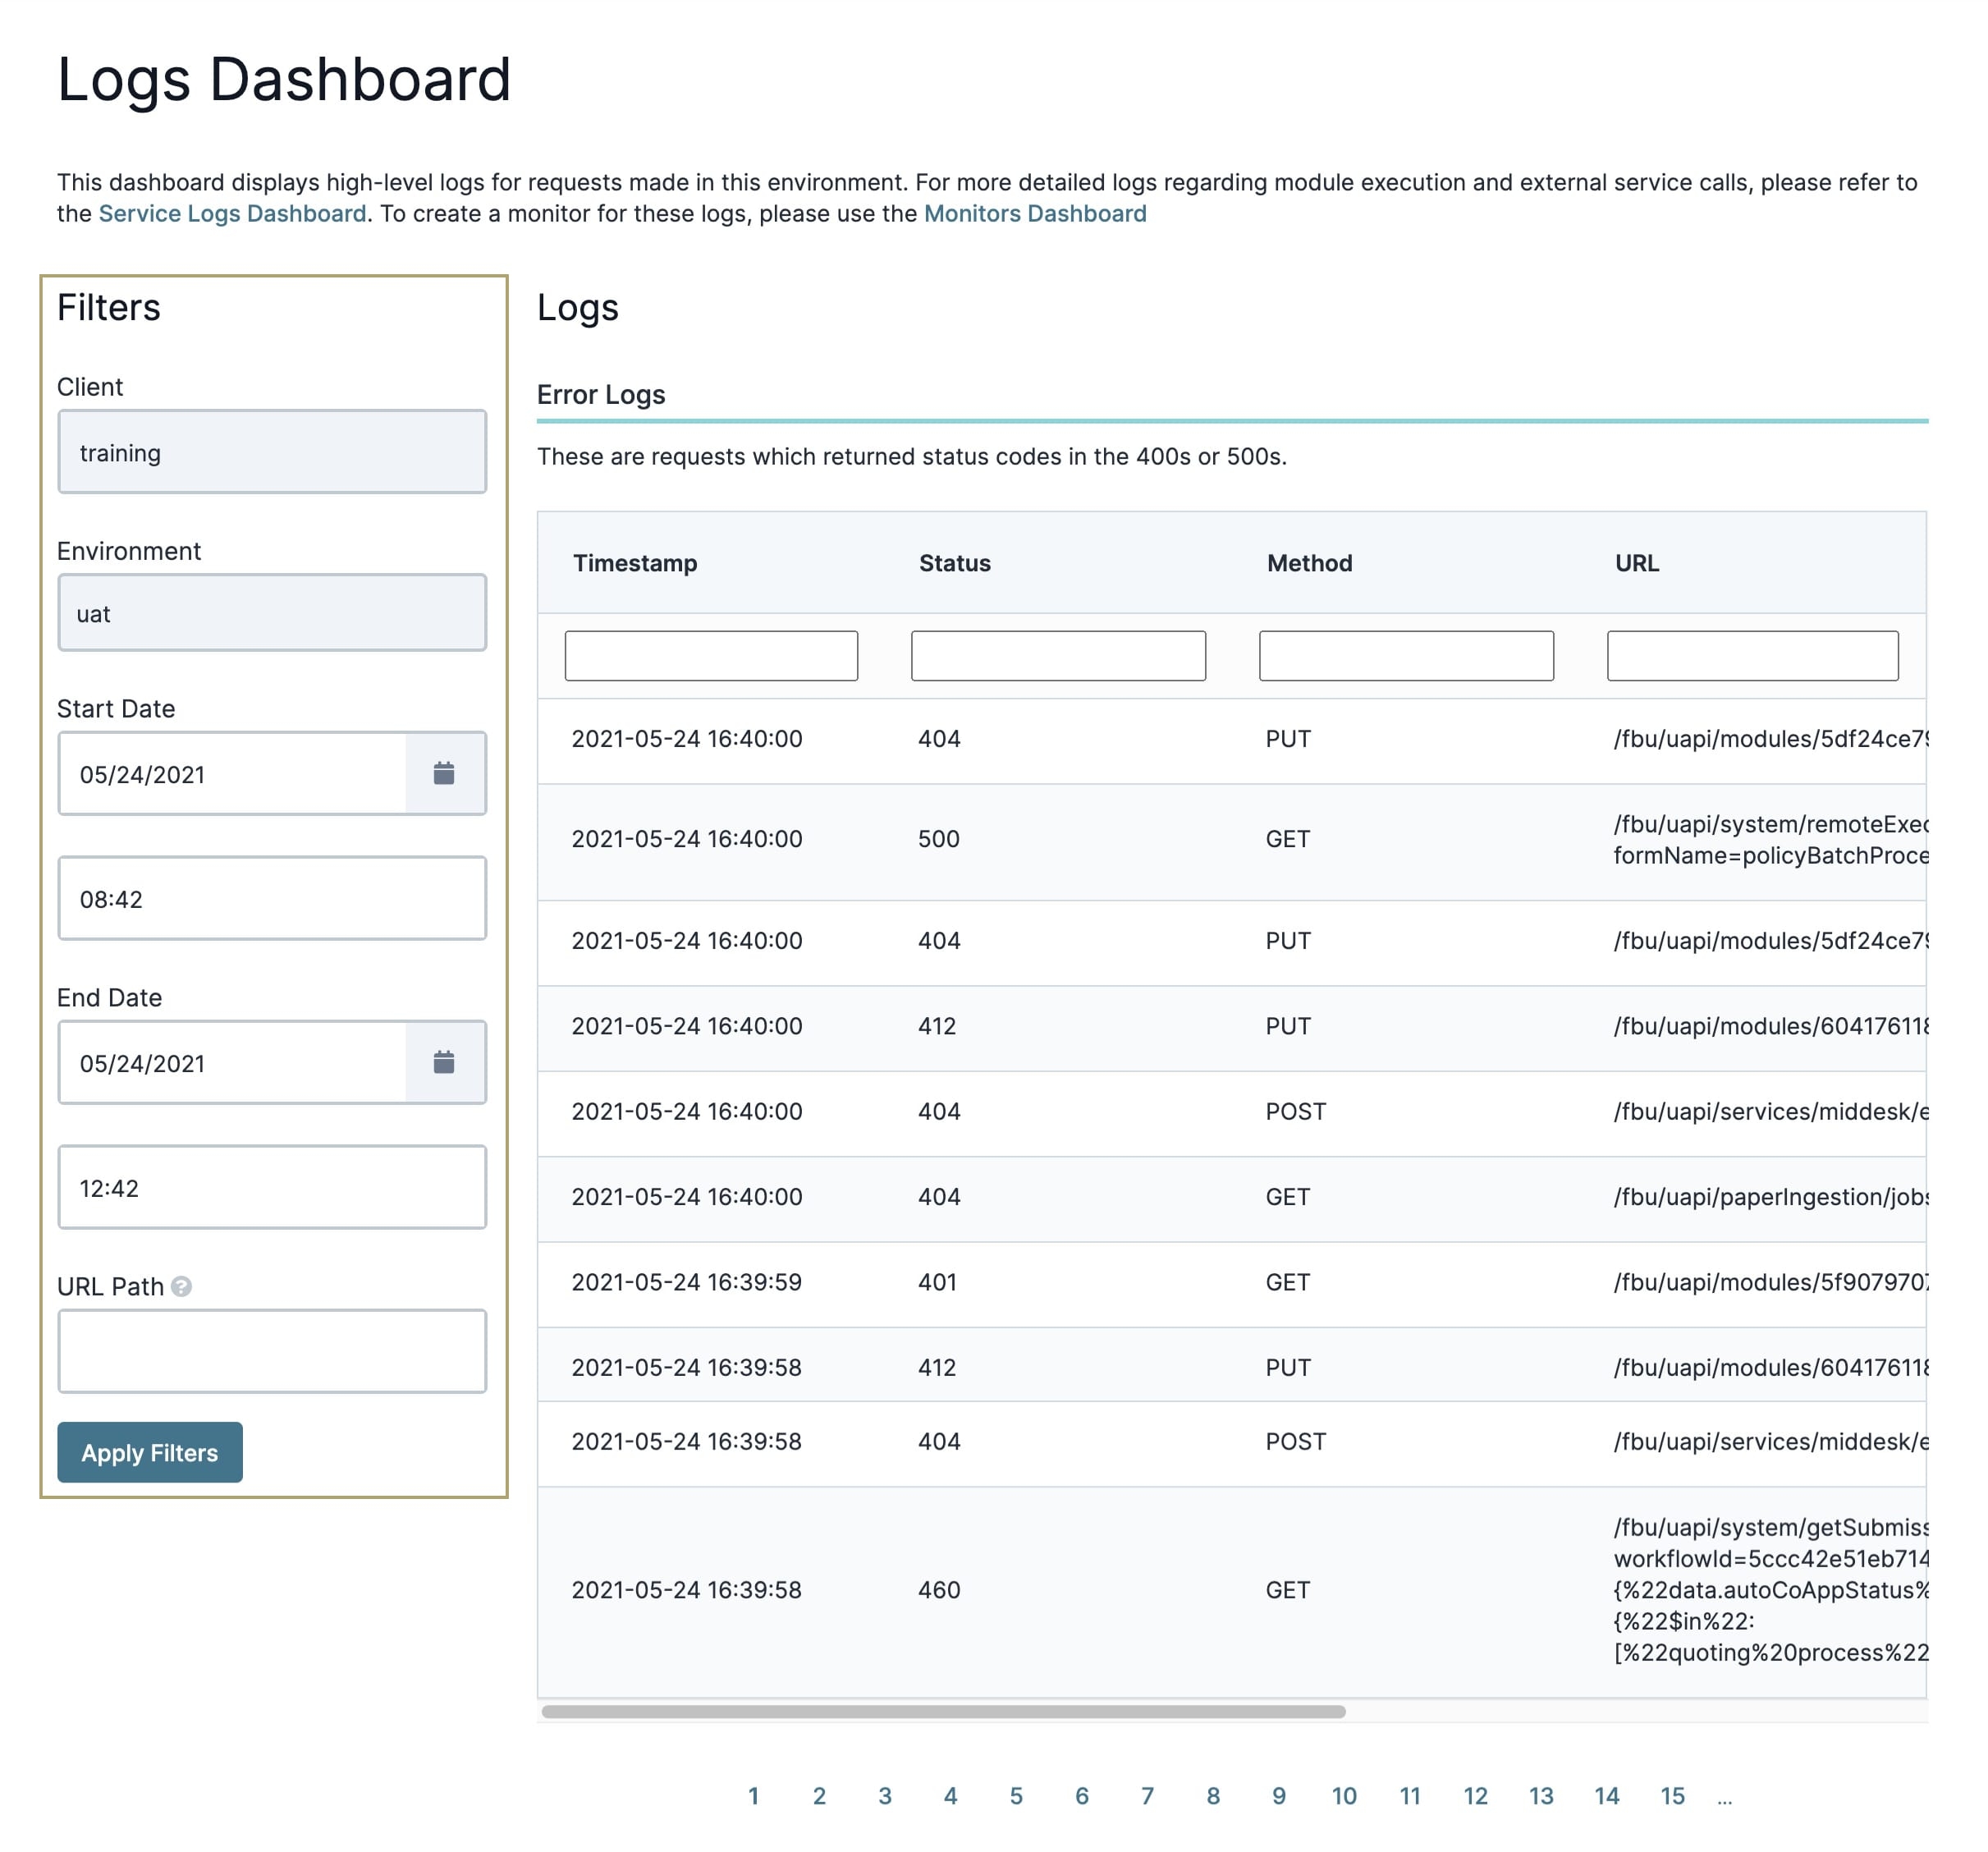
The Logs Dashboard shows all troublesome API requests in your environment. Potentially, this could be a large number of requests. So, the tool comes with built-in filters to save you time. You can filter by either a date and time range or by the request's URL path. When you open the tool, the date and time range sets automatically. It'll give you a list of all slow and error-prone requests in the last 4 hours. You can use these defaults to find a specific request or change them as needed.
Let's look at the filters in more detail:
| Filter | Description |
|---|---|
|
Client |
Your Unqork client credentials. These automatically populate when you open the tool. |
|
Environment |
Your current Unqork environment. This field automatically populates when you open the tool. |
|
Start Date |
The start date and time you want to filter API requests. These fields automatically populate with:
|
|
End Date |
The end date and time you want to filter API requests. These fields automatically populate with:
|
|
URL Path |
Use this field to filter by a portion of the URL path of the API request. You can enter an API endpoint, like GetSubmissions, or a module ID here. Every call that includes that portion of the URL will populate in the Logs Dashboard. |
The only fields you can't change are the Client and Environment fields. Use any of the other filters to modify your search.
For instance, to change the date and time range:
| 1. | Set the Start Date using the date picker. |
| 2. | Enter a time in the field below the Start Date picker. Enter a time based on the 24-hour clock. |
| 3. | Set the End Date using the date picker. |
| 4. | Enter a time in the field below the End Date picker. Enter a time based on the 24-hour clock. |
| 5. | Click Apply Filters. |
Navigating the Logs Dashboard
The Logs Dashboard consists of 2 tables:
-
Error Logs
-
Slow Logs
Each table has its own built-in filters to help you find a specific API request. You can use any or all these filters, depending on how specific you want to be. As you enter text into the fields, the results appear automatically. Or, if you prefer, click the pagination buttons below the table to see more API requests. By default, the table shows 10 requests at a time.
Let's take a look at each table.
Navigating the Error Logs Table
In the Error Logs table, you'll find API requests with 400 and 500 level response codes. Remember:
-
400 codes are client error codes.
-
500 codes are server error codes.
There are also filters you can use to help you find a specific API request. These filters include:
| Filter | Description |
|---|---|
|
Timestamp |
The date and time the API request was made. The tool uses your current timezone. |
|
Status |
The response code from the API call. |
|
Method |
The execution method of the API call (GET, PUT, PATCH, POST, DELETE). |
|
URL |
Use this field to filter by a portion of the URL path of the API request. You can enter an API endpoint, like GetSubmissions, or a module ID here. Every call that includes that portion of the URL will populate in the Logs Dashboard. |
Navigating the Slow Logs Table
An ideal API request typically takes milliseconds to complete. But, anything below a 1-second completion time is acceptable. As complexity increases, API requests can take longer to complete. Any completion time beyond 2 seconds is slow. You'll find all your environment's slow API requests in the Slow Logs table.
Use the table's filters to make it easier to find a slow request:
| Filter | Description |
|---|---|
|
Timestamp |
The date and time the API request was made. The tool uses your current timezone. |
|
Duration (s) |
The time it takes the API request to complete. The duration is measured in seconds. |
|
Method |
The execution method of the API call (GET, PUT, PATCH, POST, DELETE). |
|
Path |
Use this field to filter by a portion of the URL path of the API request. You can enter an API endpoint, like GetSubmissions, or a module ID here. Every call that includes that portion of the URL will populate in the Logs Dashboard. |


