Overview
The Testing App Dashboard is a lot like the other Testing tool dashboards. But, this dashboard shows you the test metrics of a specific application in your workspace. You also see the application's modules and their individual tests. You'll find important details like:
The test coverage for that application.
The percent success rate.
The overall test status of that application.
This dashboard also populates with all the modules in your application. The dashboard includes a variety of filters to help you find and sort this information. Some of these filters include:
Helping to determine which application modules are API (application programming interface) modules.
Sorting module tests by success rate.
Sorting by test coverage.
Once you find an application, you can view its modules and tests in greater detail.
To learn more about creating API tests with the Testing tool, view our Creating API Tests article.
Viewing an Application's Tests
The tool's dashboards are sequential. So, when you open the tool, you begin at the highest level of your Unqork creations. In this case, Workspaces. The first thing you'll do is select a workspace. Then, you'll view its applications:
Select a workspace using the Workspace drop-down.
Use the dashboard's filters to find a specific application.
Click the application's View App Tests button to view its test details.
You've now opened the Testing App Dashboard for that specific application.
If you want to view the application in the Unqork Designer Platform, click the View App in Workspace link in the top-right corner.
The following clip shows you how to view your application's tests from the Testing Workspace Dashboard:
Viewing the Application Test Metrics
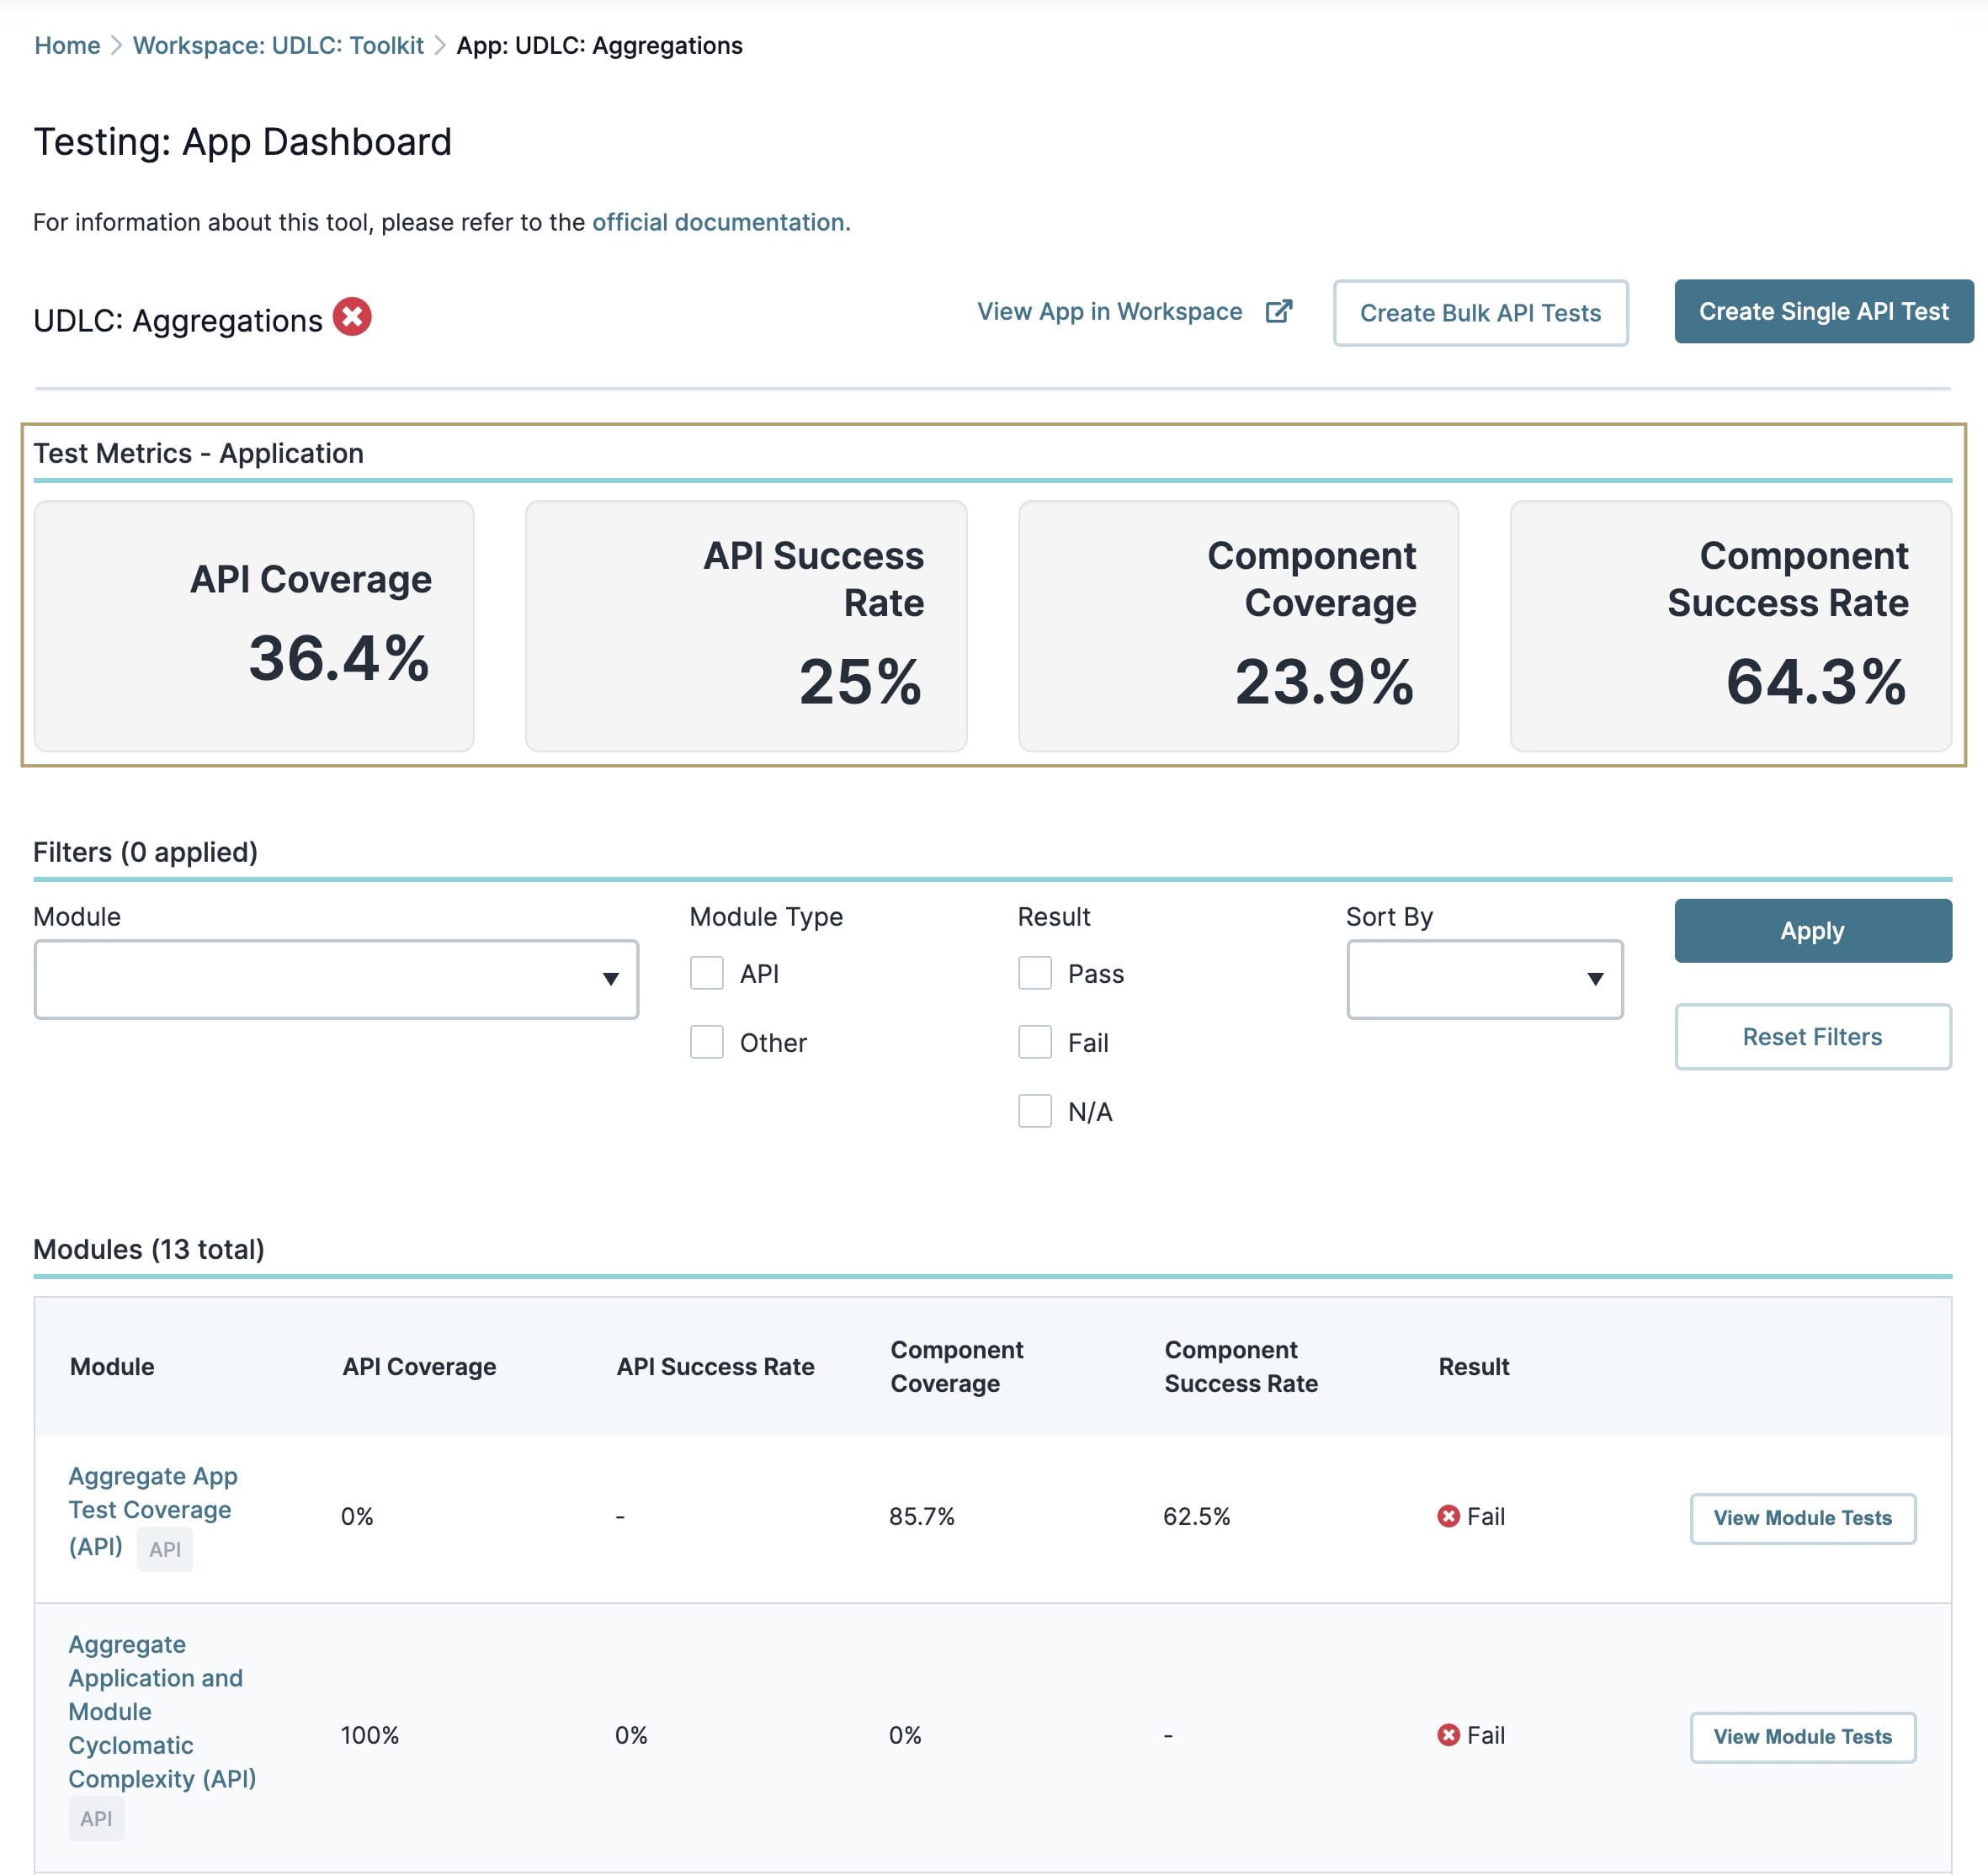
When you arrive on the Testing App Dashboard, you'll see your application's test metrics. As you add, edit, or remove tests in this application, the results in this section change in real-time. Below is a description of the different metrics in this section:
Test Metric | Description |
|---|---|
API Coverage | The percentage of all API modules that have tests in this application. |
API Success Rate | The percentage of successful API tests in this application. |
Component Coverage | The percentage of all module components that have tests in this application. |
Component Success Rate | The percentage of successful component tests in this application. |
Using the Testing App Dashboard's Filters
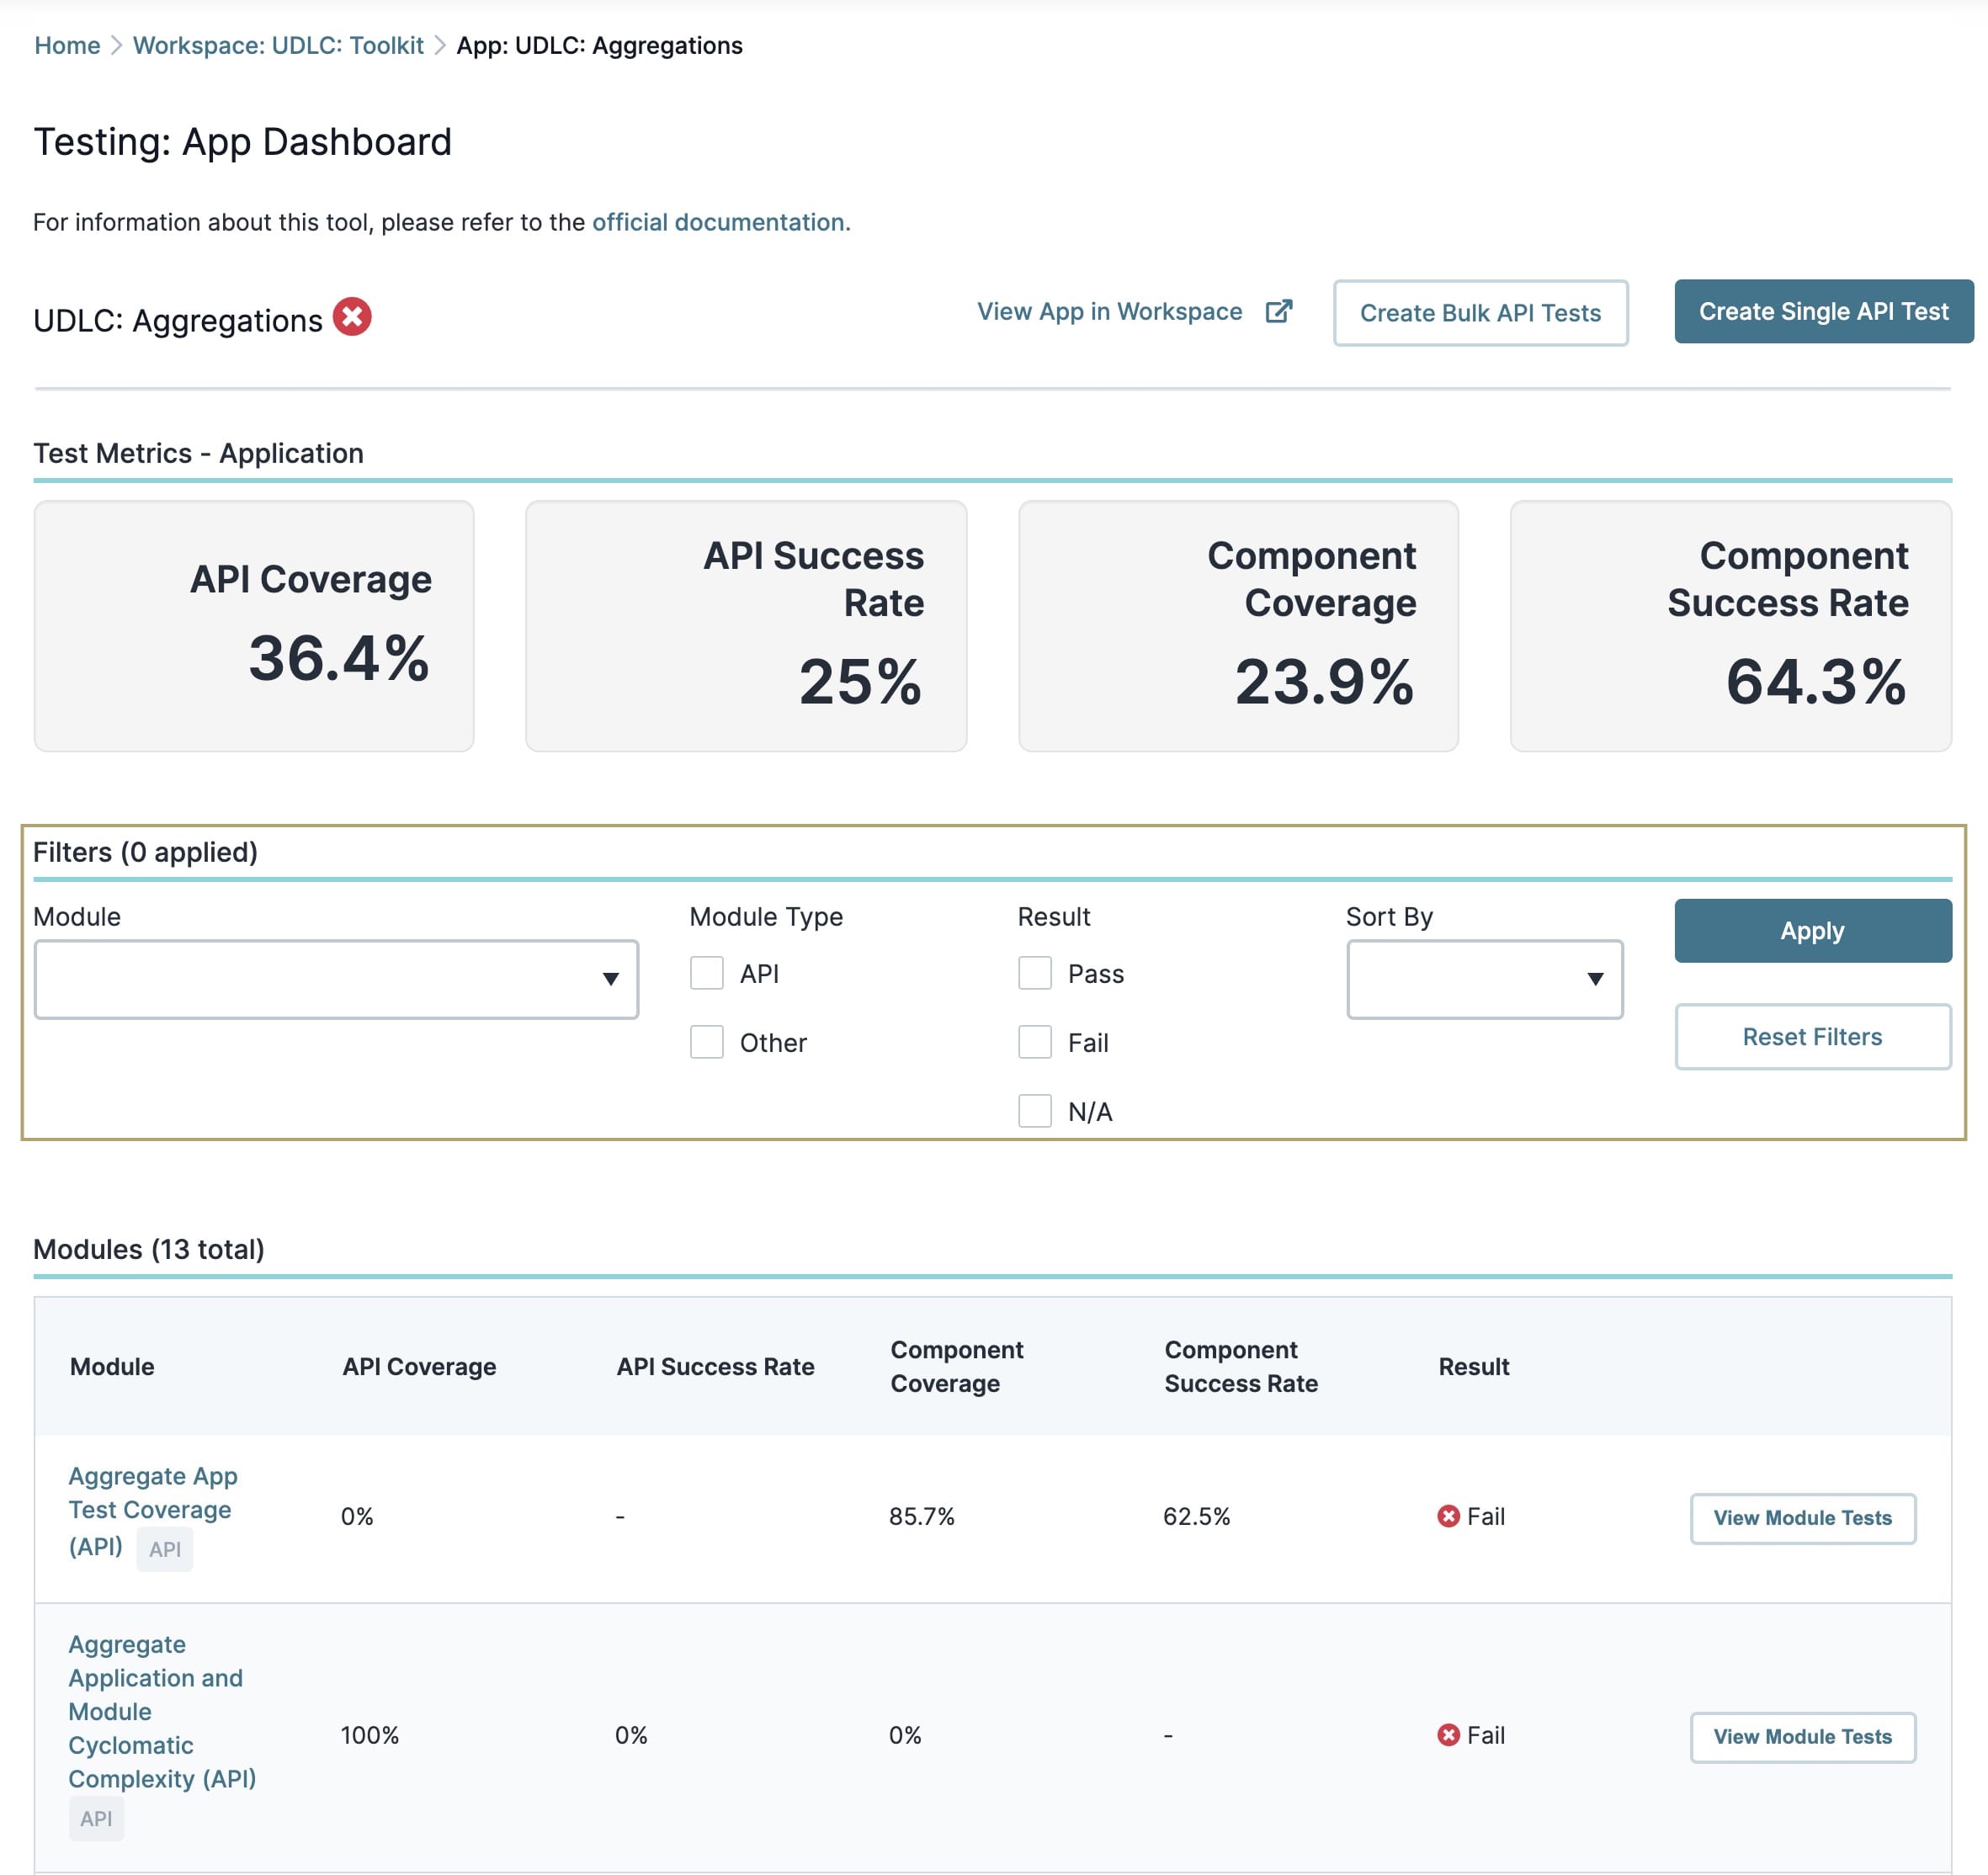
Above the Modules table, you'll find the dashboard's filters. These filters help you find specific modules in your application. You see the following filters:
Filter | Description |
|---|---|
Module | Use this drop-down to select a specific module in your application. You can select as many modules as you want. |
Module Type | This pair of filters lets you find only specific types of modules. Options include API or Other. Below are explanations of each Module Type. |
API | Select this checkbox to show only API modules in your application. |
Other | Select this checkbox to show all non-API modules in your application. |
Result | This group of filters lets you find all modules with passed, failed, or no tests. Below are explanations of each Result type. |
Pass | Select this checkbox to show all modules with a 100% API Success Rate. |
Fail | Select this checkbox to show all modules that have an API Success Rate less than 100%. |
N/A | Select this checkbox to show all modules that don't have tests. |
Sort By | This filter doesn't display specific modules. Instead, use this drop-down to sort the Modules table. Options include Module Name, Result, Success Rate, Test Coverage, and Total Tests. Below are explanations of each Sort By type. |
Module | Organizes the Modules table in ascending (A-Z) order by Module name. |
API Coverage | Organizes the Modules table by API Test Coverage. API modules with tests display at the top of the table. With API modules, API Coverage is either 100% or 0%. |
API Success Rate | Organizes the Applications table by API Success Rate. From top to bottom, the table has the following organization:
|
Component Coverage | Organizes the Applications table by Component Coverage. Applications with the highest percentage of components tested are at the top of the table. |
Component Success Rate | Organizes the Applications table by Component Success Rate. From top to bottom, the table has the following organization:
|
Result | Organizes the Modules table by Result. From top to bottom, the table has the following organization:
The results are in ascending (A-Z) order by Module name. |
Apply Button | Click this button to apply the filters. |
Reset Filters Button | Click the button to reset the filters and return the Modules table to its defaults. |
Navigating the Modules Table
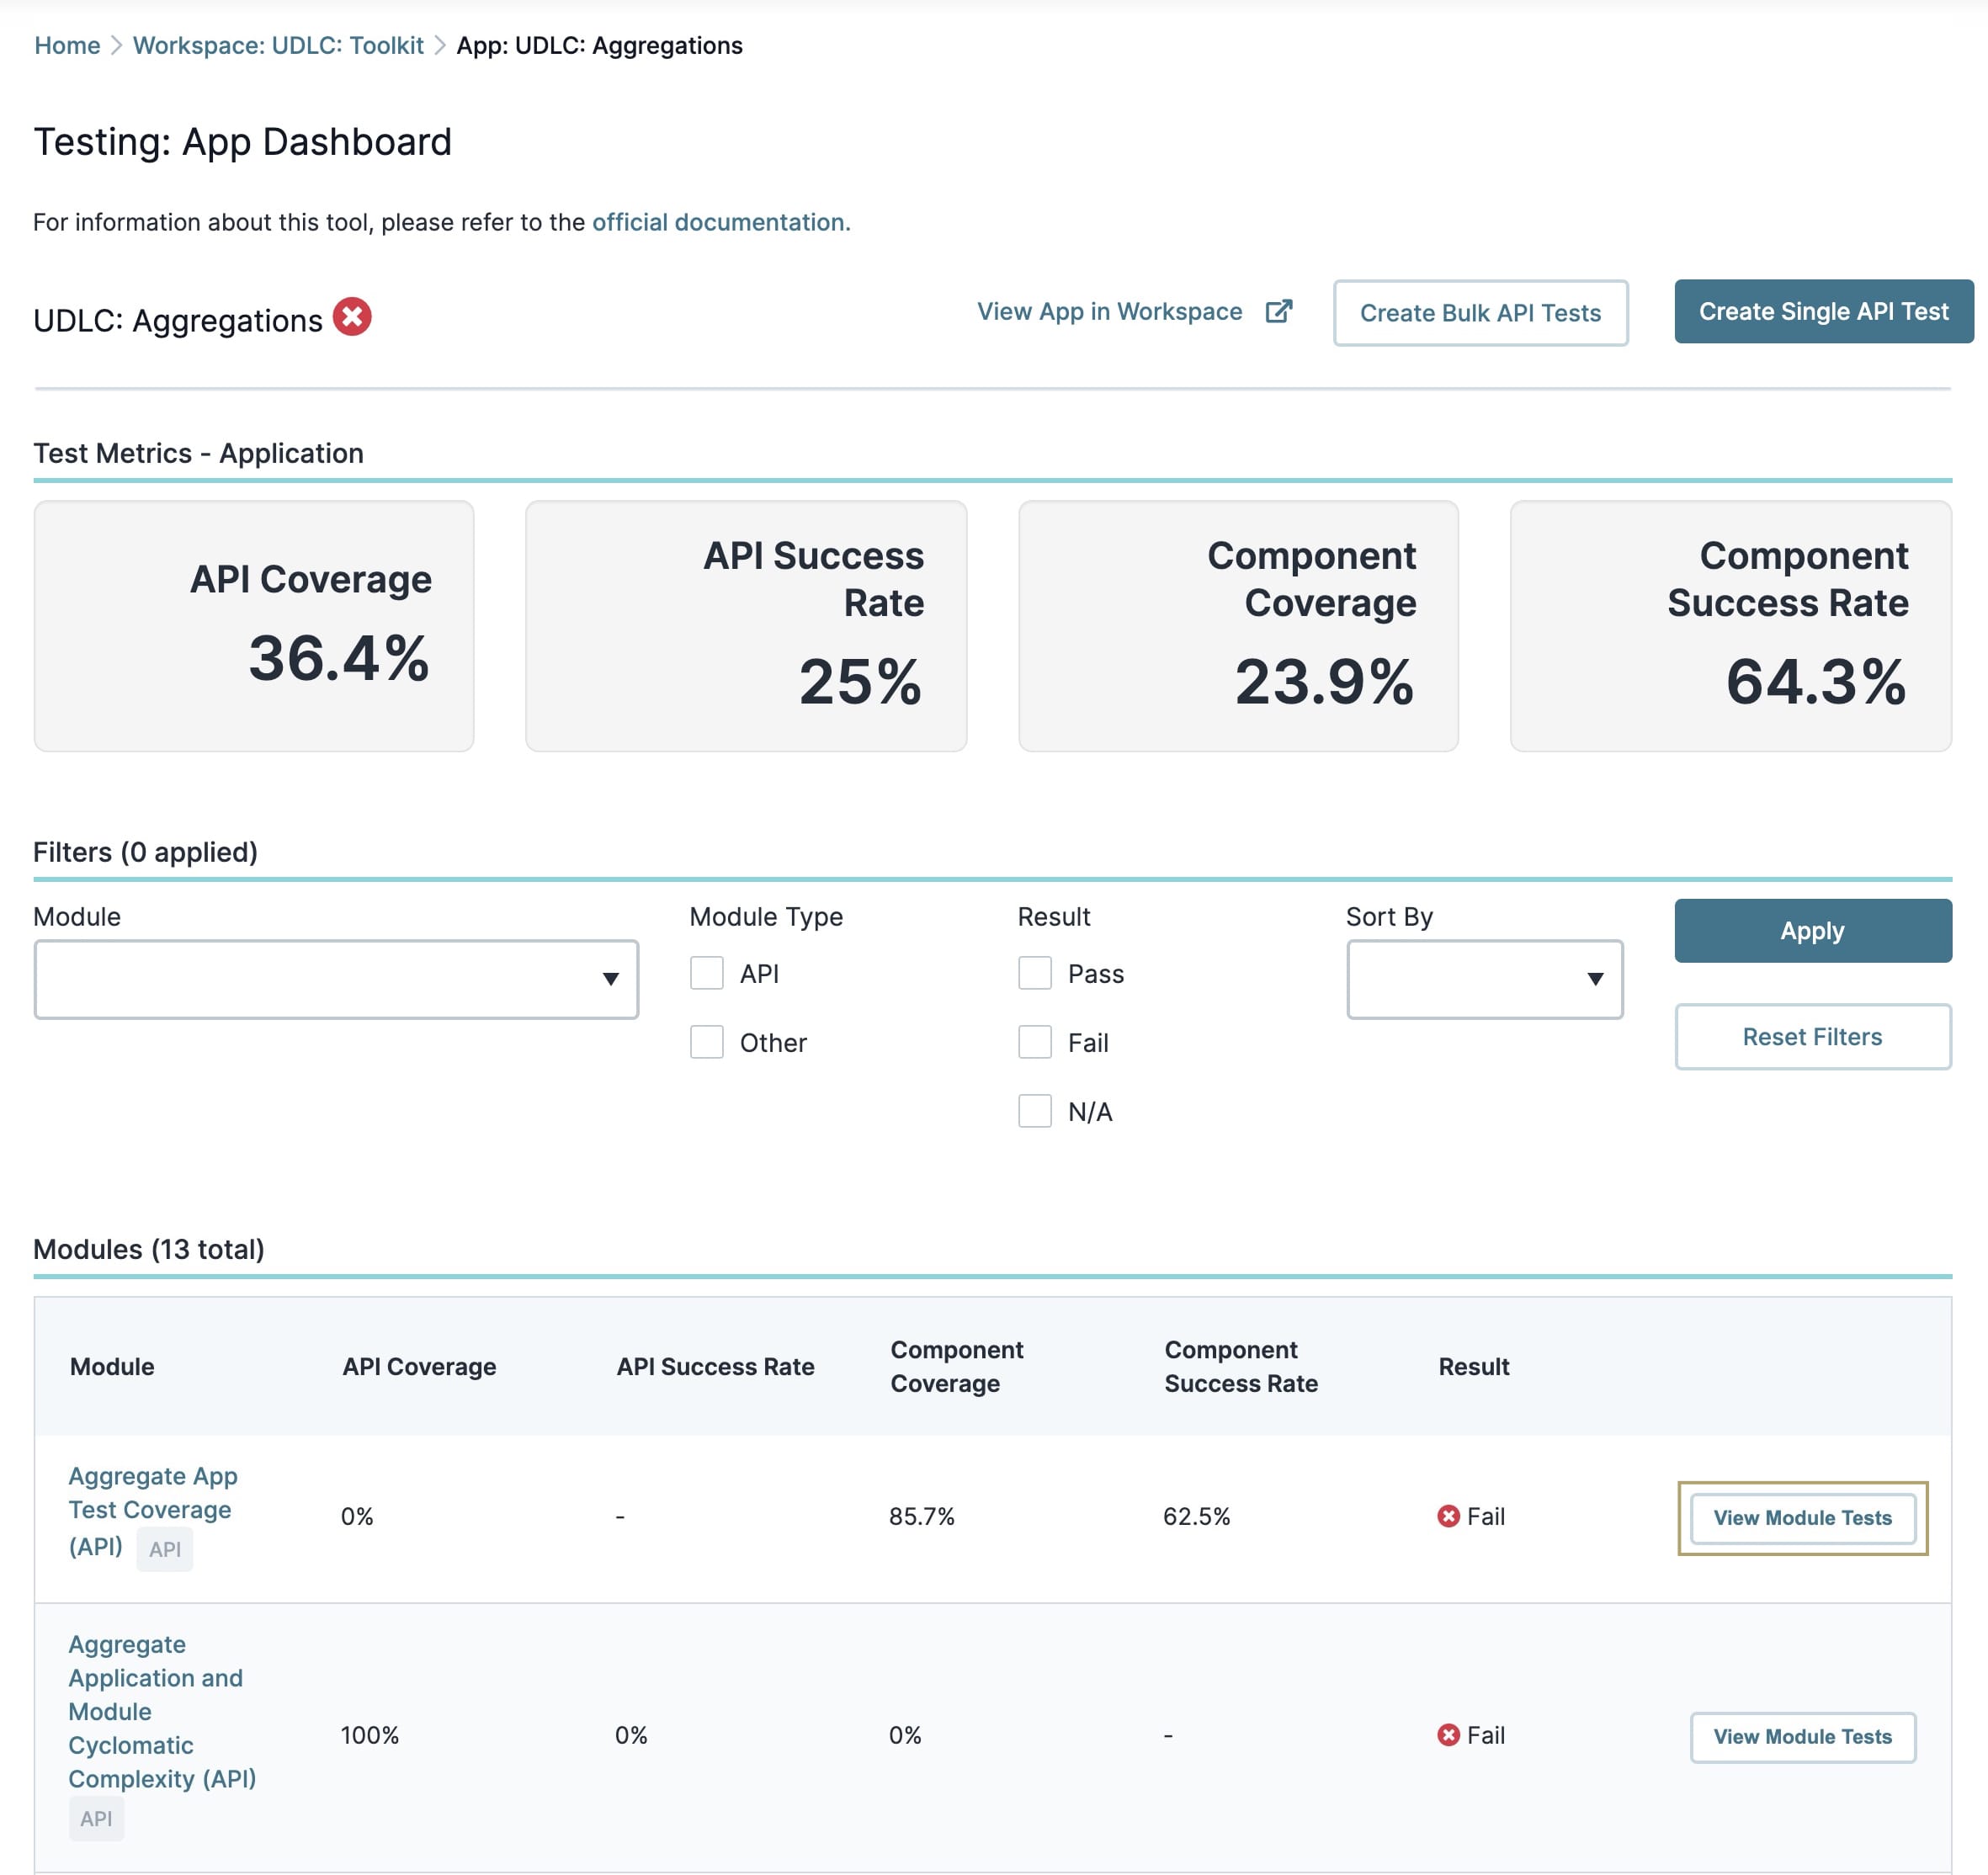
Below the test metrics, you'll see a table of all your application modules. The first column of the table gives the name of the module. It also reveals the module's configuration. If API displays by the module, then it's an API module. These modules follow Unqork's API specifications. If a module doesn't have API by its name, it's a traditional module created to perform a different action.
To learn more about API specifications and how to configure them, search API Specification Snippet in our In-Product Help.
Now, let's look at the information you'll get from the Modules table. The table includes the following attributes:
Attribute | Description |
|---|---|
Module | This is the module name. API signifies that it's an API module. |
API Coverage | The percentage of all application API modules that have tests. The calculation is the number of tested modules compared to the total number of modules. |
API Success Rate | The percentage of successful API tests. The calculation is the number of successful tests compared to the total number of tests. |
Component Coverage | The percentage of all module components that have tests. The calculation is the number of tested components compared to the total number of testable components in the module. |
Component Success Rate | The percentage of successful component tests. The calculation is the number of successful tests compared to the total number of tests. |
Result | You see a green icon if your API Success Rate is 100%. Anything below 100% displays a red icon. |
View Module Tests Button | Clicking this button opens that module's tests in the Testing Module Dashboard. |
Hover over any of the percentages to see how they were calculated.
From top to bottom, the table has the following organization:
Modules with successful tests. Remember, successful tests are those with a 100% API Success Rate.
Modules with failed tests. A failed test has a API Success Rate of less than 100%.
Modules with no tests.
By default, the table shows 10 entries. You can click the pagination buttons below the table to see more entries.
Viewing Application Modules
After you use the filters to find a module, you can view its test details. Clicking the View Module Tests button opens the Testing Module Dashboard for that specific module. The Testing Module Dashboard shows you:
The number of passed and failed tests.
The module's test coverage.
The module's test names and creation timestamp.
To learn more about the Testing Module Dashboard, search Testing Tool: Module Dashboard in our In-Product Help.