Overview
The Alerts Dashboard tool alerts you to problems in your applications and environment. It lets you create alters to monitor your applications and modules. When unexpected behaviors occur, you'll be notified of the issue.
The tool lets you track:
API (application programming interface) requests with 400 and 500 level response codes. All 400 codes are client error codes. And 500 codes are server error codes.
API requests that take longer than two seconds to complete.
Performance metrics, like available disk space and CPU and memory usage.
For troublesome API requests, you can be alerted after each request or after a specified number of requests are completed. You can also create an alert to watch performance metrics. You'll set thresholds for your metrics to alert you when a metric exceeds it. When an alert is triggered, you'll receive an email about the incident.
The Alerts Dashboard tool only supports AWS (Amazon Web Services) integration. It does not currently support Azure source logs.
Navigating the Alerts Dashboard
When you open the Alerts Dashboard, the Client and Environment fields populate automatically. On the Alerts dashboard, you'll see all your environment's alerts.
By default, only 10 alerts display at a time. You can click the pagination buttons below the Alerts table to view more. Or, to make it easier, you can use the dashboard's filters to help you find a particular alert. You can use any or all these filters, depending on how specific you want to be. As you enter text into the fields, the results display automatically. To clear all fields, click the ![]() (funnel) icon to the far right.
(funnel) icon to the far right.
The filters include:
Filter | Description |
|---|---|
Status | This is the current status of the alert. The different statuses include:
|
Priority | The alert's level of risk. The highest priority is P1 and the lowest is P5. |
Last Triggered | A timestamp for the most recent time a metric or API request exceeded the threshold. The timestamp uses the 24-hour clock and your current timezone. |
Type | The alert type. It can be either of the following:
|
Name | The alert's name. |
View | Click this button to review the alert and edit or delete it. |
Creating an Alert
To create a alert, click + Create New Alert at the top right of the page. A pop-up modal displays to add alert details. The two types of alerts you can create are Metrics and Logs. The following descriptions will help you determine which alert to create:
Metric: Metric alerts let you monitor everything from disk space and memory usage to network throughput. Each metric requires a specific Alert Threshold based on the measurement in time. For example, the App - CPU metric is measured in percent per second.
Log: Log alerts let you monitor slow API requests and ones that result in 400 and 500 level response status codes.
The fields and drop-downs in the Creator New Alert modal include:
Define the Alert
Setting | Description |
|---|---|
Type | The alert type. Your options include Metric and Log.
|
| Use this option to set up a threshold to monitor application and database performance. |
Metric* | Use this drop-down to select one of the following options:
|
| Use this option to set up a log to monitor slow or error-prone API requests. |
Log Type* |
|
Slow Log Threshold | Define the number of seconds an error-prone API call runs before you receive an alert. By default, this setting is set to two seconds.
|
URL Path | Enter an API endpoint, like GetSubmissions, or a module ID. Every call that includes that part of the URL populates in the Logs Dashboard tool.
|
Set Alert Conditions
Setting | Description |
|---|---|
Threshold Timing* | The duration the alert watches for a metric or log to exceed the Alert Threshold. From this drop-down, you can select:
For metric-type alters, you can set alerts for a 30-day range. For log-type alerts, you can set alerts for a two-day range.
|
Alert Threshold* | The threshold that triggers an alert when a metric or log exceeds it. If it exceeds this threshold, an email is sent to a defined recipient. The unit of measurement for the Alert Threshold is dependent on the Metric or Log Type you selected. |
Say What's Happening
Setting | Description |
|---|---|
Name* | Enter a name that clearly describes your alert. |
Priority* | Use this drop-down to define the alert's risk level. The highest priority is P1 and the lowest is P5. |
Recipient(s)* | When a metric or log exceeds the Alert Threshold, this recipient(s) receives an email alert. You can add as many recipients as you wish. |
Add Recipient | Click this button to add a recipient's email address. When a log or metric exceeds the Alert Threshold, this recipient(s) receives an email. |
Cancel | This button clears changes and closes the pop-up modal. |
Create Alert | This button adds the alert you created to your environment. |
Viewing an Alert's Details
Now that you know how to create an alert, let's view its details. When you access the Alerts Dashboard, you see all your environment's alerts. To the right of each alert is a View button. Click this button to see the details of your alert.
The details you see depend on the alert. We'll look at each individually.
Viewing a Metric Alert's Details
There are various performance metrics to monitor. You can watch CPU usage, disk space, or even the network traffic of your applications. To see more details about performance metrics, use Unqork's Metrics Dashboard tool.
To learn more about performance metrics, view our Metrics Dashboard Tool article.
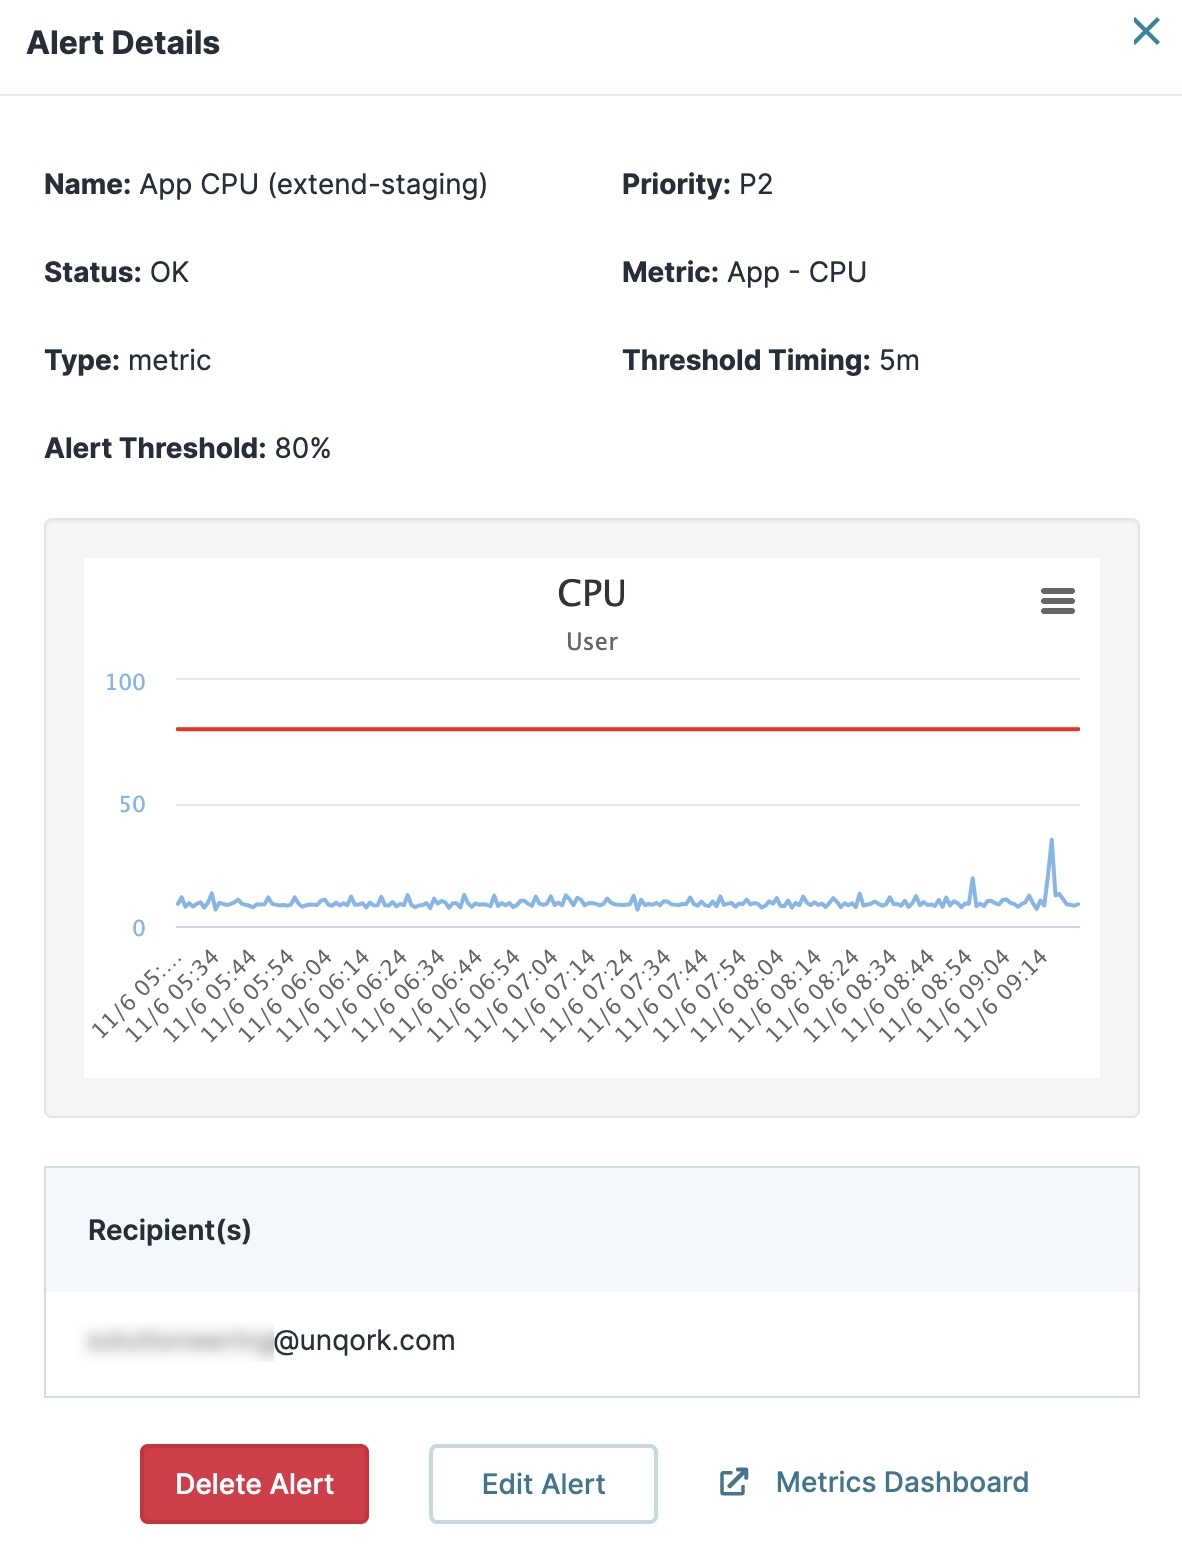
Locate and click View on a metric-type alert to see various details. The image to the right is an example of an App - CPU alert.
Attribute | Description |
|---|---|
X (Close) | Click the X at the top right to close the Alert Details modal. |
Name | The alert's name. |
Priority | The alert's risk level. The highest priority is P1 and the lowest is P5. |
Status | This is the current status of the alert. The different statuses include:
|
Metric | This is the specific application or database performance metric being monitored. You'll see one of the following metrics:
|
Type | The alert type. You'll only see metric for all metric alerts. |
Threshold Timing | The duration the alert watches for a metric to exceed the threshold. Thresholds can be measured in seconds, minutes, or days. |
Alert Threshold | When a metric exceeds this threshold, the status changes to Alert and the monitor sends an email to the recipient. |
Preview Window | Lets you view the metric performance of the last four hours. The Alert Threshold displays as a red, horizontal line. |
Recipient(s) | When a metric exceeds the Alert Threshold, this recipient(s) receive an email. |
Delete Alert | Click this button to delete the alert. |
Edit Alert | Click this button to edit the alert. |
| Click this link to open the Metrics Dashboard tool in your environment. |
Viewing a Log Alert's Details
You'll use Log Alerts to watch troublesome API requests in your environment, like slow requests or ones with 400 and 500 level response codes. To view the full details of a specific API request, use Unqork's Logs Dashboard tool.
To learn more about viewing slow and error-prone API requests, view our Logs Dashboard Tool article.
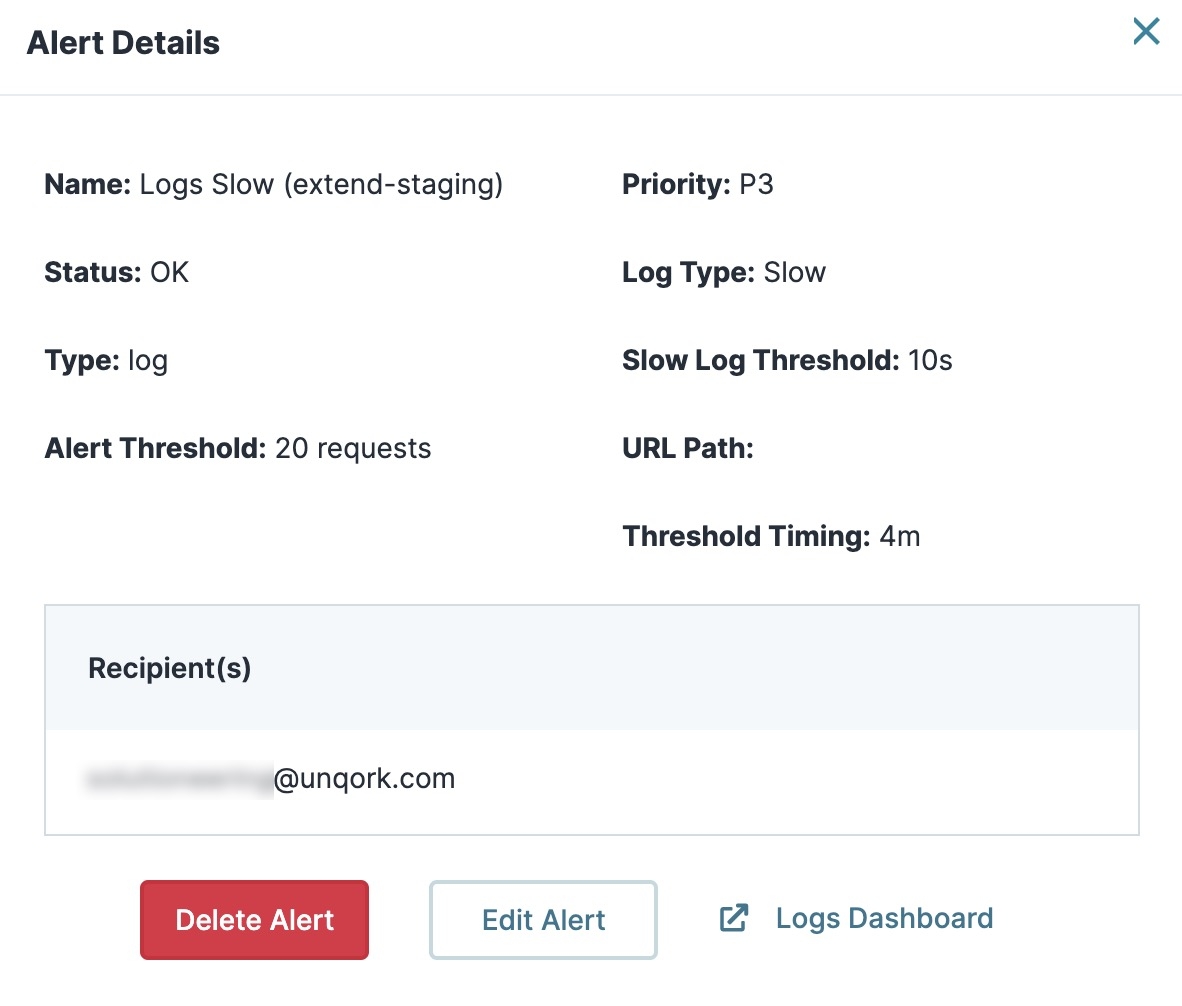
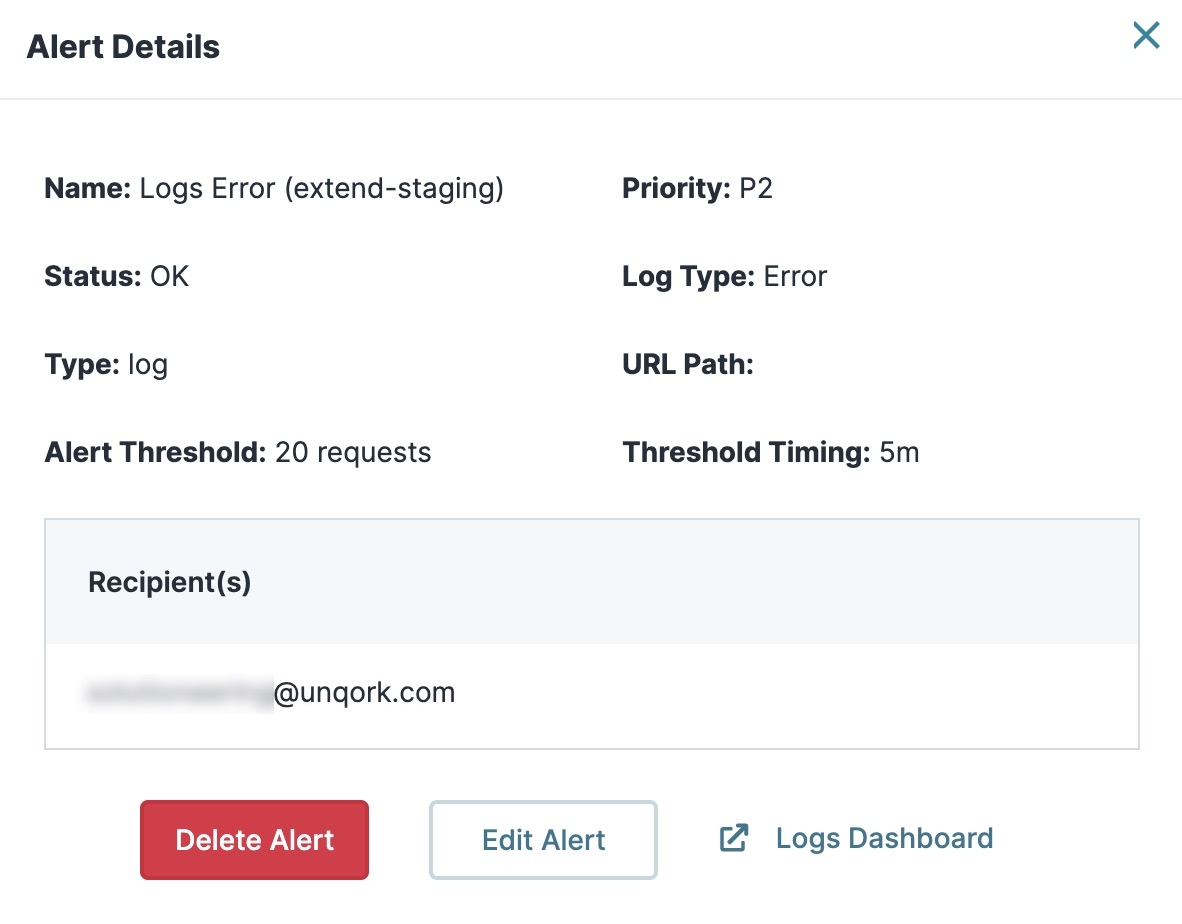
Locate and click View on a log-type alert to see various details. The images below are example of slow and error log alerts.
Attribute | Description |
|---|---|
X (Close) | Click the X at the top right to close the Alert Details modal. |
Name | The alert's name. |
Priority | The alert's risk level. The highest priority is P1 and the lowest is P5. |
Status | This is the current status of the alert. The different statuses include:
|
Log Type | The type of log being monitored. You'll see the following types:
|
Type | The alert type. You'll only see log for all log alerts. |
Slow Log Threshold | The number of seconds an error-prone API call runs before you receive an alert.
|
URL Path | The alert monitors all API requests whose URL includes this path. |
Alert Threshold | A set number of completed API requests before the status changes to Alert. |
Threshold Timing | The duration the alert watches for a metric to exceed the threshold. Thresholds can be measured in seconds, minutes, or days. |
Recipient(s) | When a metric exceeds the Alert Threshold, this recipient(s) receive an email. |
Delete Alert | Click this button to delete the alert. |
Edit Alert | Click this button to edit the alert. |
| Click this link to open the Logs Dashboard tool in your environment. |
Exporting and Sharing Performance Metrics
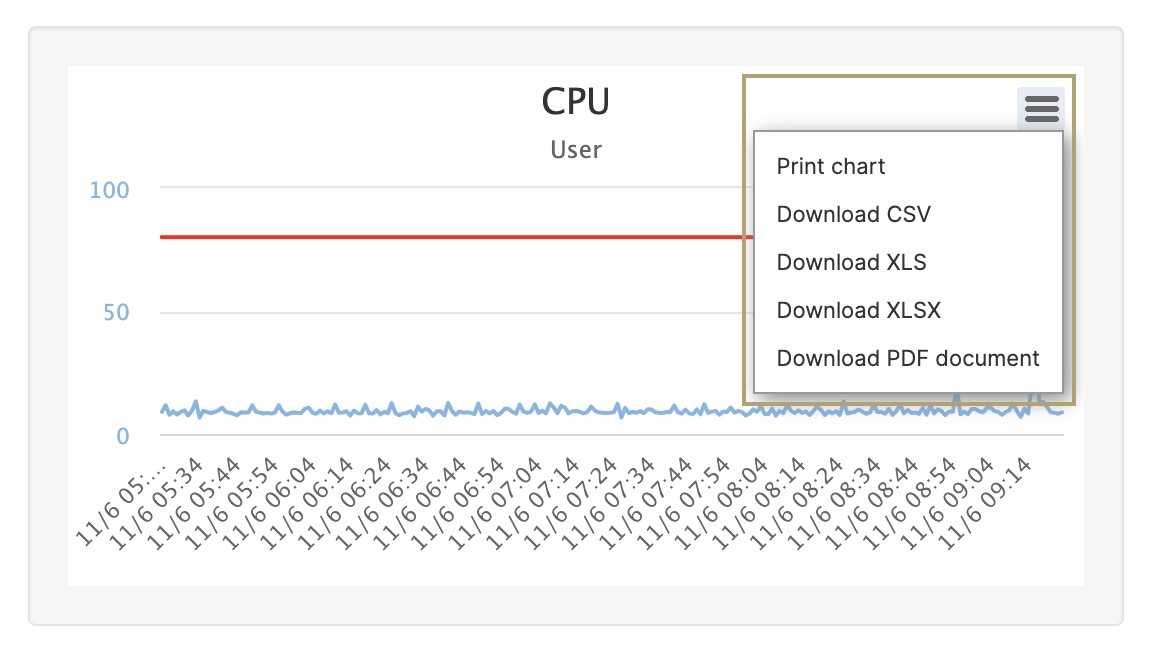
You can also export or print your performance metrics. Click View on a metric-type alert. In the preview window, a hamburger button ( ) displays at the top right of the chart widget.
When you click this button, you can select from the following options:
Option | Description |
|---|---|
Print Chart | Lets you print the chart or save it as a PDF. Use your computer's print settings to modify the chart as you wish. |
Download CSV | Lets you download the chart as a .csv file. |
Download XLS | Lets you download the chart as an .xls file. |
Download XLSX | Lets you download the chart as an .xlsx file. |
Download PDF Document | Lets you download the chart as a .pdf file. |


