The UDLC Testing Workspace Dashboard provides a centralized view of all automated tests in your workspace. Use this dashboard to monitor high-level testing health and identify applications that require attention.
From this dashboard, you can track:
Workspace Test Metrics: Overall performance data for your testing environment.
Application Totals: The total number of applications with configured tests.
Execution Trends: Success and failure rates across all test runs.
To learn more about creating API tests with the Testing tool, view our Creating API Tests article.
Selecting a Workspace
Use the Workspace drop-down to select a workspace in your environment. Once you select a workspace, the dashboard populates with the following:
API module test coverage and success rates.
Component test coverage and success rates.
Filters and sorting functions to view specific data.
You can see an example of selecting a workspace in the following image:
.gif)
Navigating the Workspace Dashboard
Learn more about the Testing Tool’s Workspace Dashboard by clicking on the tabs below:
Viewing Workspace Test Metrics
After selecting a workspace, all its test metrics and applications display on the dashboard. As you add, edit, or remove tests in this workspace, the results in this section change in real-time.
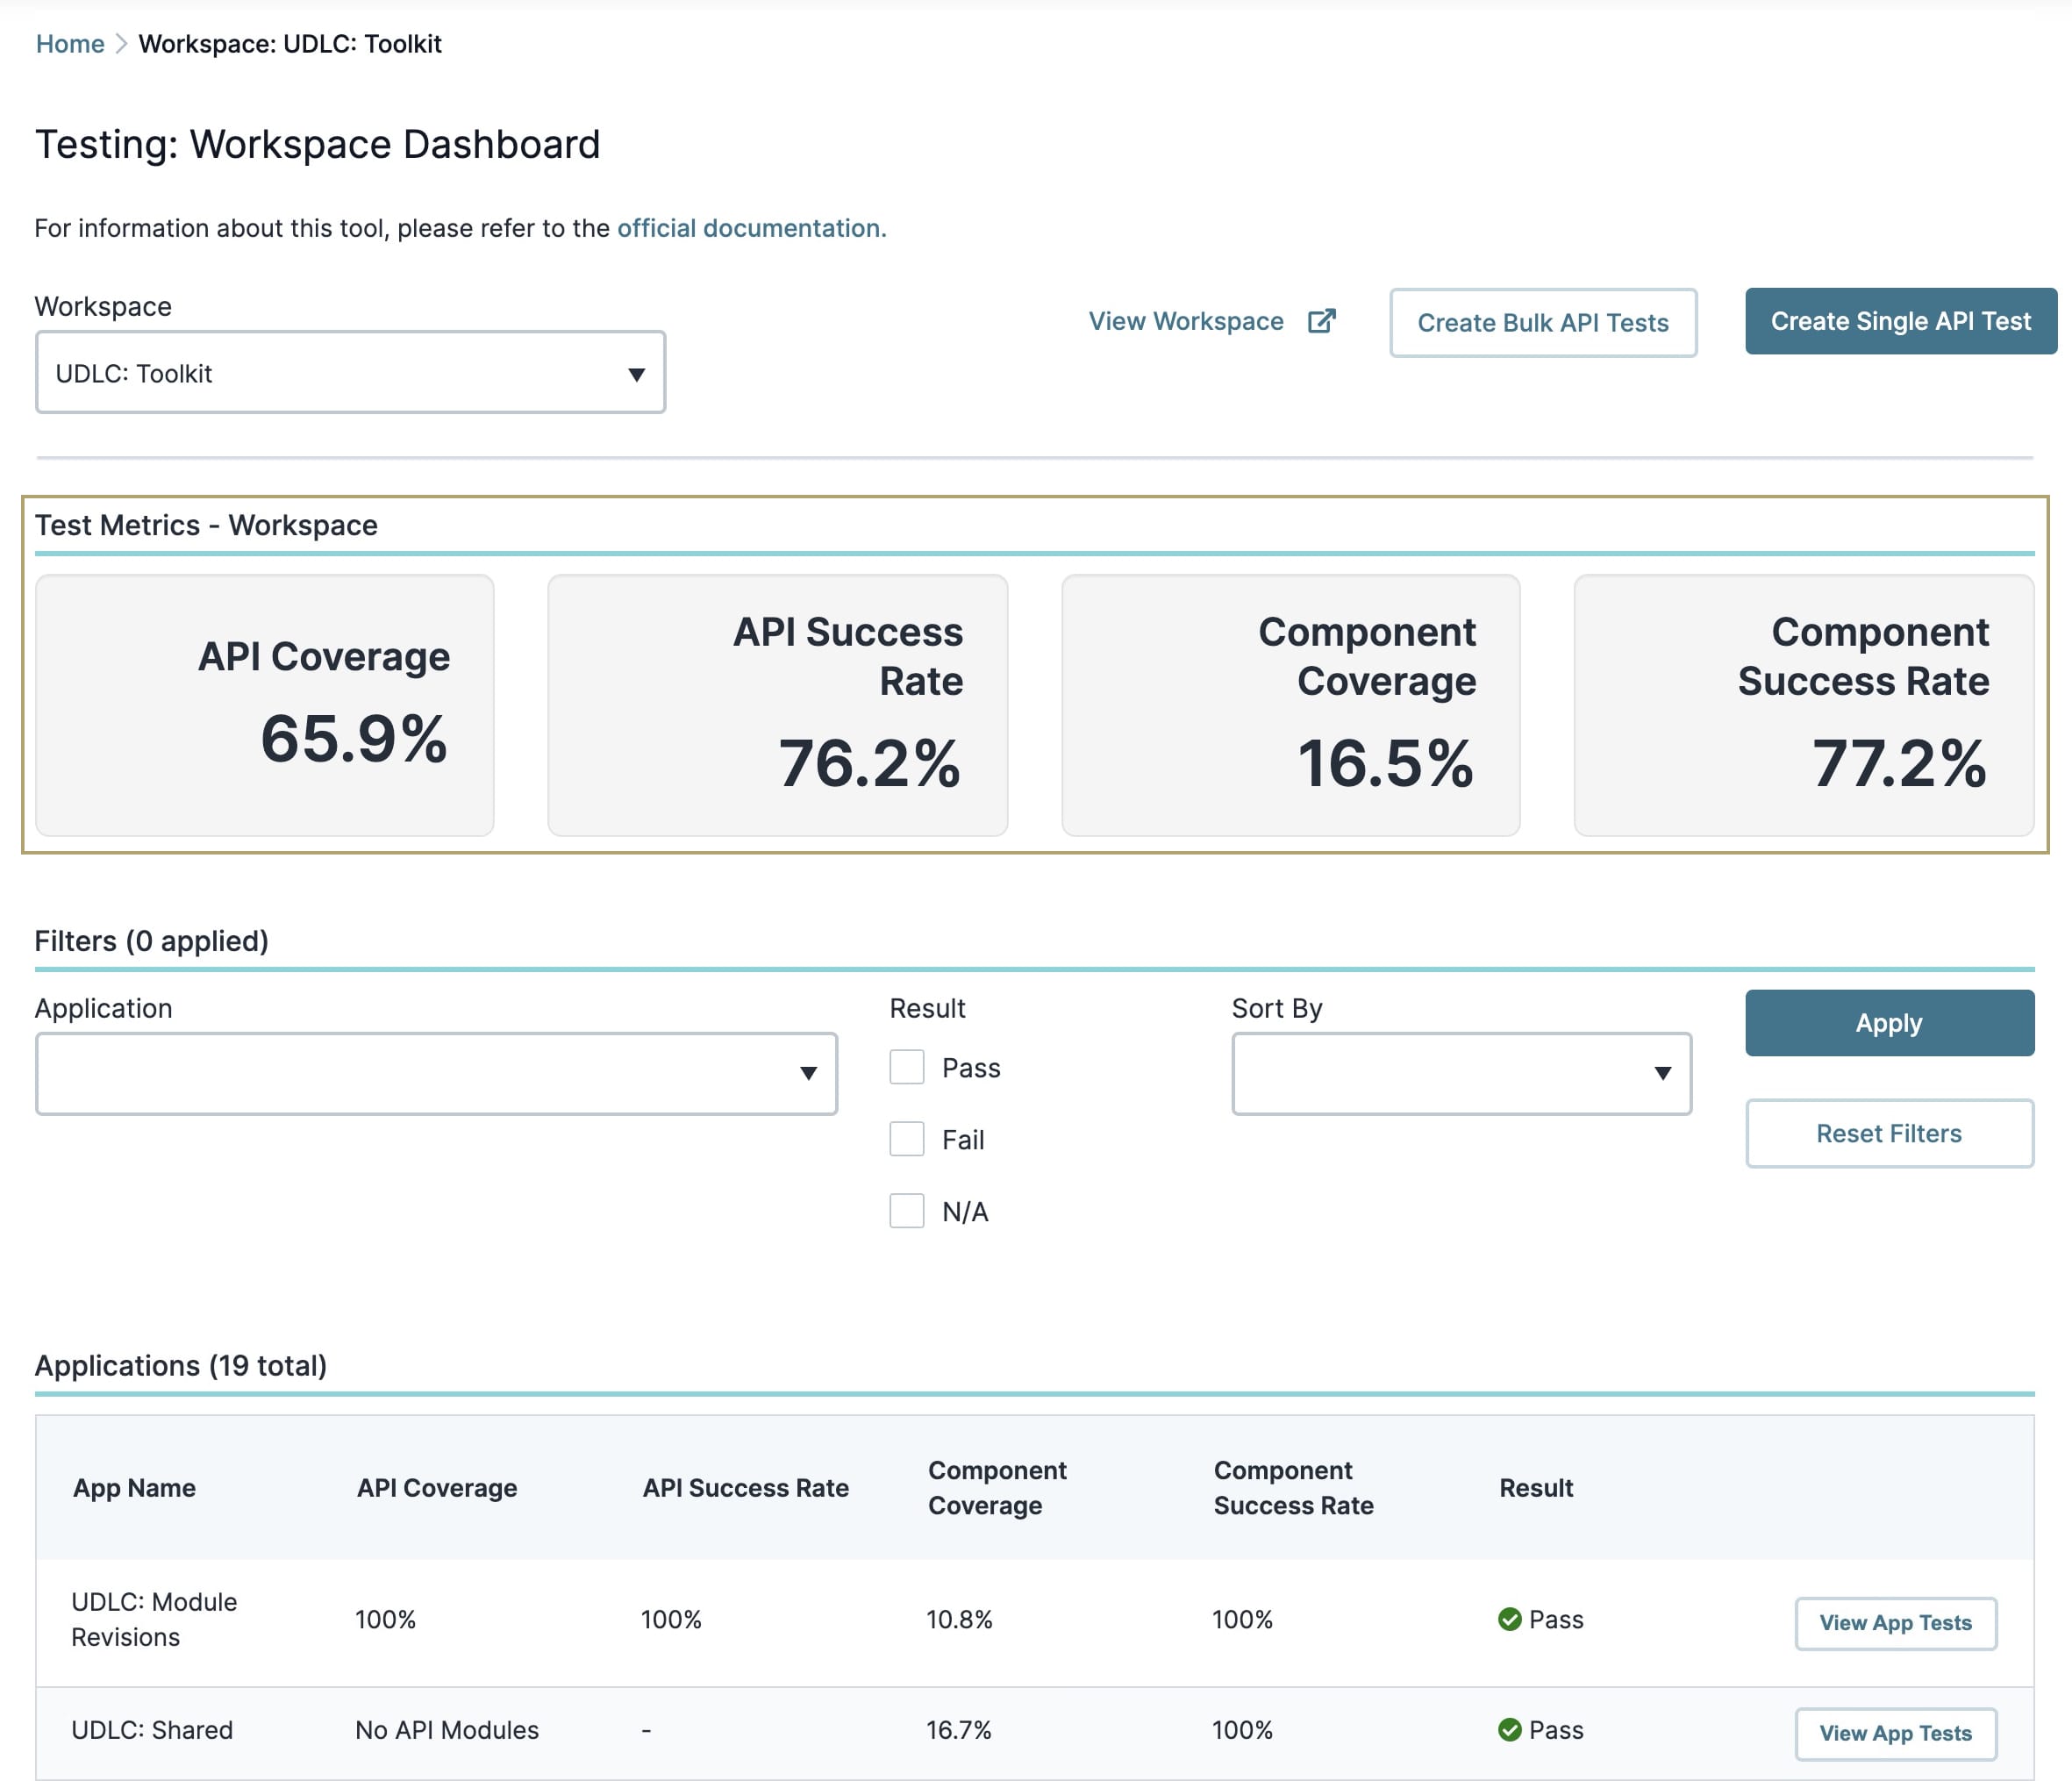
Below is a description of the different metrics in this section:
Test Metric | Description |
|---|---|
API Coverage | The percentage of all API modules that have tests in this workspace. |
API Success Rate | The percentage of successful API tests in this workspace. |
Component Coverage | The percentage of all module components that have tests in this workspace. |
Component Success Rate | The percentage of successful component tests in this workspace. |
Using the Workspace Dashboard's Filters
The Workspace Dashboard lists all applications in your workspace. To narrow the view, use the available filters to:
Identify applications missing test configurations.
Sort applications by test success rate.
Filter by application test coverage percentages.
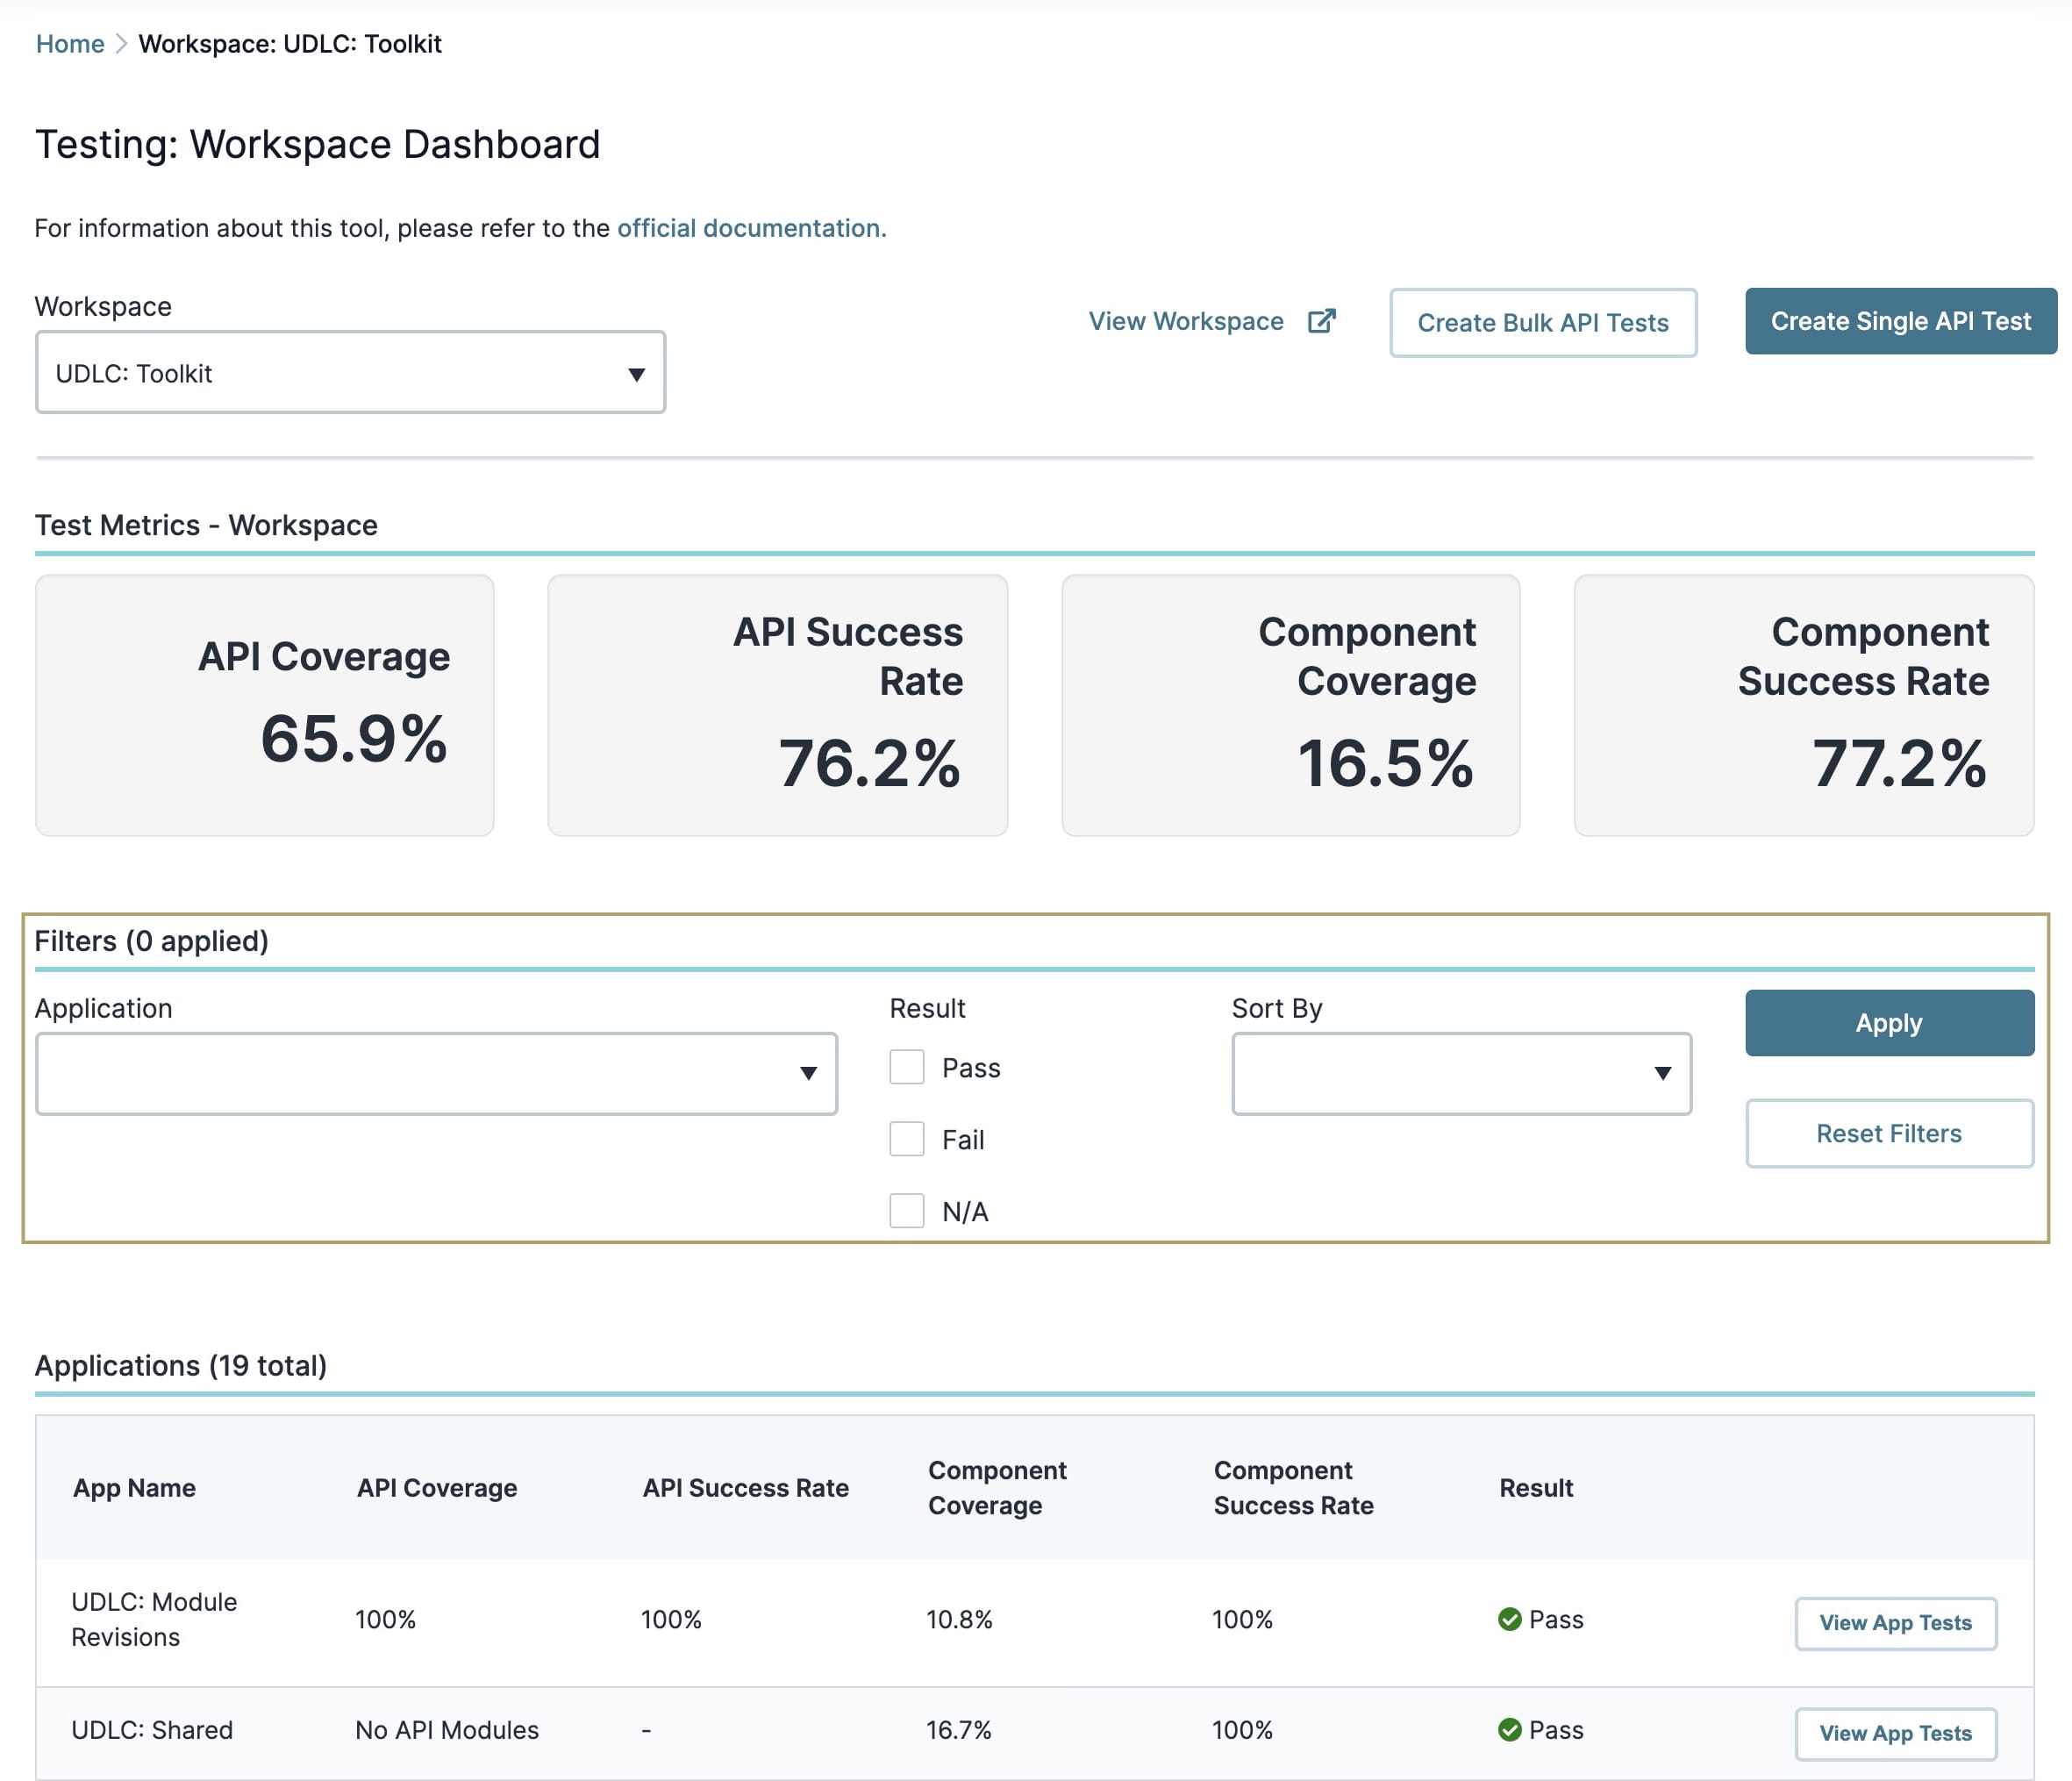
The following settings are available in the Filters settings:
Setting | Description |
|---|---|
Application | Use this drop-down to select a specific application in your workspace. You can select as many applications as you want. |
Result | This group of filters lets you find all applications with passed, failed, or no tests. |
Pass | Select this checkbox to show all applications with a 100% API Success Rate. |
Fail | Select this checkbox to display all applications with an API Success Rate less than 100%. |
N/A | Select this checkbox to show all applications that do not have tests. |
Sort By | Use this drop-down to sort the Applications table. You can sort by App Name, API Coverage, API Success Rate, Component Coverage, Component Success Rate, and Result. Below are explanations of each option. |
App Name | Organizes the Applications table alphabetically. By default, the results are in ascending (A-Z) order. |
API Coverage | Organizes the Applications table by API Test Coverage. Applications with the highest percentage of API modules tested are at the top of the table. |
API Success Rate | This option organizes the Applications table by API Success Rate. From top to bottom, the table has the following organization:
|
Component Coverage | Organizes the Applications table by Component Coverage. Applications with the highest percentage of components tested are at the top of the table. |
Component Success Rate | Organizes the Applications table by Component Success Rate. From top to bottom, the table has the following organization:
|
Result | Organizes the Applications table by App Status. From top to bottom, the table has the following organization:
By default, the results are in ascending (A-Z) order. |
Apply | Click this button to apply the filters. |
Reset Filters | Click this button to reset the filters and return the Applications table to its default view. |
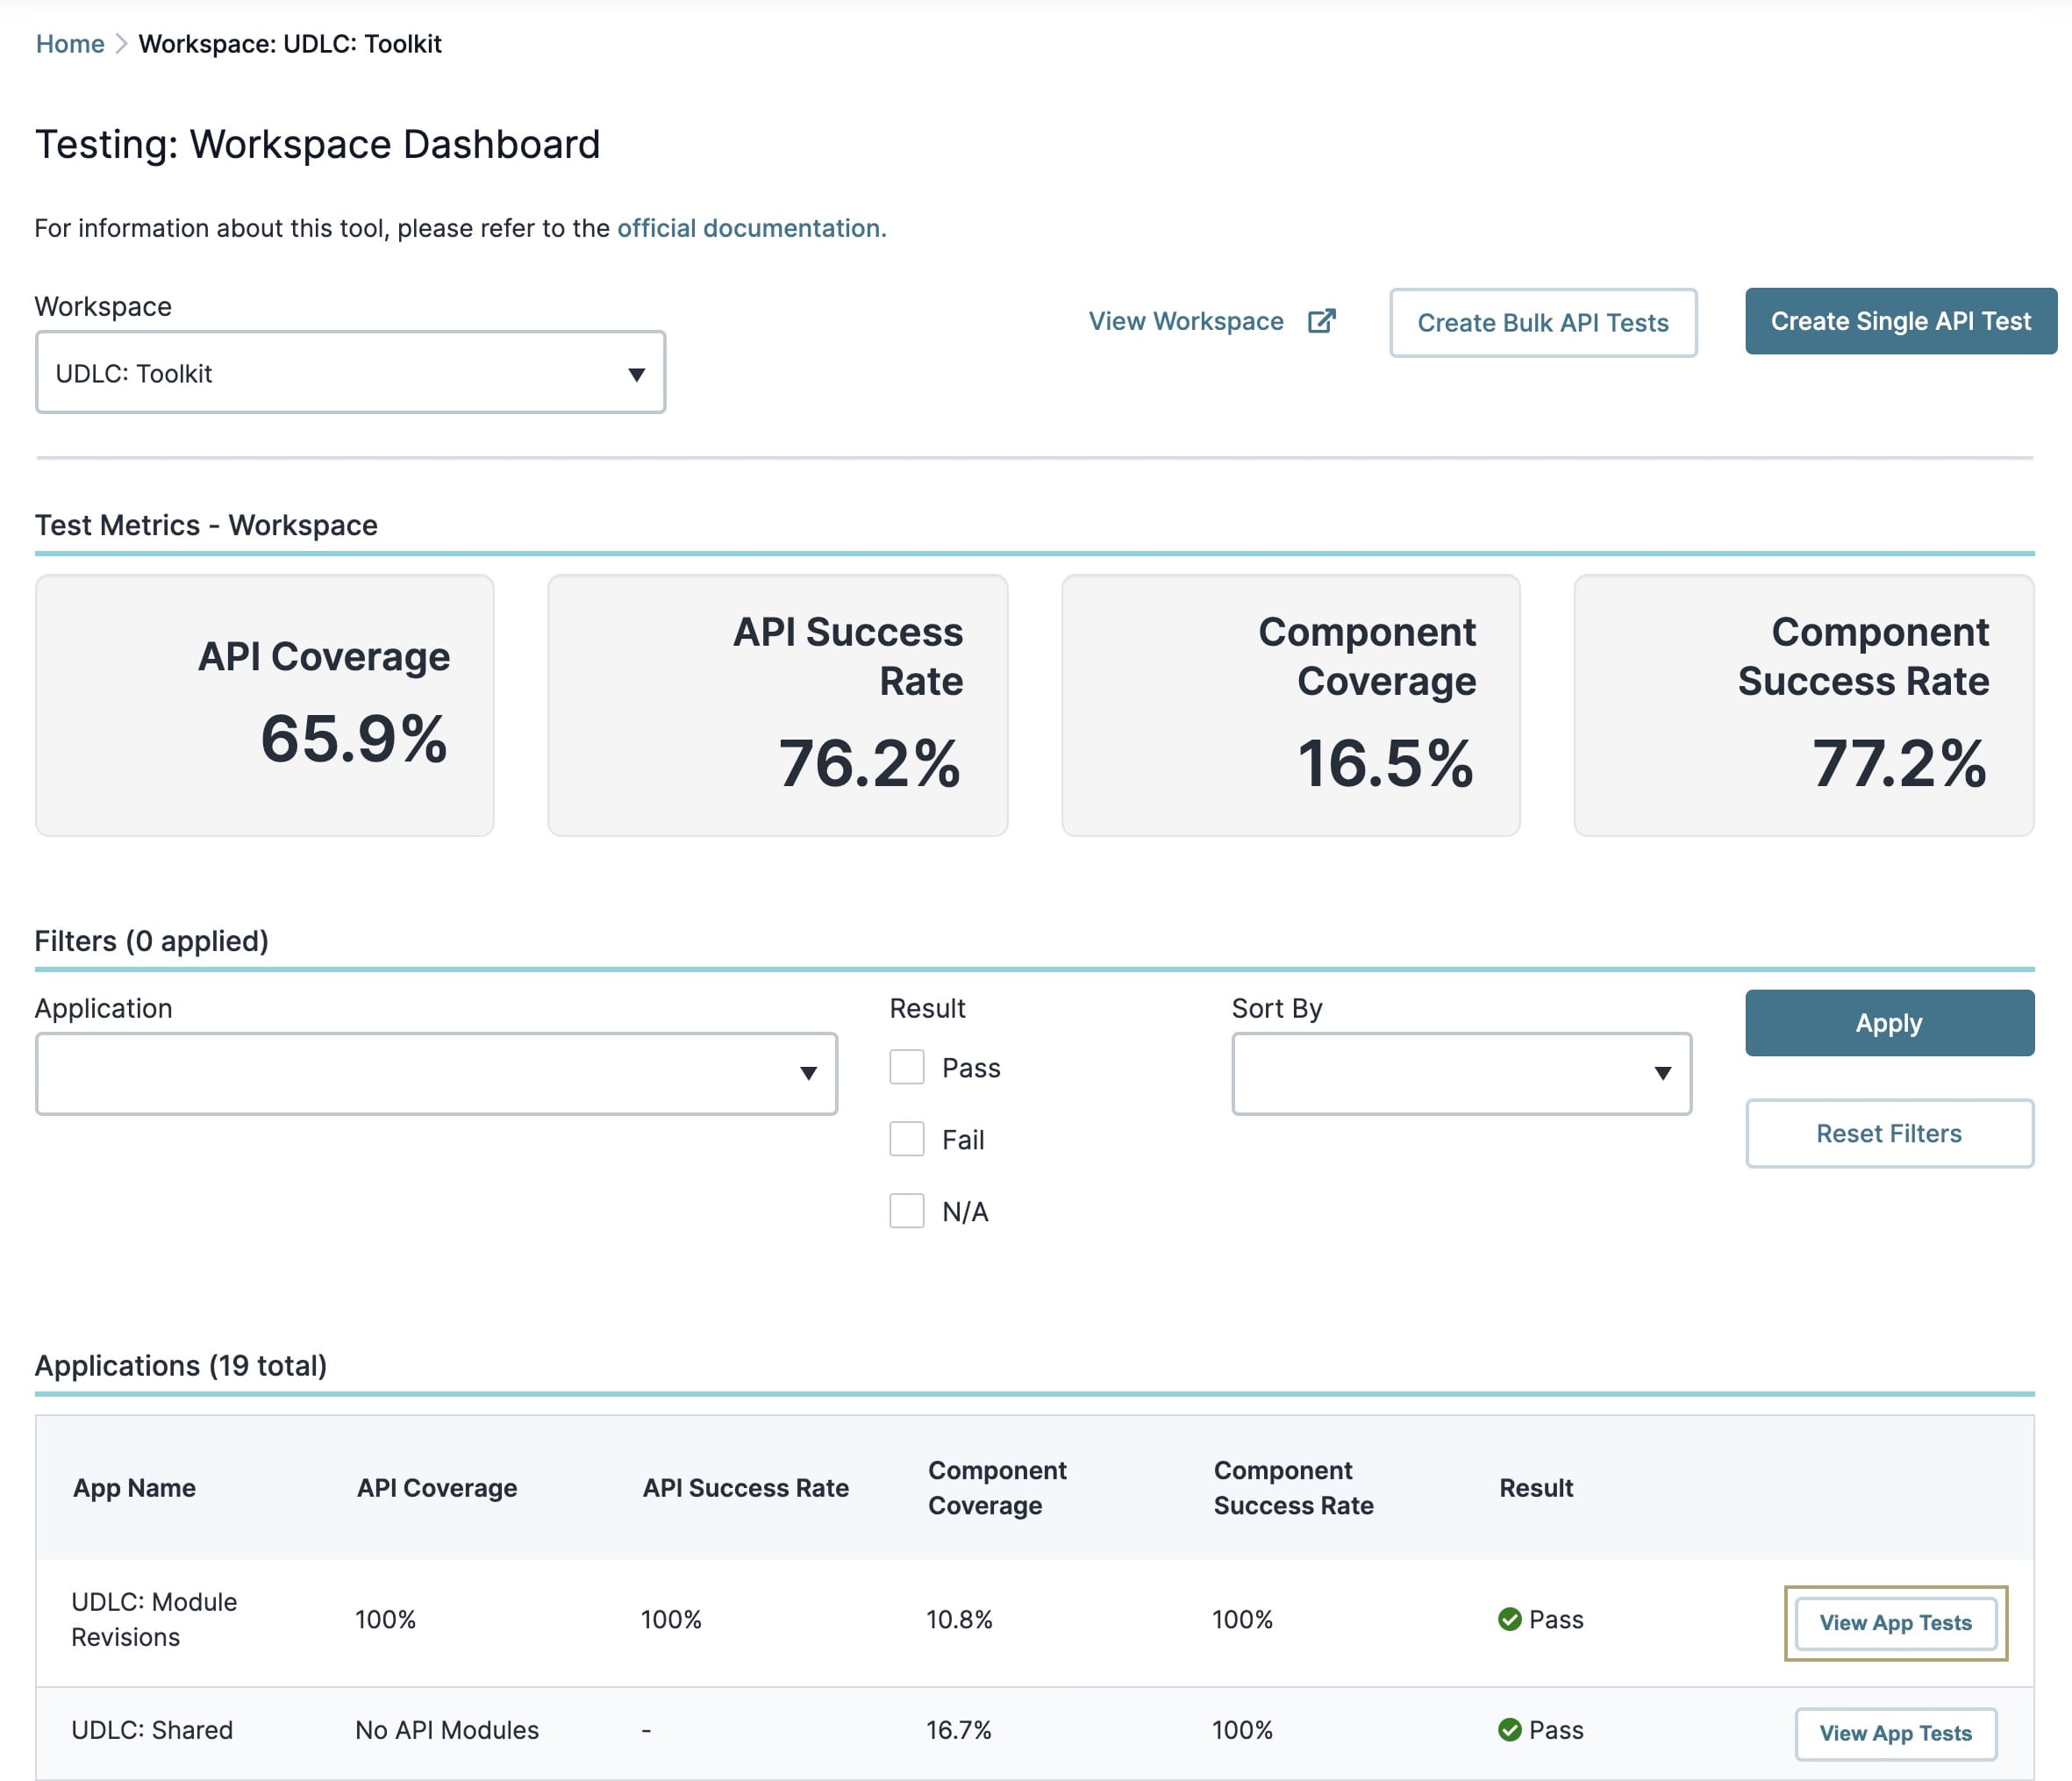
Navigating the Applications Table
Below the test metrics, you'll see a table of all your workspace applications. The table is organized into the following attributes:
Attribute | Description |
|---|---|
App Name | The application name. |
API Coverage | The percentage of all application API modules that have tests. The calculation is the number of tested modules compared to the total number of modules. |
API Success Rate | The percentage of successful API tests. The calculation is the number of successful tests compared to the total number of tests. |
Component Coverage | The percentage of all module components that have tests. The calculation is the number of tested components compared to the total number of testable components in the module. |
Component Success Rate | The percentage of successful component tests. The calculation is the number of successful tests compared to the total number of tests. |
Result | You see a green icon if your API Success Rate is 100%. Anything below 100% shows as a red icon. |
View App Tests Button | Clicking this button opens that application in the Testing App Dashboard. |
Hover over any of the percentages to see how they were calculated.
From top to bottom, the table has the following organization:
Applications with successful tests. Successful tests are only those with a 100% Success Rate.
Applications with failed tests. A failed test has a Success Rate less than 100%.
Applications with no tests.
By default, the table shows ten entries. You can click the pagination buttons below the table to see more entries.
Viewing Your Workspace Applications
After you use the filters to find an application, you can view its test details. Clicking the View App Tests button opens the Testing App Dashboard for that specific application. The Testing App Dashboard shows you:
The number of passed and failed tests.
The application's test coverage.
The application module’s test success rates.
To learn more about the Testing App Dashboard, view our Testing Tool: App Dashboard article.