Overview
The Module Revisions Dashboard is a tool that helps keep track of all your module changes. You'll find many similarities between the module Save History and Module Revisions Dashboard. Both show revision history, which includes new or deleted components.
The Module Revisions Dashboard goes a step further. One of its most powerful features is the ability to compare any 2 modules side-by-side. You can also see all previous component edit and setting changes, star priorities, and create notes.
The module Save History is great if you want a big-picture view of a single module's history. The Module Revisions Dashboard tool is the way to go for detailed analysis.
Module Revisions Dashboard Tool Access
This tool requires Creators to have specific role access in Environment Role RBAC (Role-Based Access Control) or WSRBAC (Workspaces Role-Based Access Control).
If using Environment Roles (not using WSRBAC):
Creator roles can view all data in this tool.
If using WSRBAC:
Creators can view data related to modules and workflows inside Workspaces where they have access.
If a user cannot access specific data, it likely means they do not have access to the Workspace containing the module.
Navigating and Filtering the Module Revisions Dashboard
You'll use the Module Revisions Dashboard table to see all your environment's modules in one place. By default, the table shows 10 entries. You can click the pagination buttons below the table to show more entries.
This is what the dashboard looks like:
All modules created in the environment appear in the Revisions grid after filtering. The dashboard has 4 filters to help you find your module. The module ID is the only one that's required. But, you can use any or all other filters, depending on how specific you want to be.
Once you've set your filters, click Apply Filters to see all matching results. To clear all fields, click Reset Filters to the far right. Let's take a look at the filters:
Filter | Description |
|---|---|
Module ID | The first half of the string is the title you gave your module. The second half is your unique module number generated by Unqork. This field is required. Your module ID will look like this in the drop-down menu: Title - 123456789a123456789e |
Date From | Excludes all revisions with revision dates before the selected date. |
Date To | Excludes all revisions with revision dates after the selected date. |
Save Type | You can select from one of these types:
|
Clicking + Add module lets you compare two modules side-by-side. The same filters apply to both modules.
Managing your Module Revisions
After finding your module and filtering, you'll use the Details option to add helpful information about your revision. To see a specific record in the Revisions table, click Details at the right side of any module revision record.
Here's an example of what you might see:
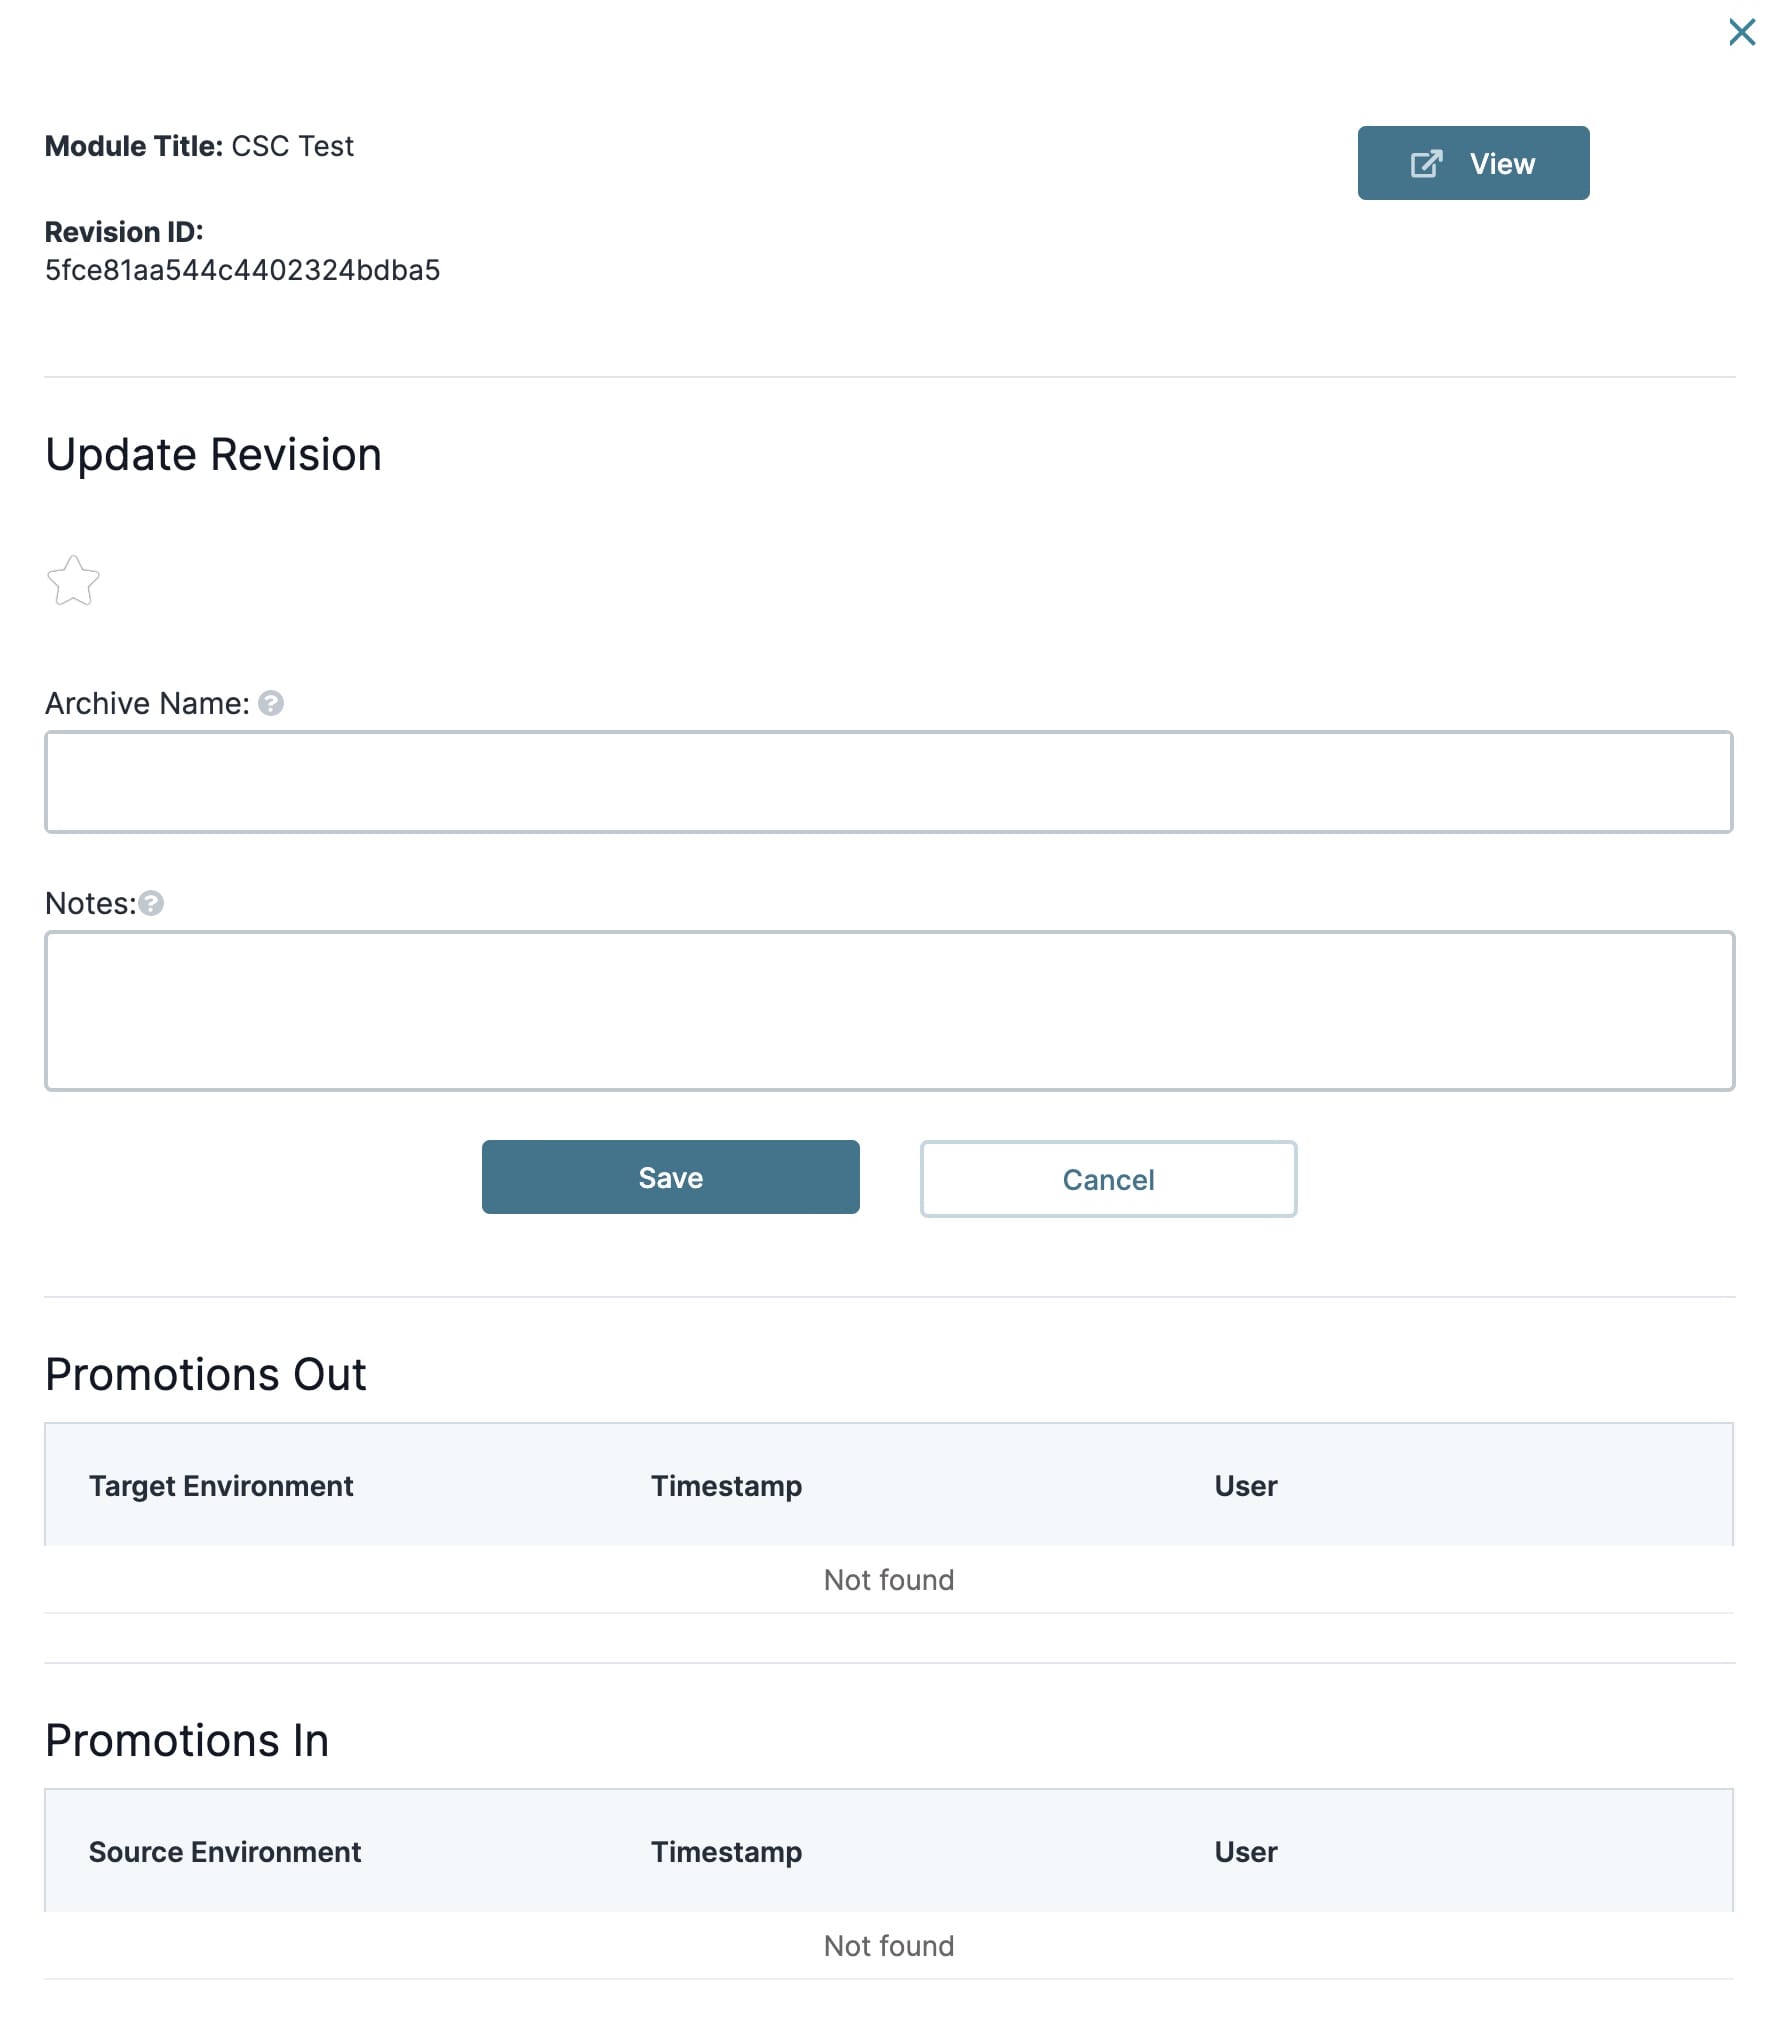
Let's take a look at the individual sections:
Attribute | Description |
|---|---|
Module Title | The name of your module. |
Revision ID | The identification number associated with the specific module revision. |
Star | Clicking on the star icon adds a star to your revision to bookmark it making it easier to find. As you’ll see, you can filter search results to include only starred versions. |
Archive Name | A name you can give your revision. A unique name can convey, at a glance, what your revision is about. |
Notes | Any notes you'd like others to know when they see your revision. |
Save | Saves any changes to the Update Revision section. |
Cancel | Cancels any current changes that you're making to the Update Revision section. |
Promotions Out | Displays which environment a module transitioned from. |
Promotions In | Displays which environment a module transitioned to. |
Comparing Module Revisions
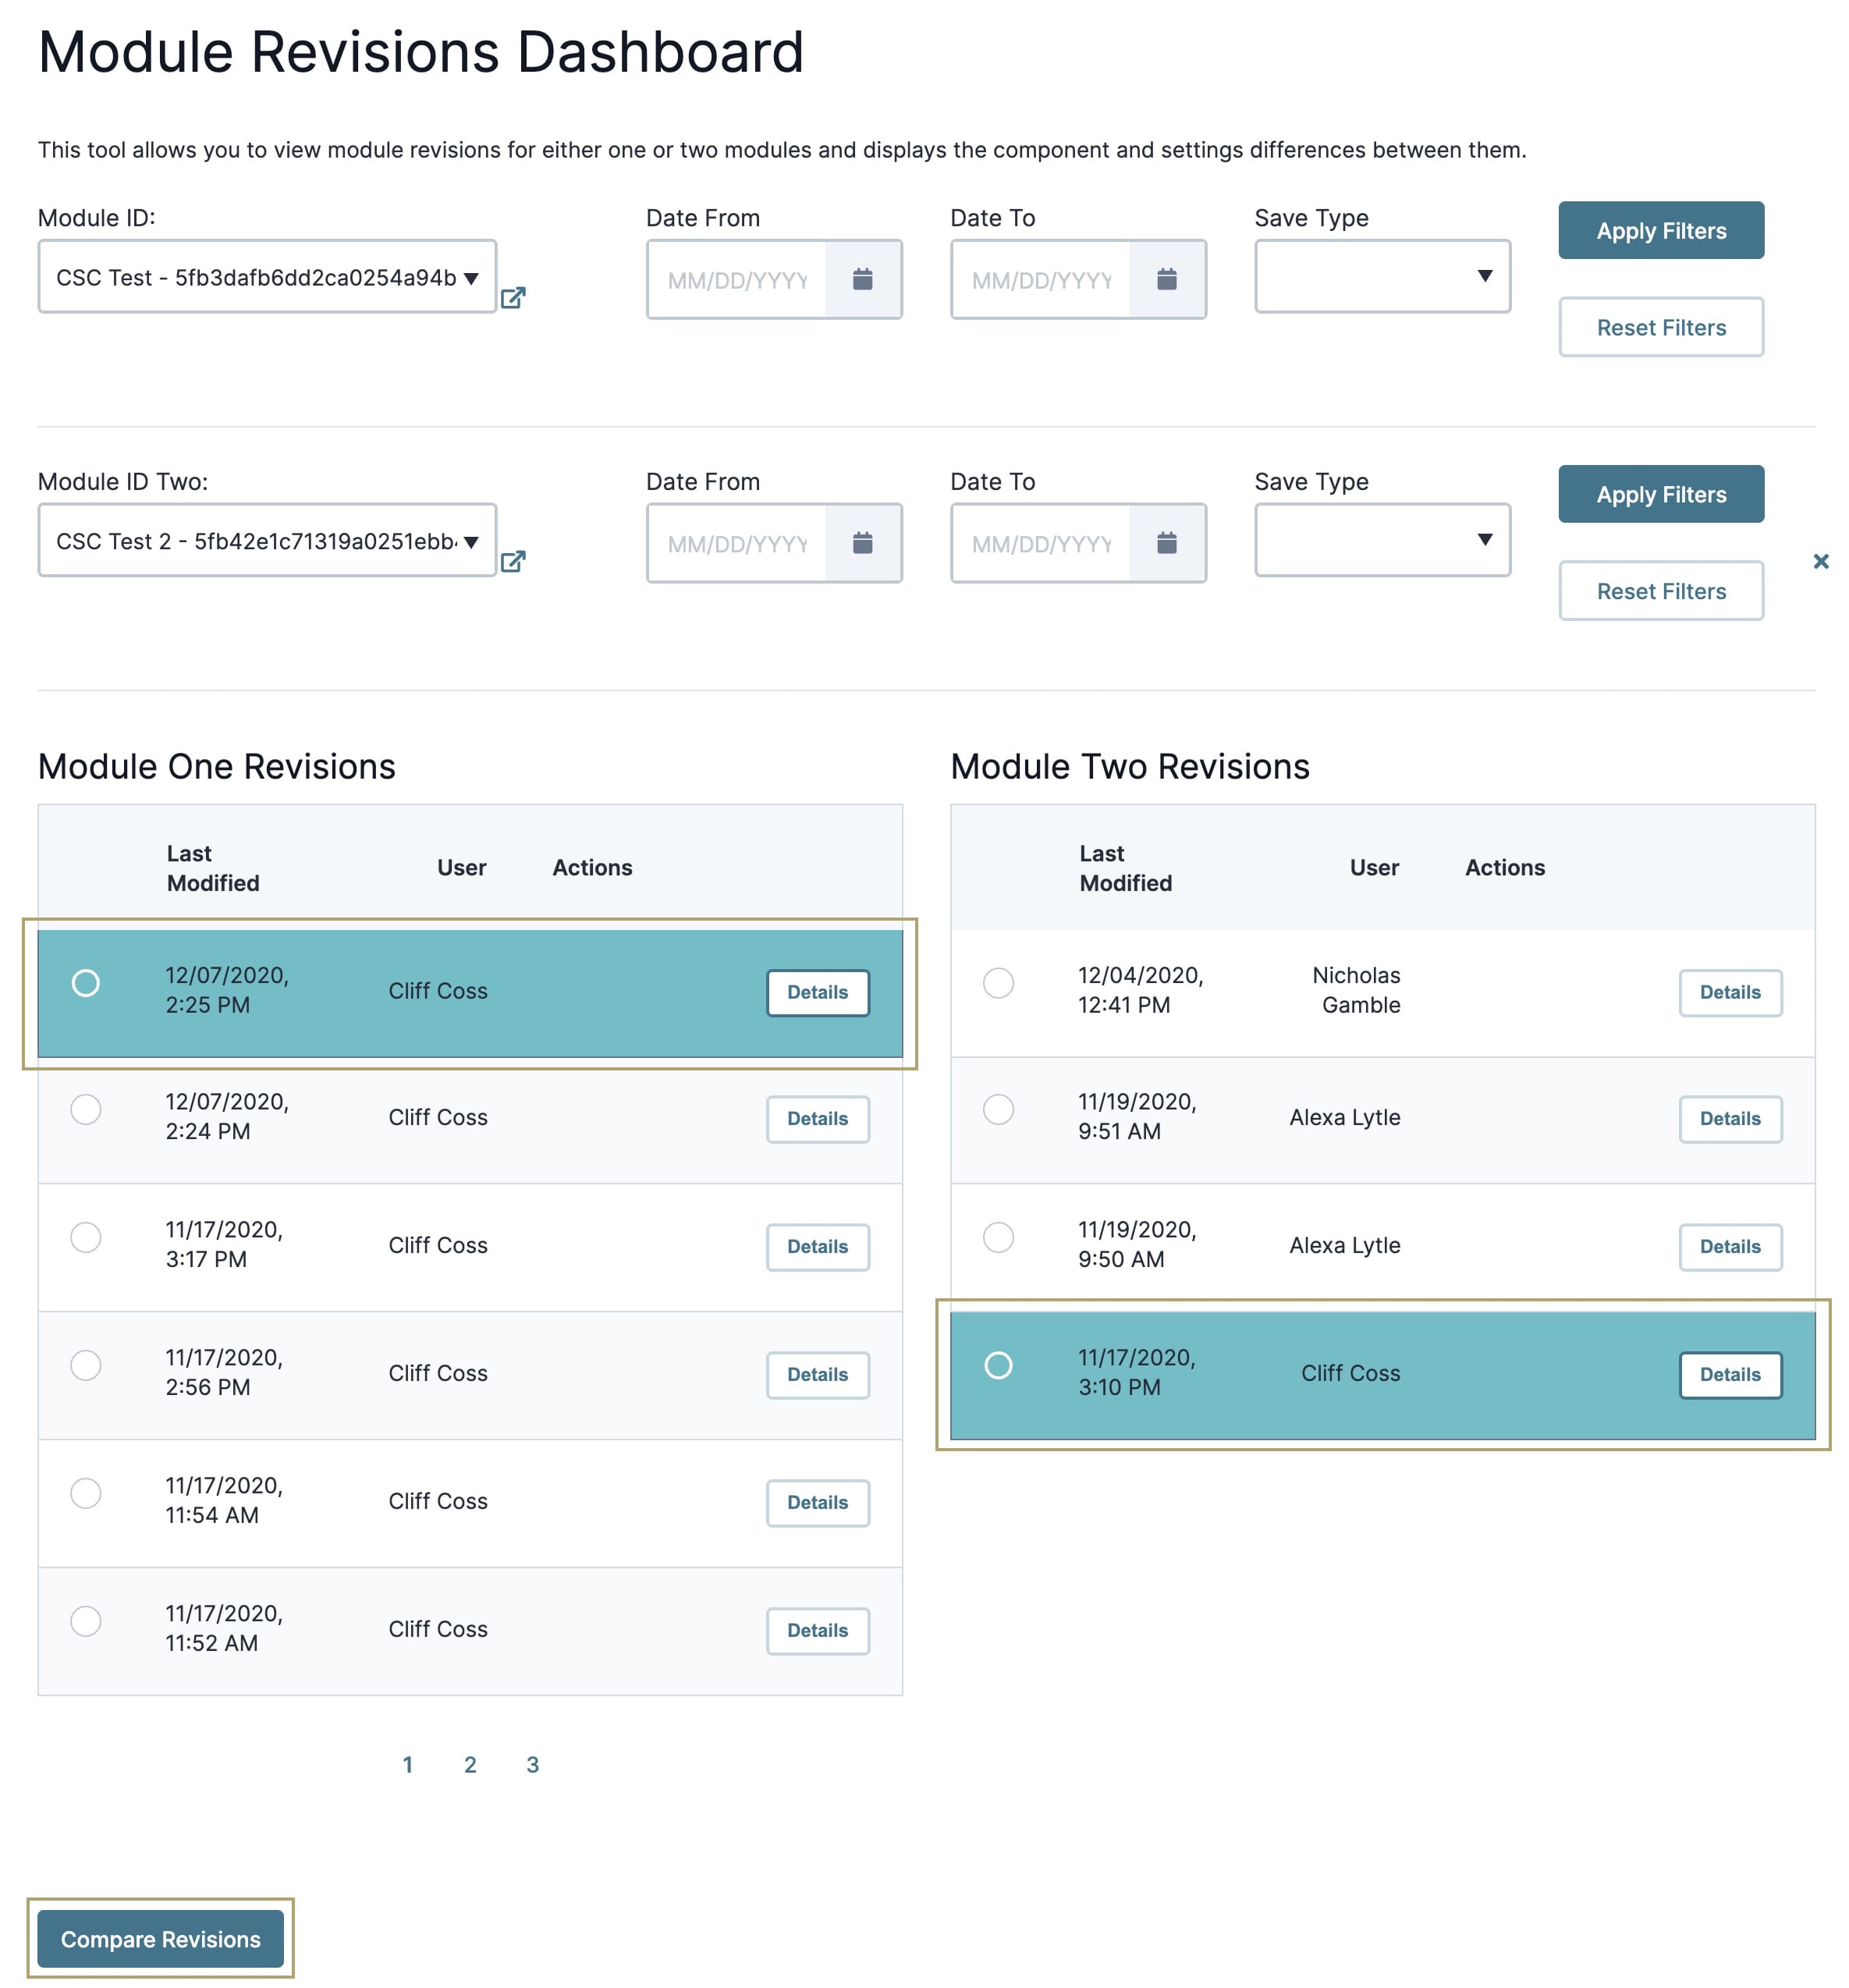
You can compare up to 2 modules side-by-side in the Module Revisions Dashboard. To begin a comparison:
Click the + Add Module button.
Select a second module from the drop-down. You can also add any other filters you'd like.
Best practice is to add the older module first and the newer module second. They'll display left to right, respectively.
Select the first revision for comparison in the Module One Revisions table. The cell highlights blue when selected.
Select the second revision for comparison in the Module Two Revisions table. Again, the cell highlights blue when selected.
Click Compare Revisions.
Here's an example of what you might see:
Navigating the Module Revisions Diff Dashboard
After comparing 2 modules, you're taken to the Module Revisions Diff page. Here, you can look at common elements side-by-side.
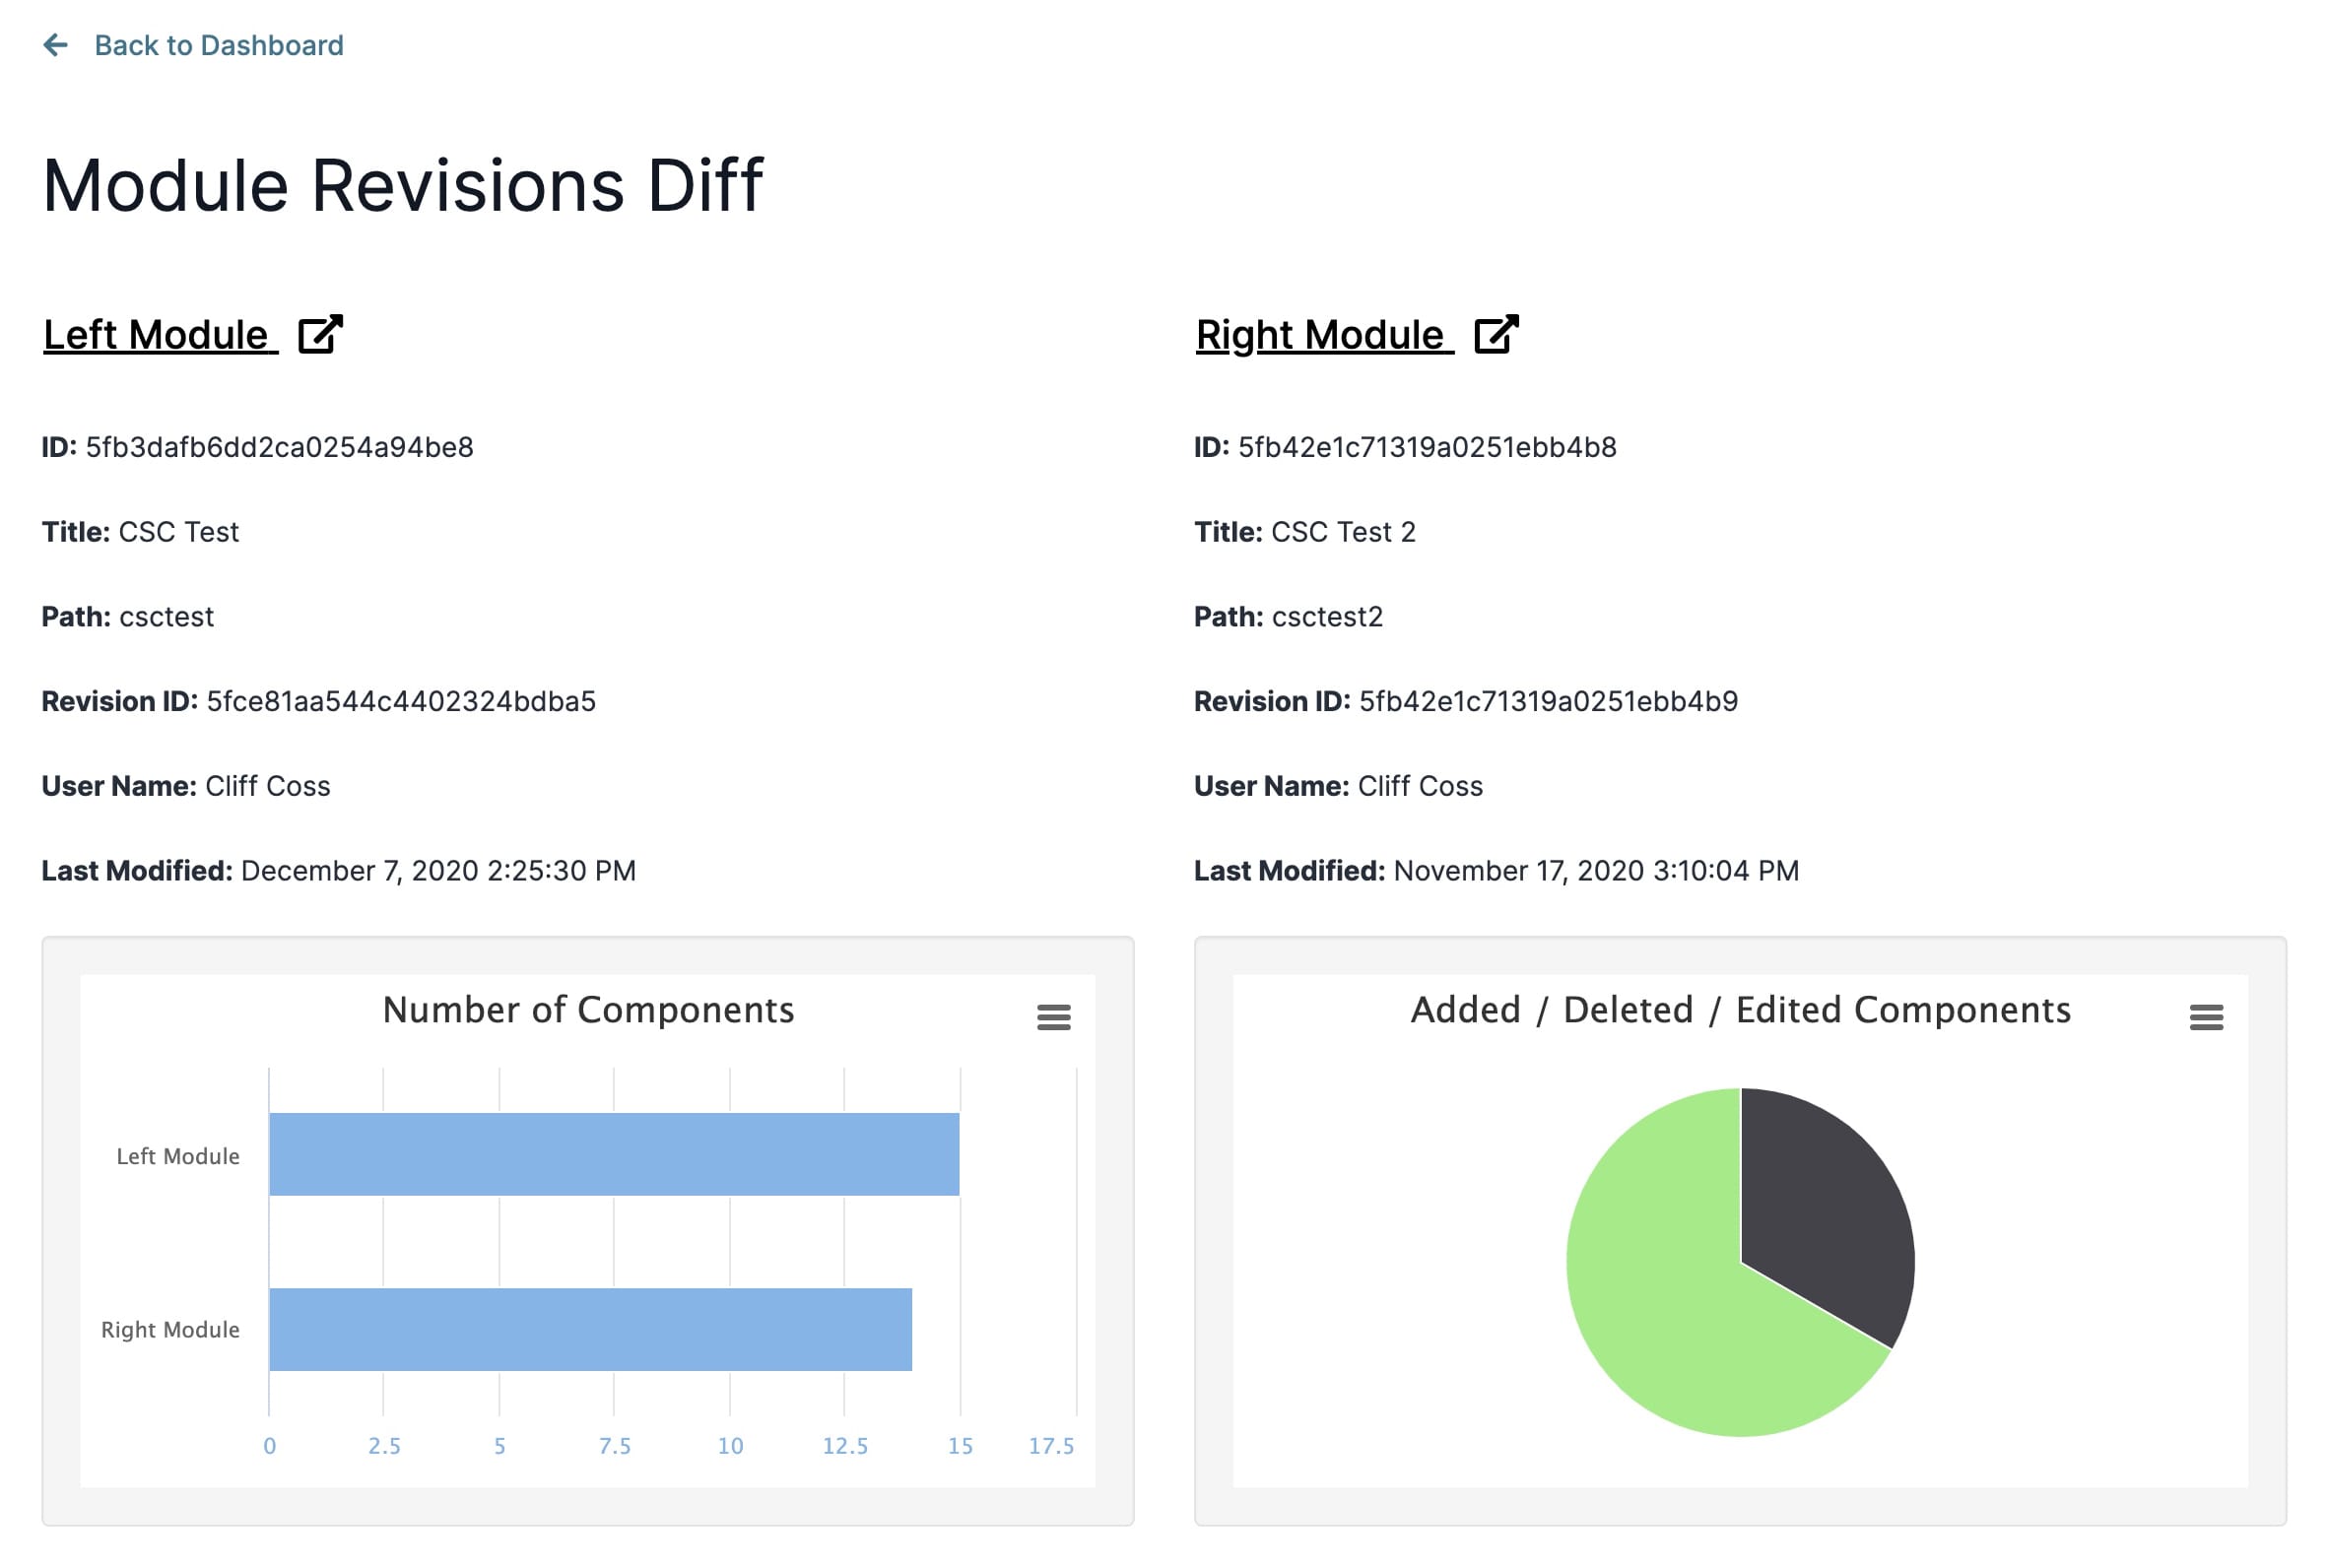
These fields show at the top of both the Left and Right Module columns:
Attribute | Description |
|---|---|
ID | Your unique module identification number generated in Unqork. |
Title | The title you gave your module. |
Path | The unique alphanumeric identifier of your module. |
Revision ID | A unique identification number assigned to your module revision. |
User Name | The name of the person who created the module revision. |
Last Modified | The last date the module revision was edited. |
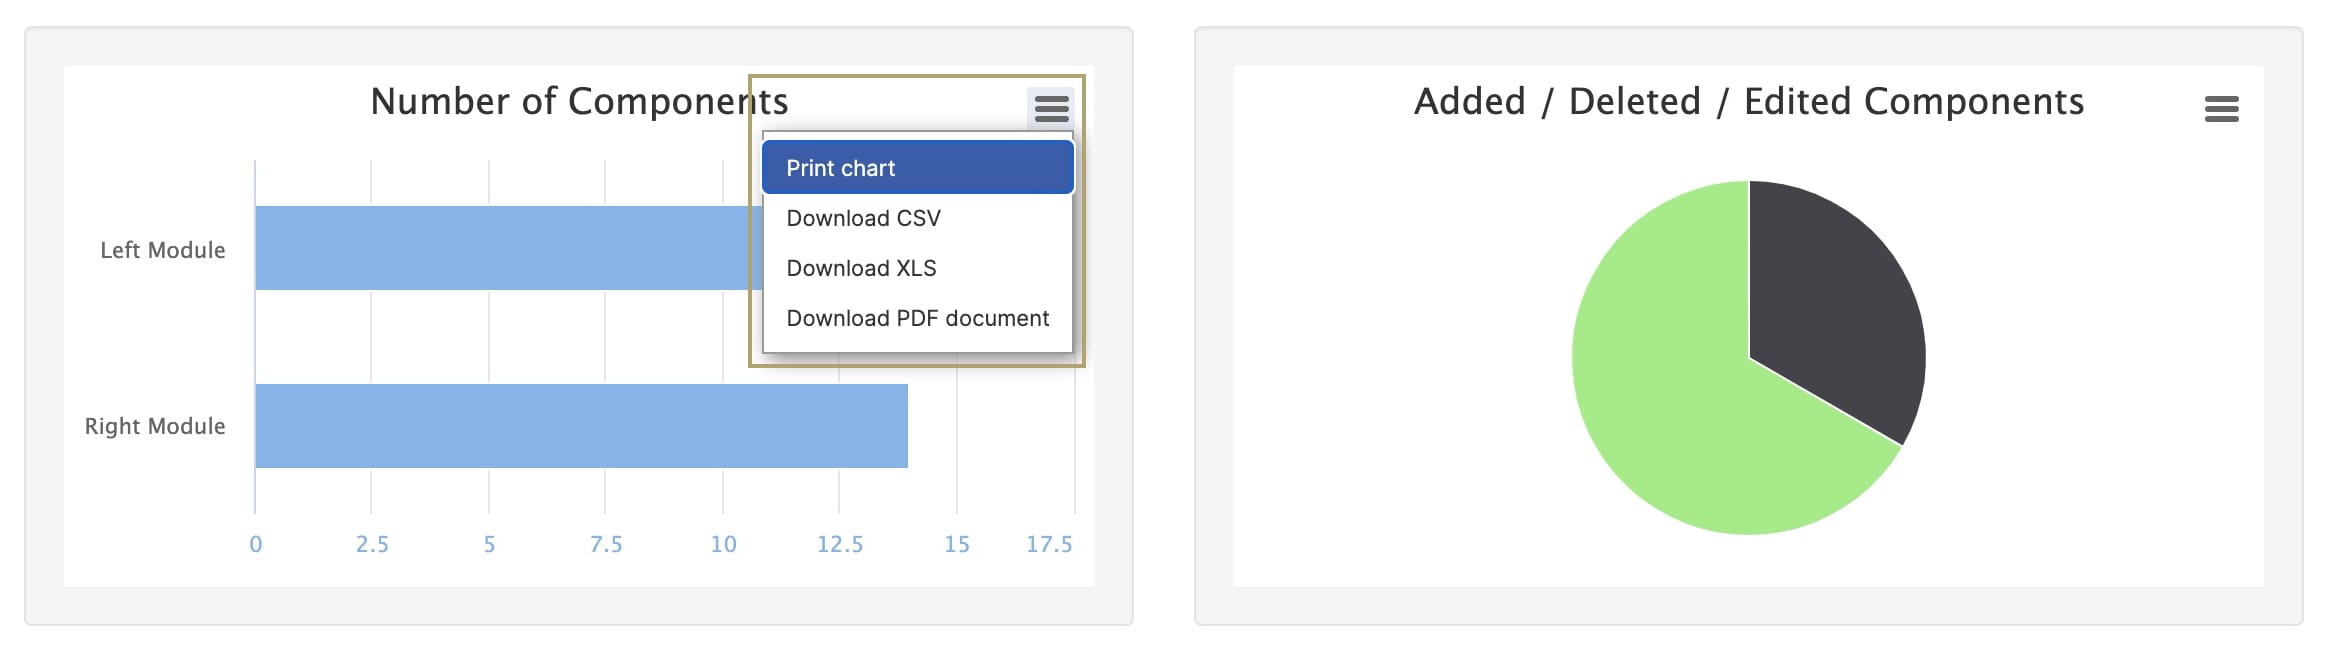
You'll also see widgets showing data for each module below:
Attribute | Description |
|---|---|
Number of Components | A bar graph showing how many components each module has. |
Added / Deleted / Edited Components | A pie chart showing how many components were added, deleted, or edited.
|
Components Section
Just below the Left and Right comparison, you'll dive deeper into your component revisions and see exactly which components changed.
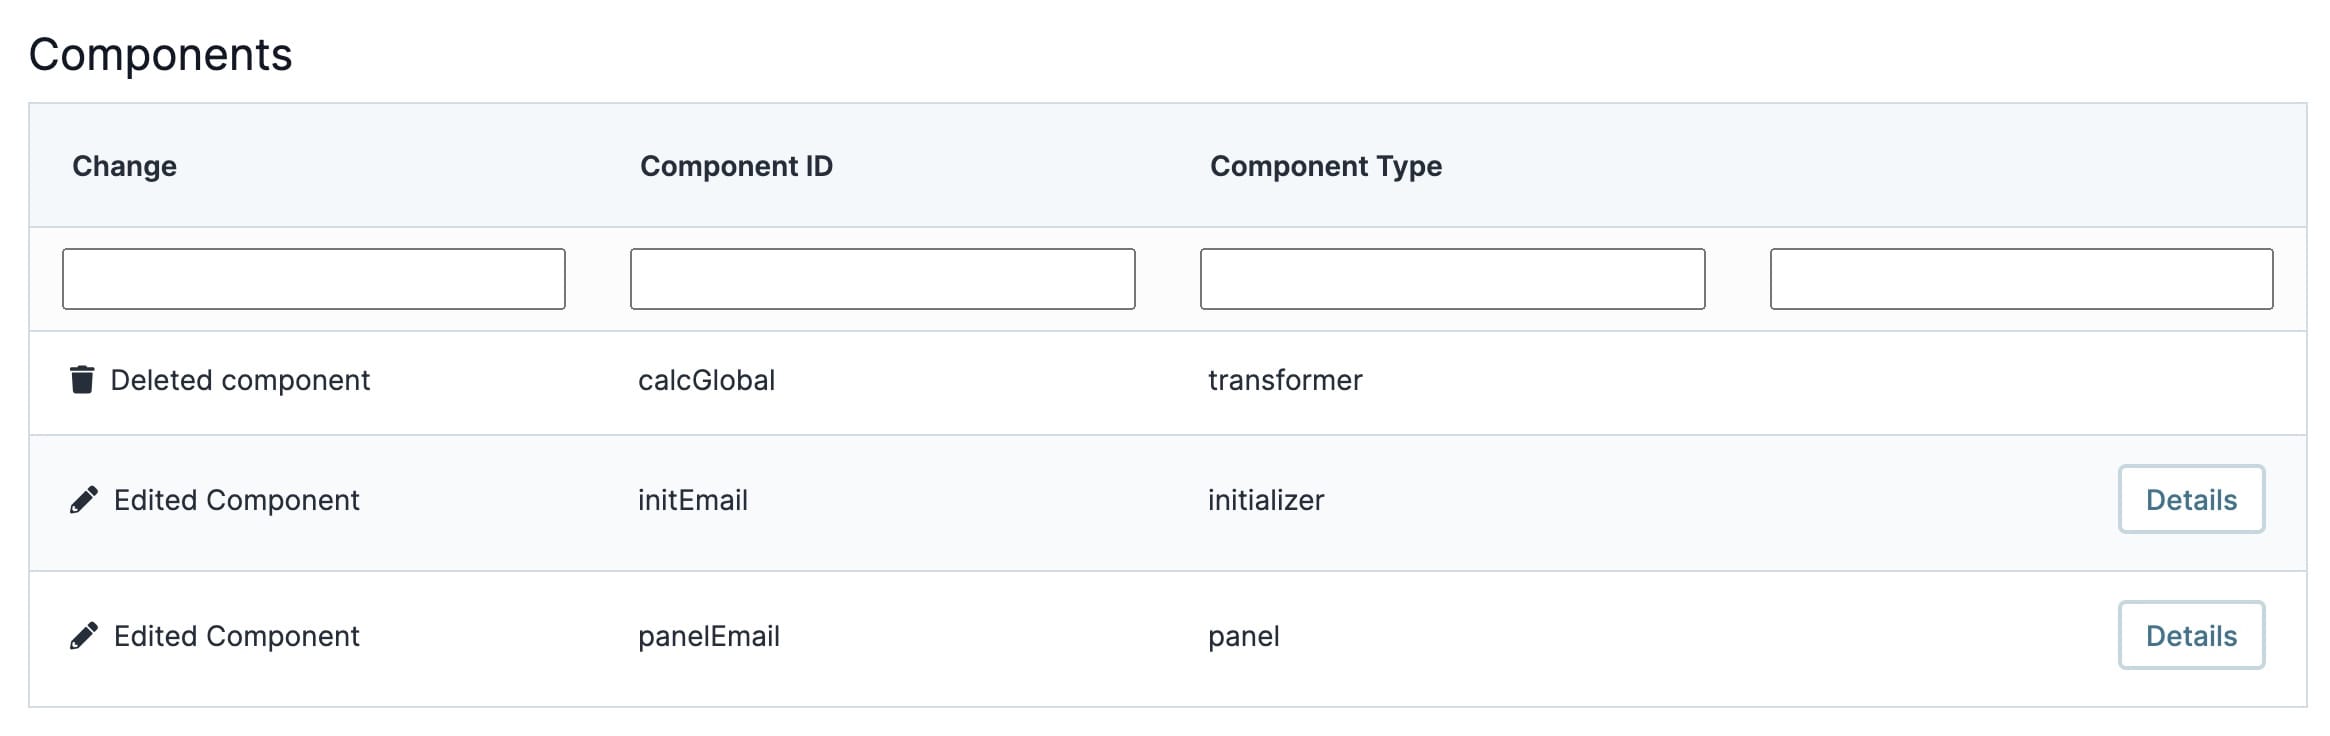
The Component section shows the following:
Attribute | Description |
|---|---|
Change | Type of change made. Changes may include New Component, Edited Properties, or Deleted Component. |
Component ID | The Property ID you gave the component. A Property ID is the unique field ID used by Unqork to track and link components in your module. The Property ID is how the software identifies your component. Using Property IDs lets you link components, creating logic-based configurations and API calls. |
Component Type | The type of component it is. |
Details | Lets you view details of the changes made to the component.
|
Settings Section
Just like the Components section, which is located above the Settings section, you'll see even more information about your settings revisions here.
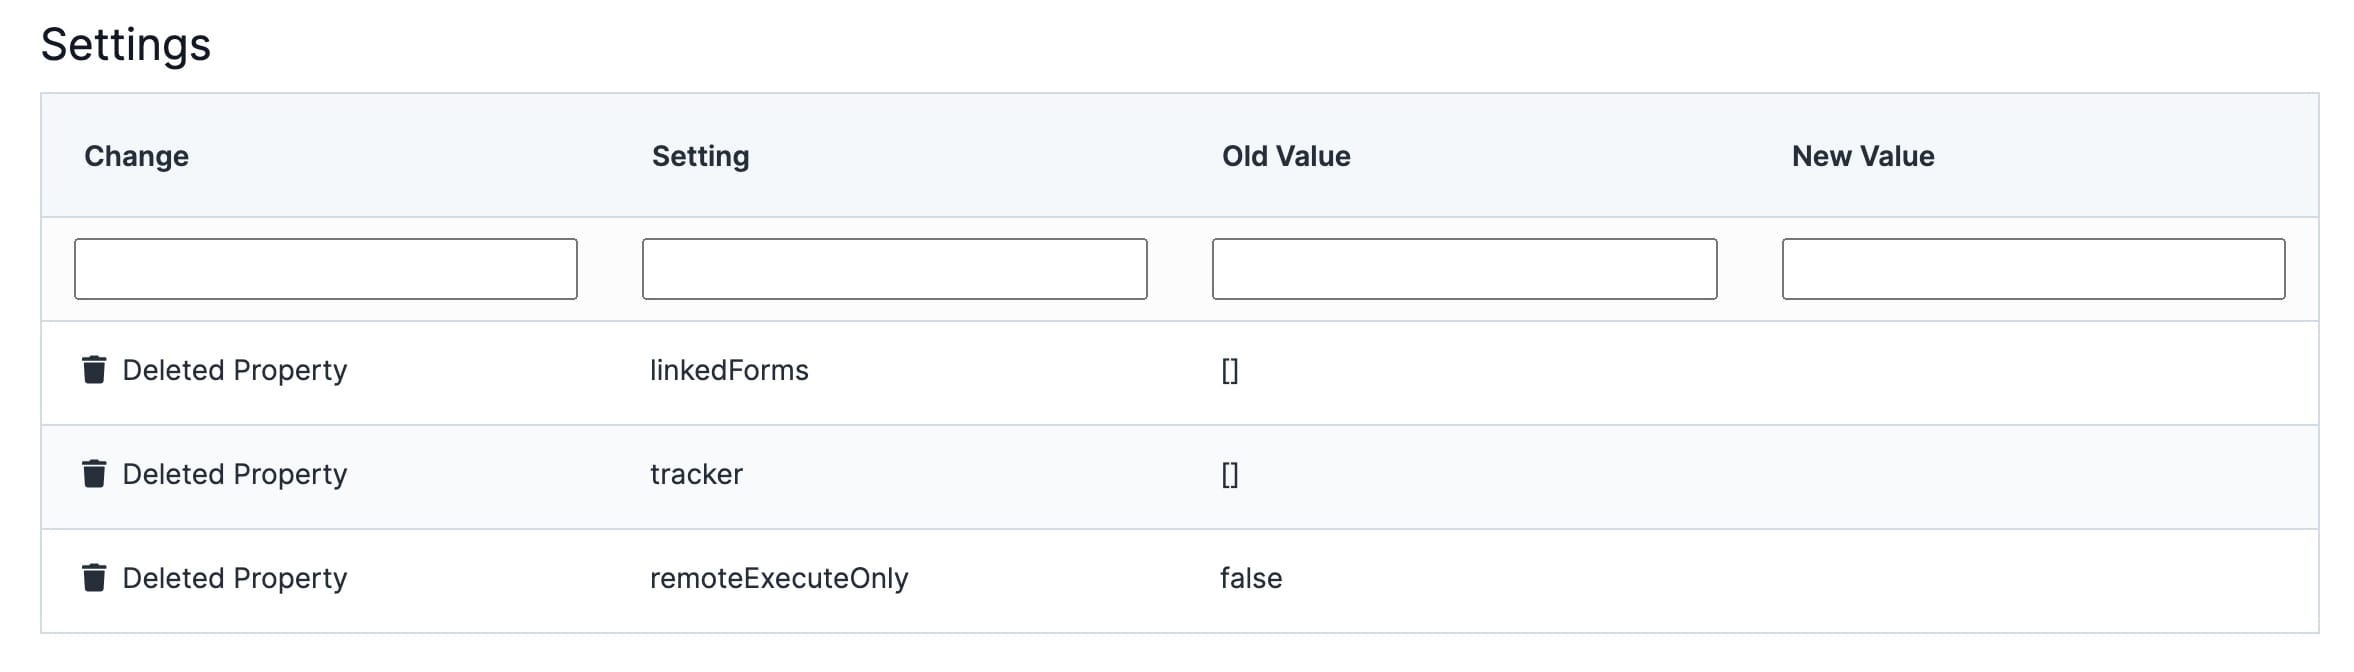
The Settings section shows the following:
Attribute | Description |
|---|---|
Change | Type of change made. Changes may include Added, Edited, or Deleted Property. |
Setting | The name of the setting. |
Old Value | Shows the setting's previous value. |
New Value | Shows what the setting was changed to. |
Exporting and Sharing Chart Data
The final feature of the Module Revisions Diff tool is the ability to export and share data from the pie charts. When you expand the Charts tab, you’ll notice a hamburger button (.jpg) ) at the top right of each chart widget. When you click on this button, you get the following options:
) at the top right of each chart widget. When you click on this button, you get the following options:
Print chart
Download CSV
Download XLS
Download PDF document
Let's look at each of these in more detail.
Print Chart
The Print Chart option lets you print data from each chart.
To print a chart:
Click the
(Hamburger) button at the right of the chart.Select Print Chart.
At the print dialog, set your Destination:
Save as PDF.
A connected printer device.
Set the Layout as Portrait or Landscape.
Under More Settings, set the Scale as either Default or Custom. The Custom option lets you adjust the chart size to fit the full page.
Click Save/Print. The button updates based on your Destination selected earlier.
Download CSV
A CSV (comma-separated values) file is a plain text file that contains a list of data.
To download your chart as a CSV file:
Click the
(Hamburger) button at the right of the chart.Select Download CSV.
Check your Downloads folder for the .csv file. Your file name is similar to that of the chart name. For example, the Number of Components chart downloads as number-of-components.csv.
Download XLS
XLS is a file extension created by Microsoft for use with Microsoft Excel.
To download your chart as an XLS file:
Click the
(Hamburger) button at the right of the chart.Select Download XLS.
Check your Downloads folder for the .xls file. Your file name is similar to that of the chart name. For example, the Number of Components chart downloads as number-of-components.xls.
Download PDF Document
PDF stands for Portable Document Format. Using this format prevents modification of your chart file while still allowing sharing and printing.
To download your chart as a PDF file:
Click the
(Hamburger) button at the right of the chart.Select Download PDF Document.
Check your Downloads folder for the .pdf file. Your file name is similar to that of the chart name. For example, the Number of Components chart downloads as number-of-components.pdf.