Service Logs Dashboard Tool
Overview
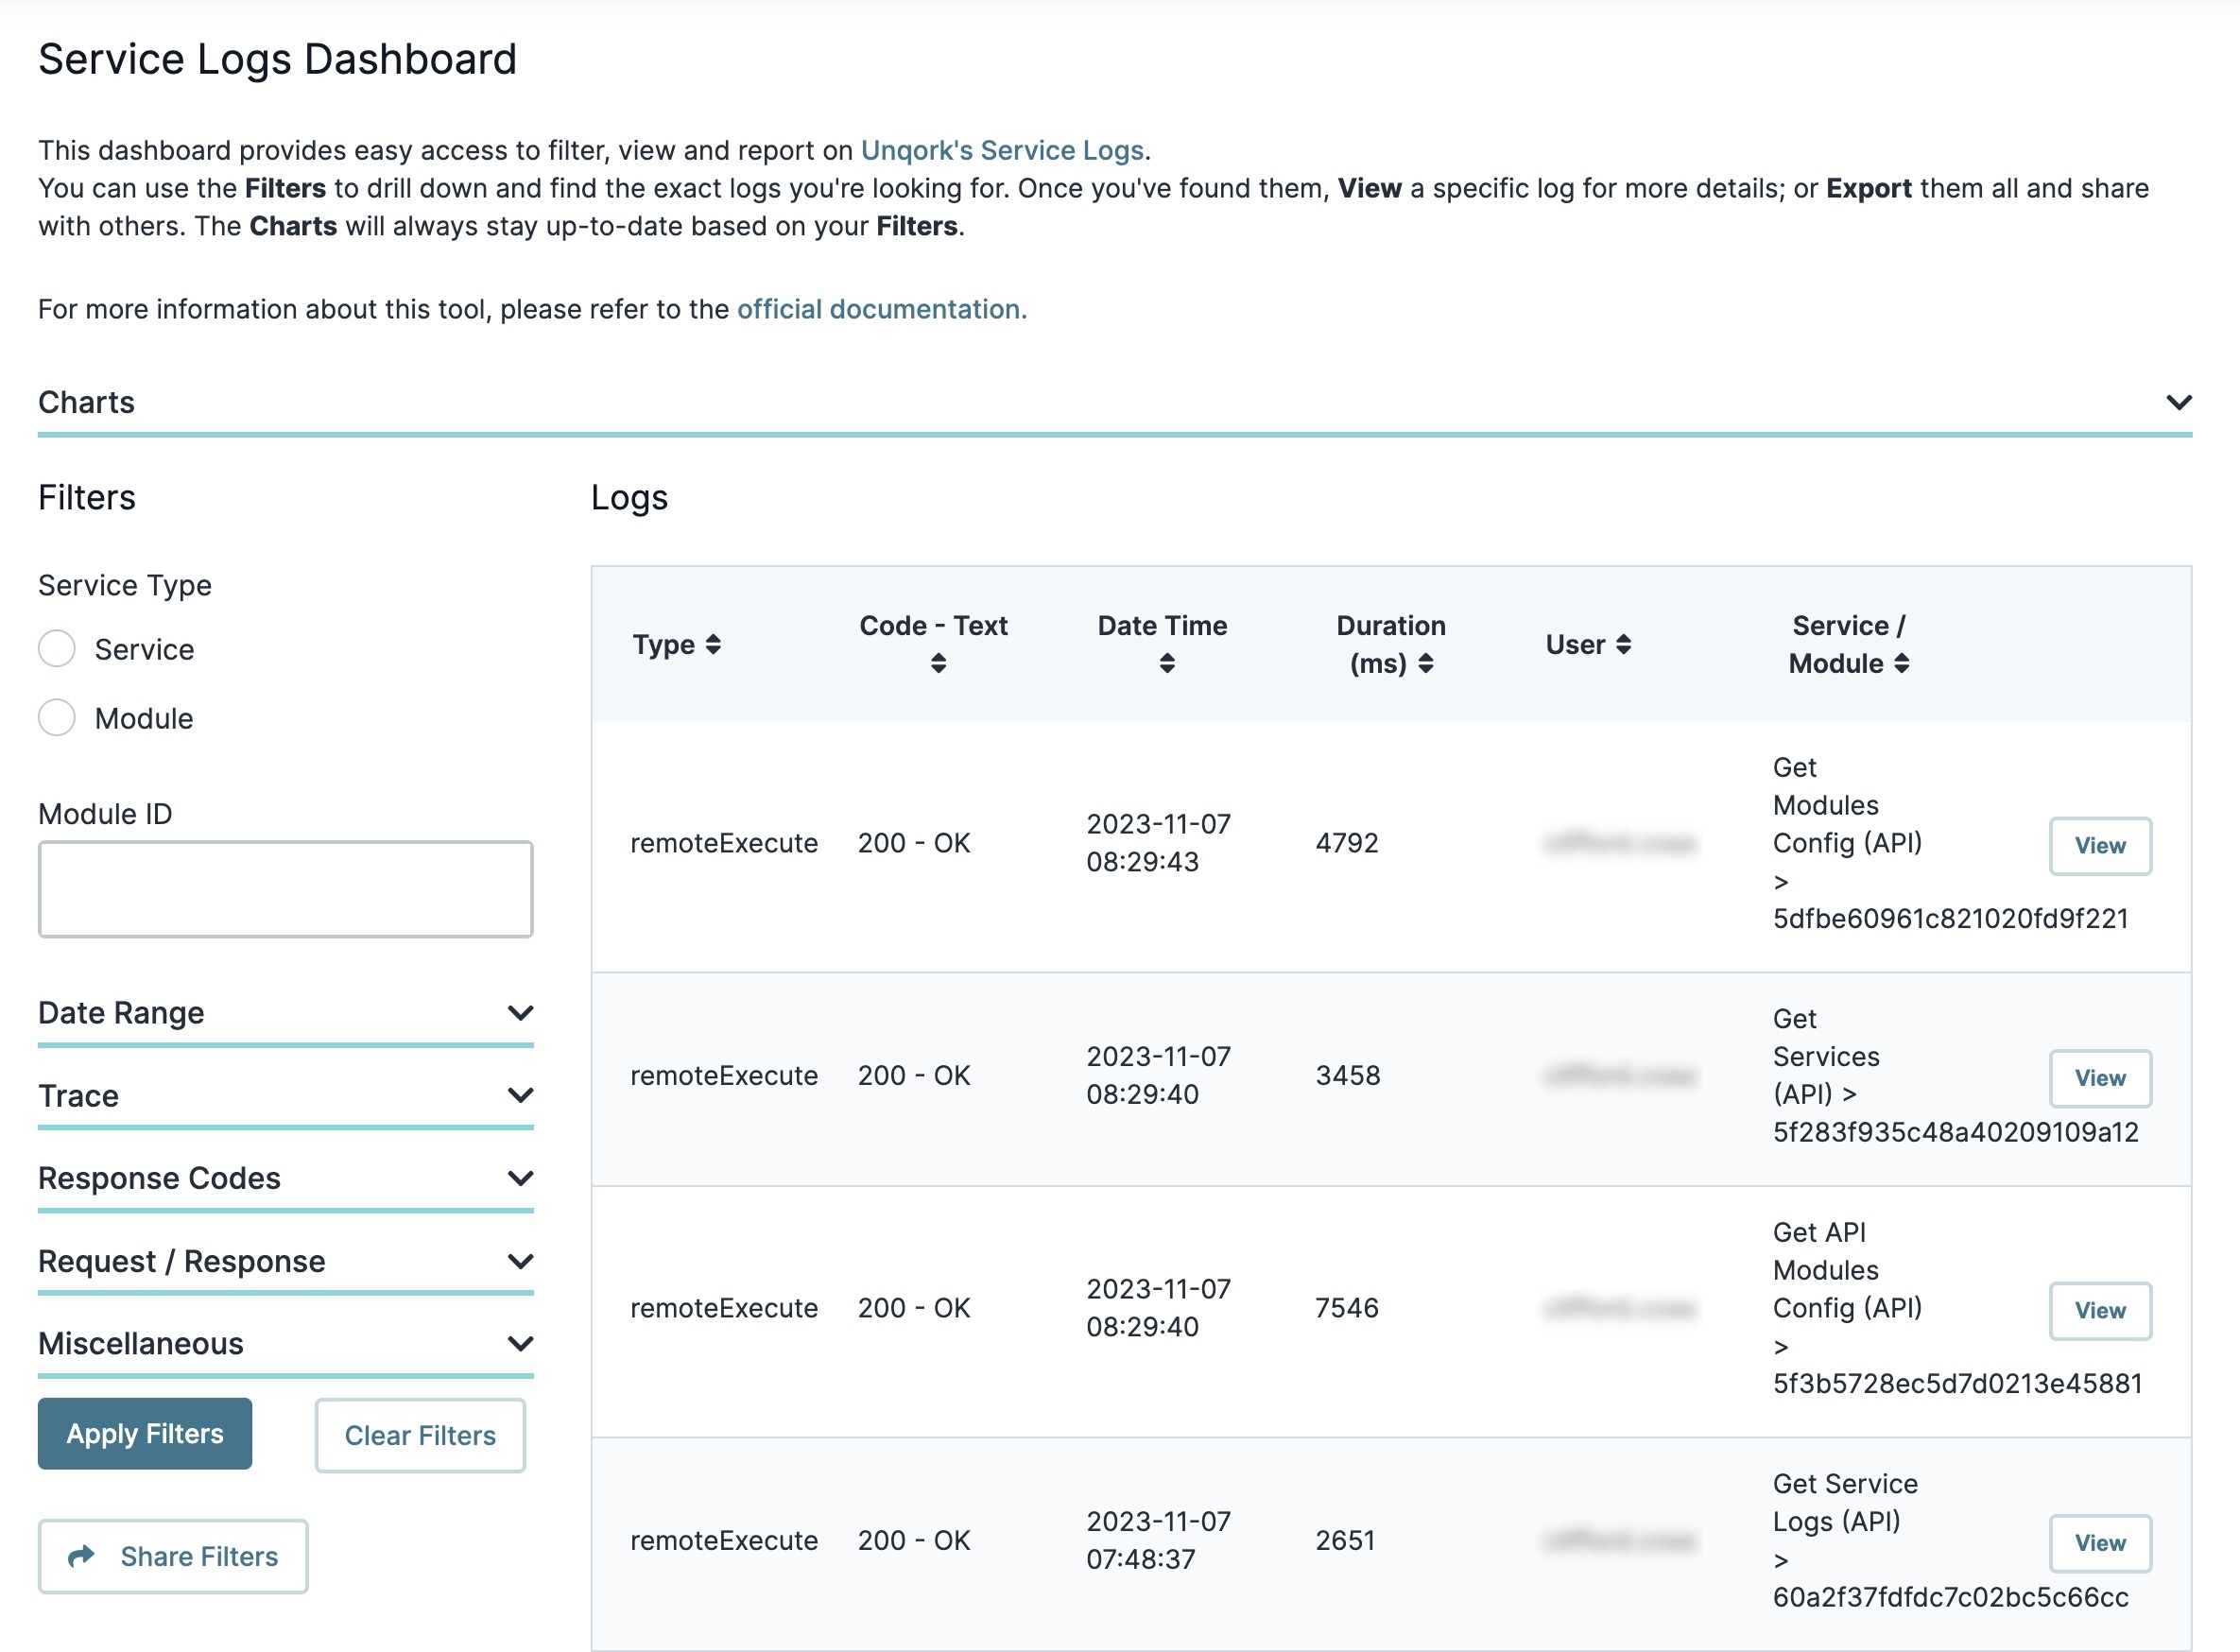
The Service Logs Dashboard Tool logs and displays all remote executes and service requests. You can filter your dashboard and choose metrics to see the performance of your calls. This lets you see what is and isn't working, which is why it's such a powerful debugging tool.
The Service Logs Dashboard offers a variety of filters. Using these filters, you can narrow down the logs based on criteria that match or don't match. Available filters include:
-
Service Type
-
Module ID
-
Date Range
-
Response Codes
-
Miscellaneous options including submission ID, User ID, Component, and URL.
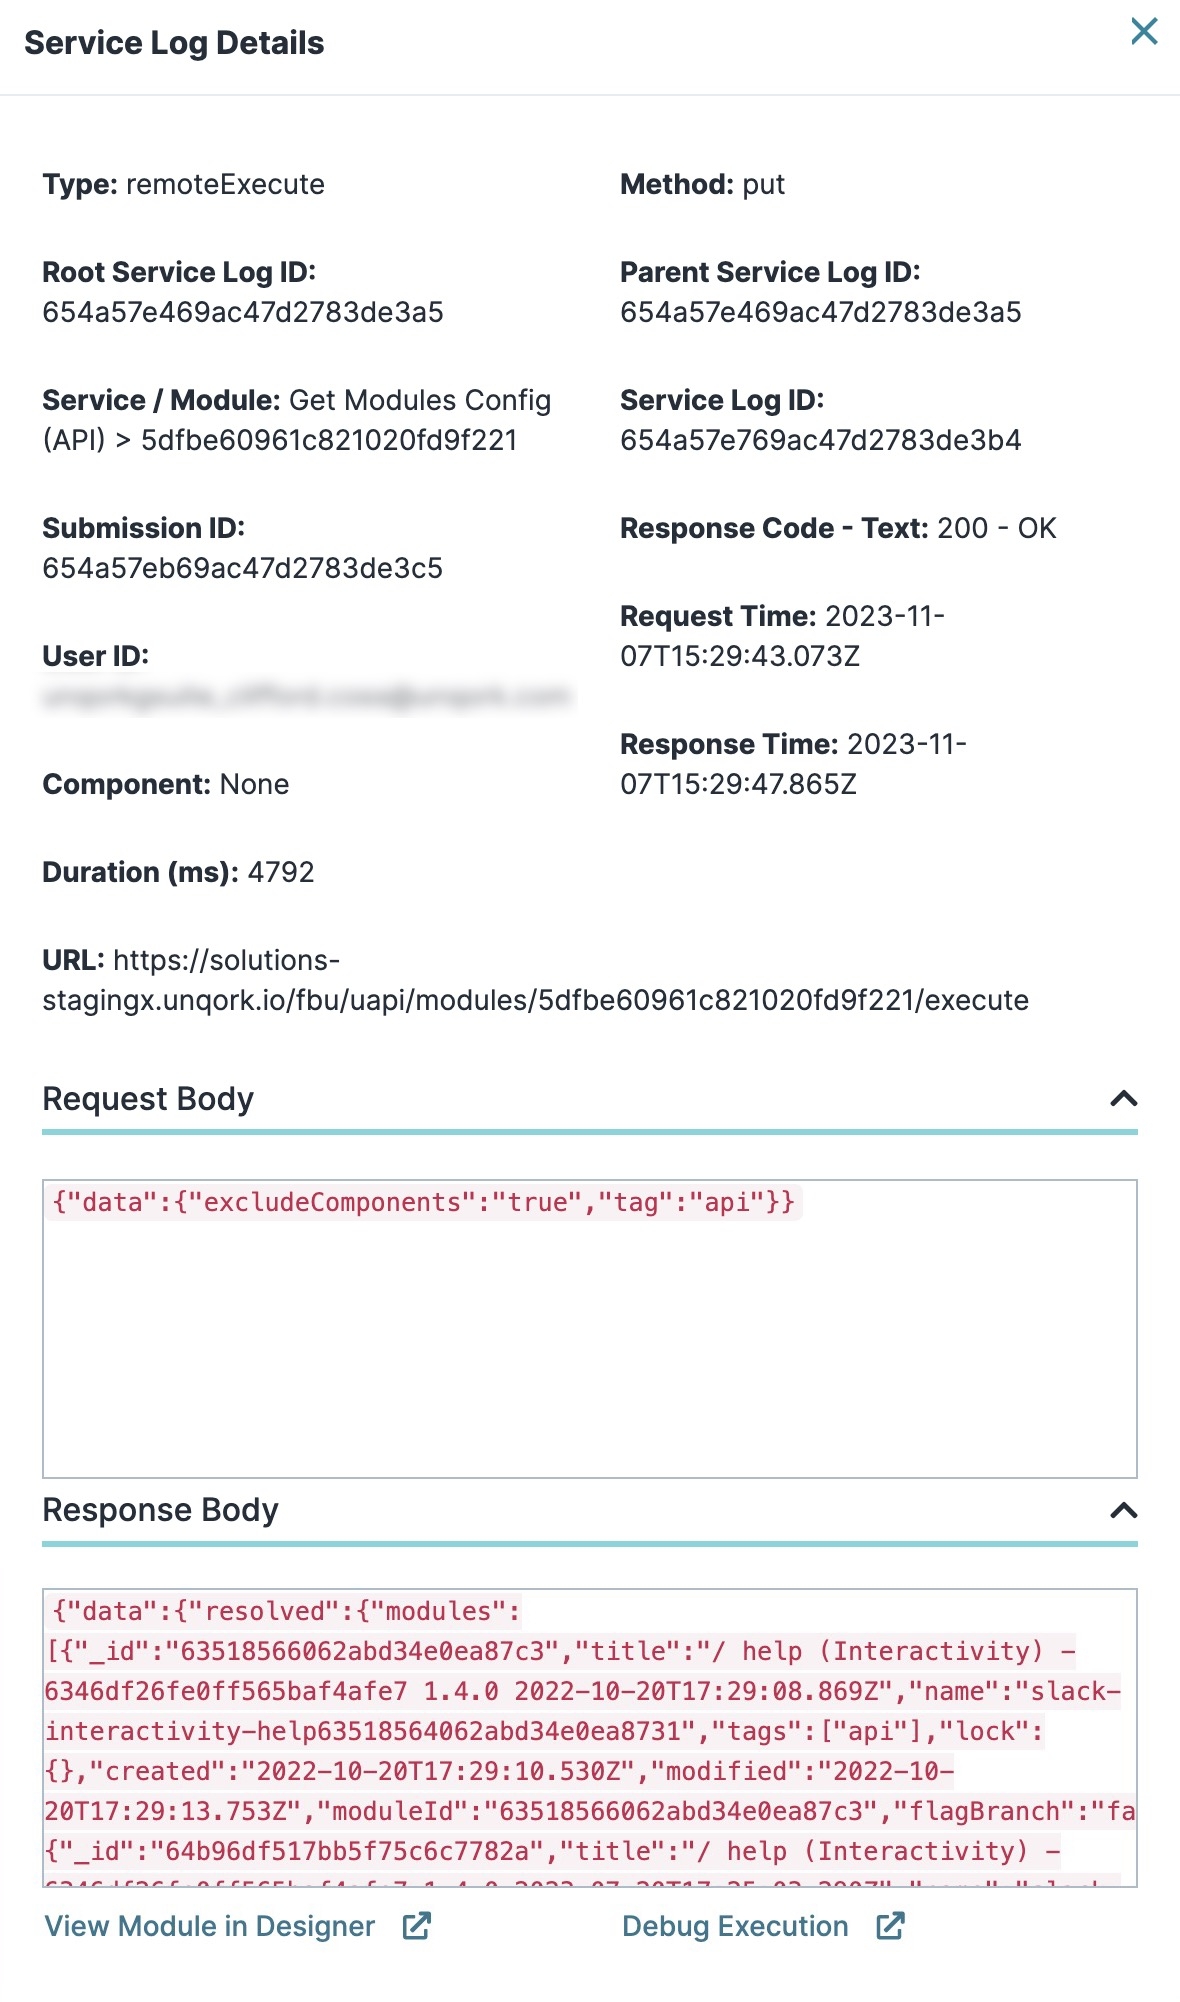
Once you've found your API call, you can view its details. This basic information appears listed in a table that you can export for analysis. You can also view a call in more detail using the pop-up modal. This pop-up shows you the call's:
-
Service Type.
-
Method (GET, PUT, PATCH, POST, DELETE).
-
Request Time.
-
Duration in milliseconds (ms).
-
User, module, and submission ID.
The Service Logs Dashboard also includes a Charts panel with a range of KPI (key performance indicator) widgets. You have the choice of exporting, printing, or creating PDFs from each chart.
It's important to note that this tool retrieves information about your API calls. When an API call isn’t working, the tool will help you find the call and the module it lives in. What the Service Logs Dashboard tool can’t do is troubleshoot the issue for you.
TIP For help with troubleshooting, search Troubleshooting in our In-Product Help.
Service Logs Dashboard Tool Access
This tool requires Creators Also known as Unqork users; anyone who is inside the Unqork platform. to have specific role access in Environment Role RBAC (Role-Based Access Control) or WSRBAC (Workspaces Role-Based Access Control.
If using Environment Roles (not using WSRBAC):
-
Creator roles can view all service logs in this tool.
If using WSRBAC:
-
Creators can view service logs related to modules, workflows, or services inside Workspaces they have access to.
-
If a user cannot access specific service log records, it likely means they do not have access to the Workspace containing the module.
What You'll Learn
In this article, you’ll learn how to:
Filtering the Logs Table
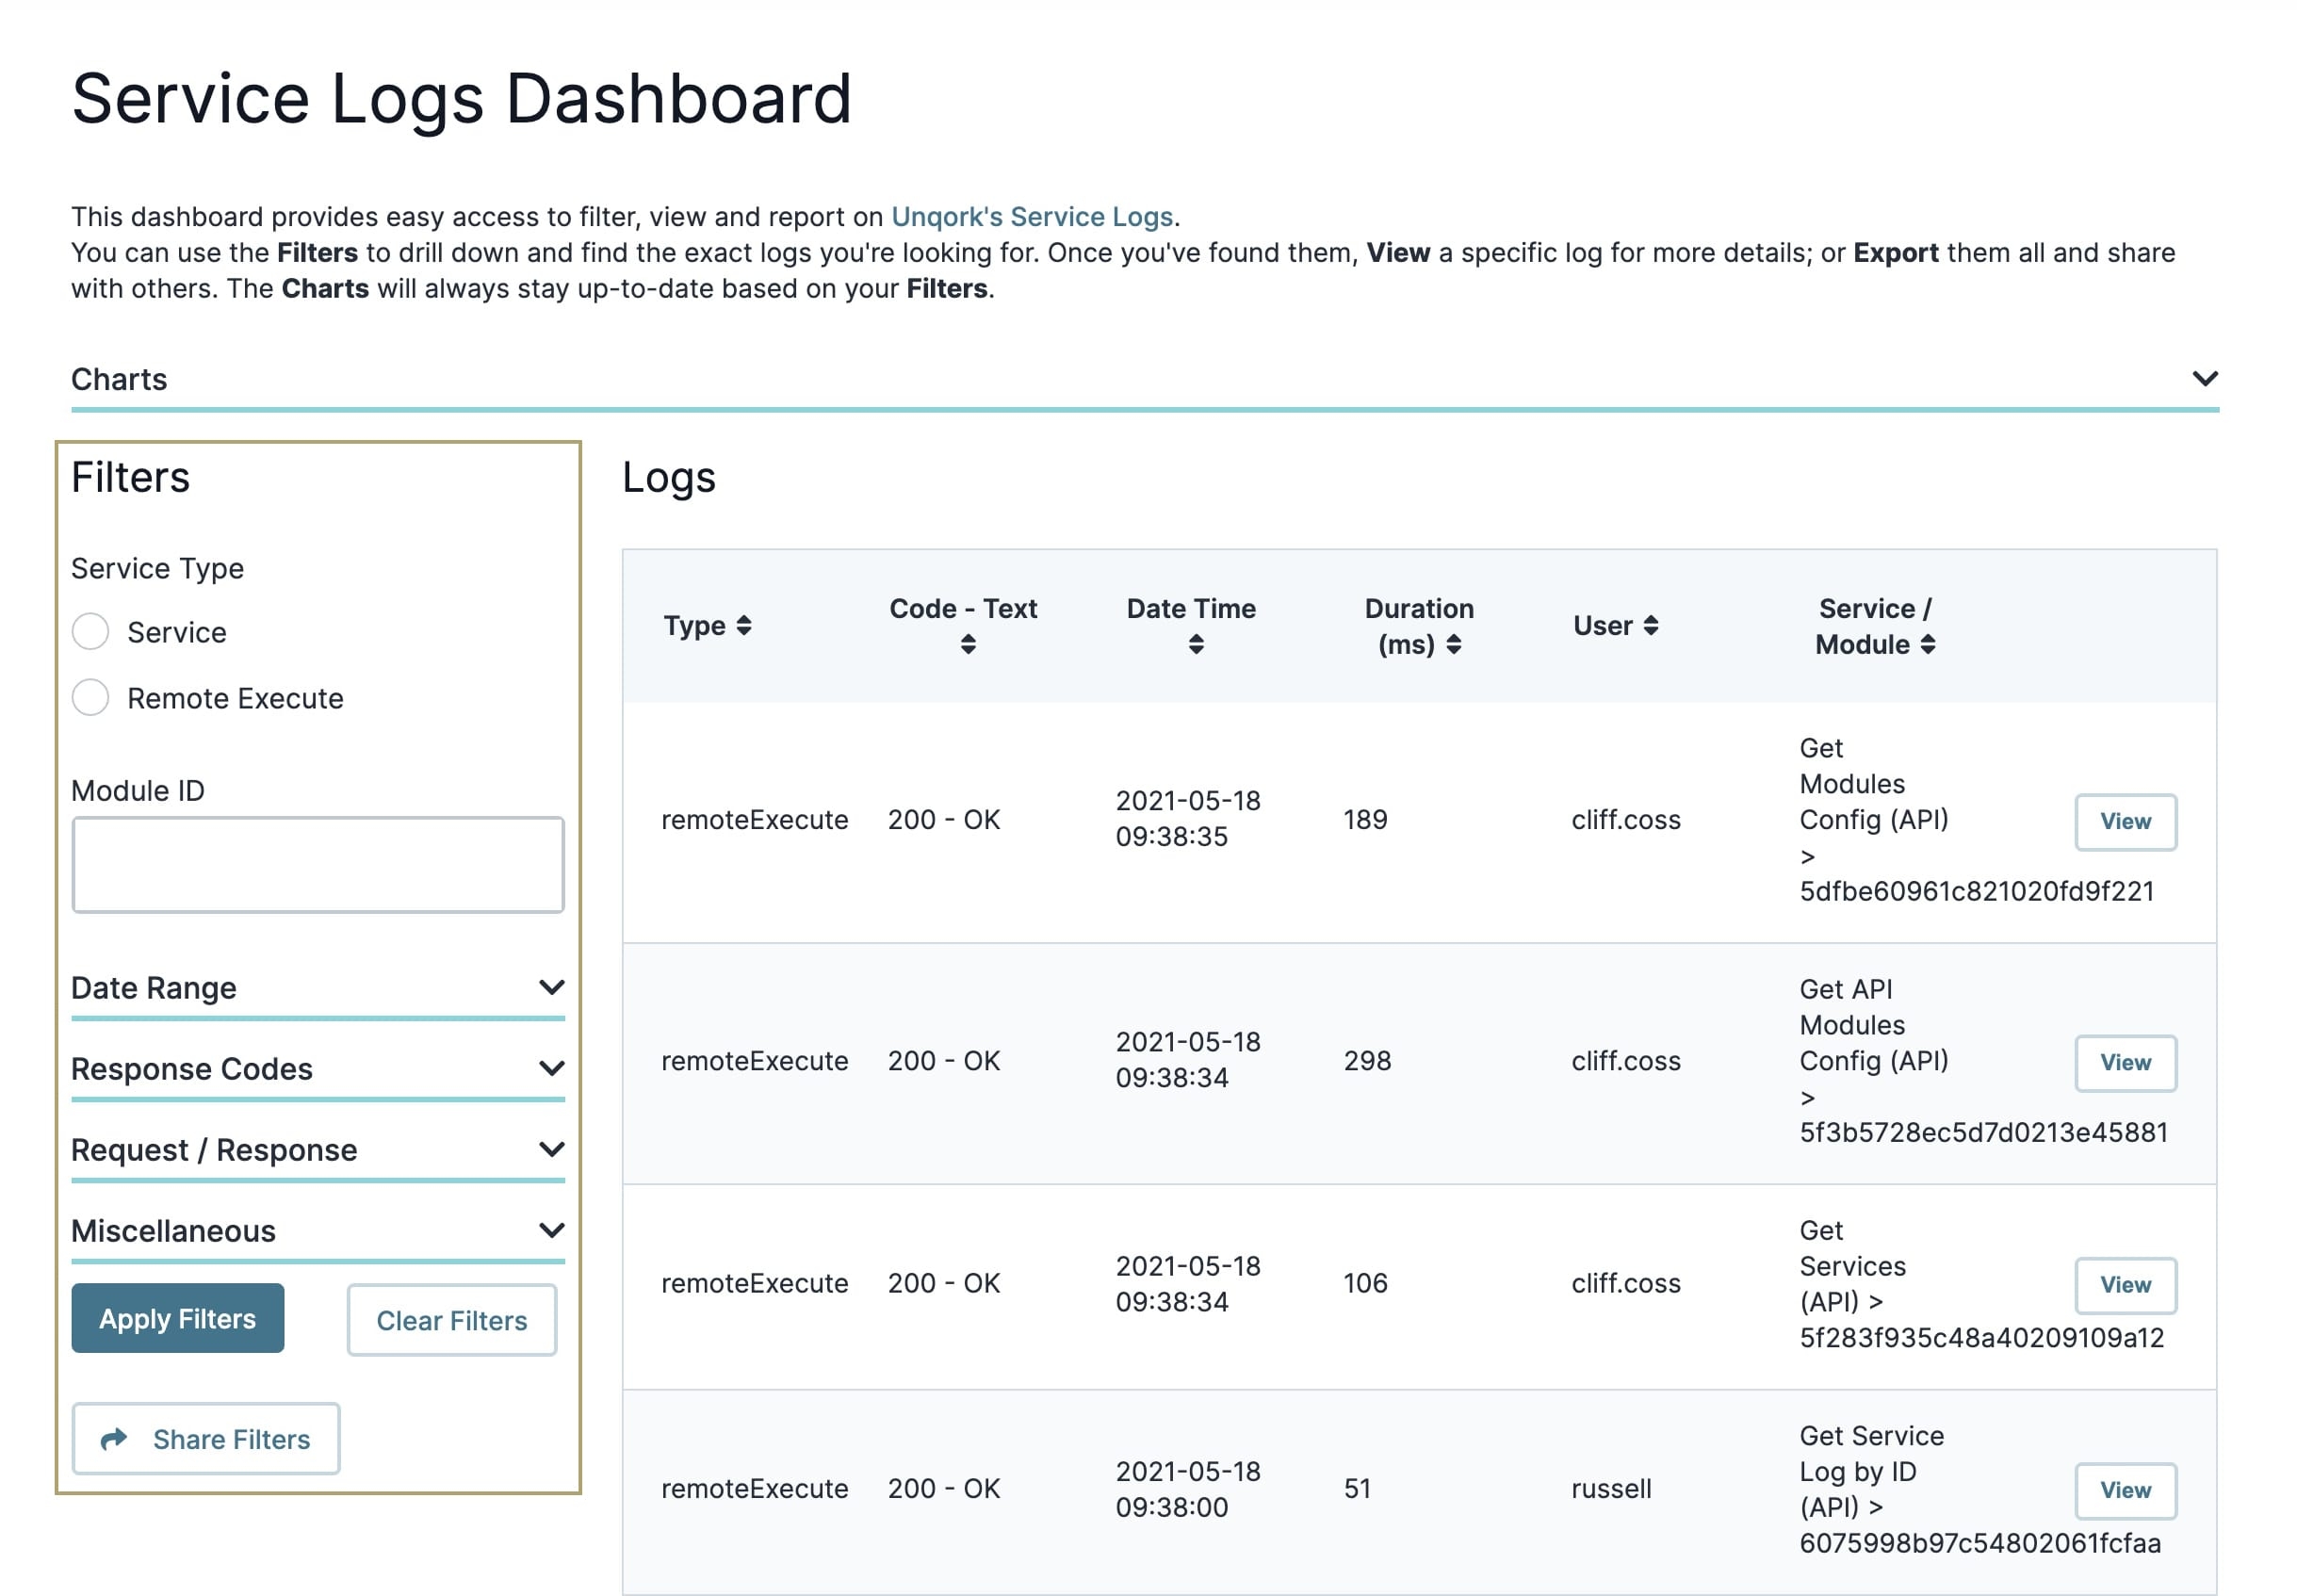
If you’ve used filters in the past, this tool will be easy for you. After executing an API call in your application, that call lives in Unqork’s Service Logs. Everyone making an API call using the Unqork services has their calls saved to the Service Logs. As you can imagine, it'd be a chore to sift through this ever-changing environment for your calls. To save time, the Service Logs Dashboard tool offers some precise filters. The filters are:
-
Service Type
-
Module/Service Name
-
Module ID
-
Date Range
-
Response Codes
-
Miscellaneous
Below these filter options, you'll see 3 buttons. Each button will do the following:
-
Apply Filters: Clicking this button applies the filters you've selected.
-
Clear Filters: Clicking this button clears all filter selections to start again.
-
Share Filters: Clicking this button generates a URL you can share with a team member that shows the results of your filter selections.
The following image shows the filters you can use in the Service Logs Dashboard:
Let’s go through each of these filters.
Service Type Filters
The first filter you'll see has 2 options. Service and Remote Execute are the 2 types of API calls you can make in the Unqork Designer Platform. Making a selection here narrows your search significantly. When you select Service, you can filter by service name and/or module ID to find an external API call. When you select Remote Execute, you can filter by module name and/ module ID to find an internal API call.
Filtering Remote Execute API Calls
To filter for internal API calls:
1. | Select Remote Execute as the Service Type. |
2. | Select a module name from the Module Name drop-down. |
A module ID automatically populates in the Module ID field.
3. | Click Apply Filters. |
The Logs table shows all calls associated with your chosen service type and module ID.
Filtering Service API Calls
To filter for external API calls:
1. | Select Service as the Service Type. |
2. | Select a service name from the Service Name drop-down. |
A module ID will automatically populate in the Module ID field.
3. | Click Apply Filters. |
The Logs table shows all calls associated with your chosen service type and module ID.
Date Range Filters
Below the Module ID field, you’ll see the Date Range panel. Once expanded, you can filter by start and/or end date of an API call. To be even more specific, you can also filter start and/or end time as well. This filter uses UTC (Coordinated Universal Time).
The Start and End Date fields use a date picker. The Hour, Minute, and Second fields are drop-down menus. You can filter off any one of these fields, or all at the same time. Let's look at the different options you have for filtering the date and time of your API call.
To use the Date Range filters:
1. | Expand the Date Range panel. |
2. | Set the Start Date using the date picker. |
3. | Select the Hour, Minutes, and Seconds associated with the Start Date. Again, you'll use the UTC timezone here. |
4. | Set the End Date using the date picker. |
5. | Select the Hour, Minutes, and Seconds associated with the End Date. |
6. | Click Apply Filters. The Logs table filters to list calls for your chosen date or date range. |
Response Codes Filters
An API call is a 2-step process. We call these steps the request and the response. When you trigger a Plug-In component, that'll be your request. And the result of that call is your response. If your call works or doesn't, it'll receive a response code. These codes also have an associated description with them. For instance, a successful request would give a response code of 200 and text saying 'OK'. Response codes are 3-digit codes, ranging from 100-511. We organize these codes based on the type of information they give us. Let's take a quick look at these 5 categories:
-
100 codes are informational codes.
-
200 codes are success codes.
-
300 codes are redirect codes.
-
400 codes are client error codes.
-
500 codes are server error codes.
Once expanded, this filter shows 4 options. Depending on the option you pick, the Logs table will show different entries.
To use the Response Codes filters:
1. | Expand the Response Codes panel. |
2. | Select one of the following Response Codes options. |
Option | Description |
---|---|
All Codes | Shows all calls with a response code. |
Error Codes | Filters your service logs to show only calls with 400 response codes. |
Success Codes | Filters your service logs to show only calls with 200 response codes. |
Select Specific Codes | Selecting this option creates a drop-down menu where you can select 1 of the 63 possible response codes. For instance, you can select 200 to filter all successful calls. Every call that includes that response code will populate in the Logs table. |
NOTE The image below is an example using Select Specific Codes. Here we selected a 200 response code. You can select as many codes as you want from the filter.
3. | Click Apply Filters. |
Request/Response Filters
The Request/Response filter lets you narrow the log to a specific request key and value or response key and value. Because these fields are text fields, you'll want to check your spelling. We suggest doing a copy and paste rather than typing in your keys and values.
To use the Request/Response filters:
1. | Expand the Request/Response panel. |
2. | Set your Request/Response filters as follows: |
Fields | Description |
---|---|
Request Key | Use this field to search for a specific request key. You'll find request keys in the request body of the API call. You'll need to filter using data. in your request key. For instance, data.companyName. |
Request Value | Use this field to filter the request value that links to the request key of the API call. |
Response Key | Use this field to search for a specific response key. You'll find response keys in the response body of the API call. You'll need to filter using data.resolved in your response key. For instance, data.resolved.status. |
Response Value | Use this field to filter the response value that links to the response key of the API call. |
NOTE In the image below, you can see placeholder values appear in each field to help guide you.
3. | Click Apply Filters. |
Miscellaneous Filters
The Miscellaneous filter lets you narrow the log to a specific user or submission. Like the Request/Response filter, these fields are text fields. You'll want to make sure you check your spelling for this filter. We suggest doing a copy and paste rather than typing in your data.
The 4 parts of this filter are the following:
Fields | Description |
---|---|
Submission ID | Complete this field using the submission ID of your API call. You'll find this information in the DevTools Console after you run your Plug-In. |
User ID | Use this field to filter your service logs to a specific creator. For this filter to work correctly with Unqork employee login credentials, you'll prefix the User ID with unqorksuite_. For instance, you'll enter unqorkgsuite_first.last@unqork.com to find an Unqork employee User ID. |
Component | Use this field to filter by the component executing the API call. |
URL | Use this field to filter by a portion of the module ID your call lives in. Every call that includes that portion of your module ID will populate in the Logs table. |
To use the Miscellaneous filters:
1. | Expand the Miscellaneous panel. |
2. | Fill our your Miscellaneous filters as you choose. The image below filters for a specific submission ID. |
3. | Click Apply Filters. |
Navigating the Logs Table
To view the details of an API call, you'll use the Logs table. By default, and on entry into the tool, the Logs table shows 10 entries. On each button-press of the Load More button, the Logs table shows another 10 entries. After showing all entries, we remove the Load More button. Returning to the top of the Logs table is quick and easy using the Back to Top button.
Let’s look at what you'll see in the Logs table:
Columns | Description |
---|---|
Type | In this column, you’ll find the service type of the API call: service or remoteExecute. Using the arrows to your header's right, you can sort the column by ascending (A-Z) or descending (Z-A) order. Ascending is the default order applied. |
Code - Text | Shows the response code and its associated text. Using the arrows to your header's right, you can sort the column by ascending or descending order. Ascending is the default order applied. |
Date Time | Each time an API call occurs, the Unqork Service Logs will date and time stamp it. Using the arrows to your header's right, you can sort the column by ascending or descending order. Ascending is the default order applied. UTC is the timezone for this tool. |
Duration (ms) | Shows the time between the call's request and response. Using the arrows to your header's right, you can sort the column by ascending or descending order. Ascending is the default order applied. The unit of measurement used for Duration is milliseconds (ms). |
User | Shows the User ID for the creator of the API call. Using the arrows to your header's right, you can sort the column by ascending or descending order. Ascending is the default order applied. |
Service / Module | Shows the module ID of your API call. The column also shows the execution method of the API call. For example, if the call is a GET or PUT. Using the arrows to your header's right, you can sort the column by ascending or descending order. Ascending is the default order applied. |
The following image highlights the logs table:
Navigating Your API Call
Now that we’ve examined the information in the Logs table, let’s explore your call in more detail.
Opening a Service Log Review Modal
To open the Service Log Review pop-up modal:
1. | Use the Filters to find the API call that you'd like to view. |
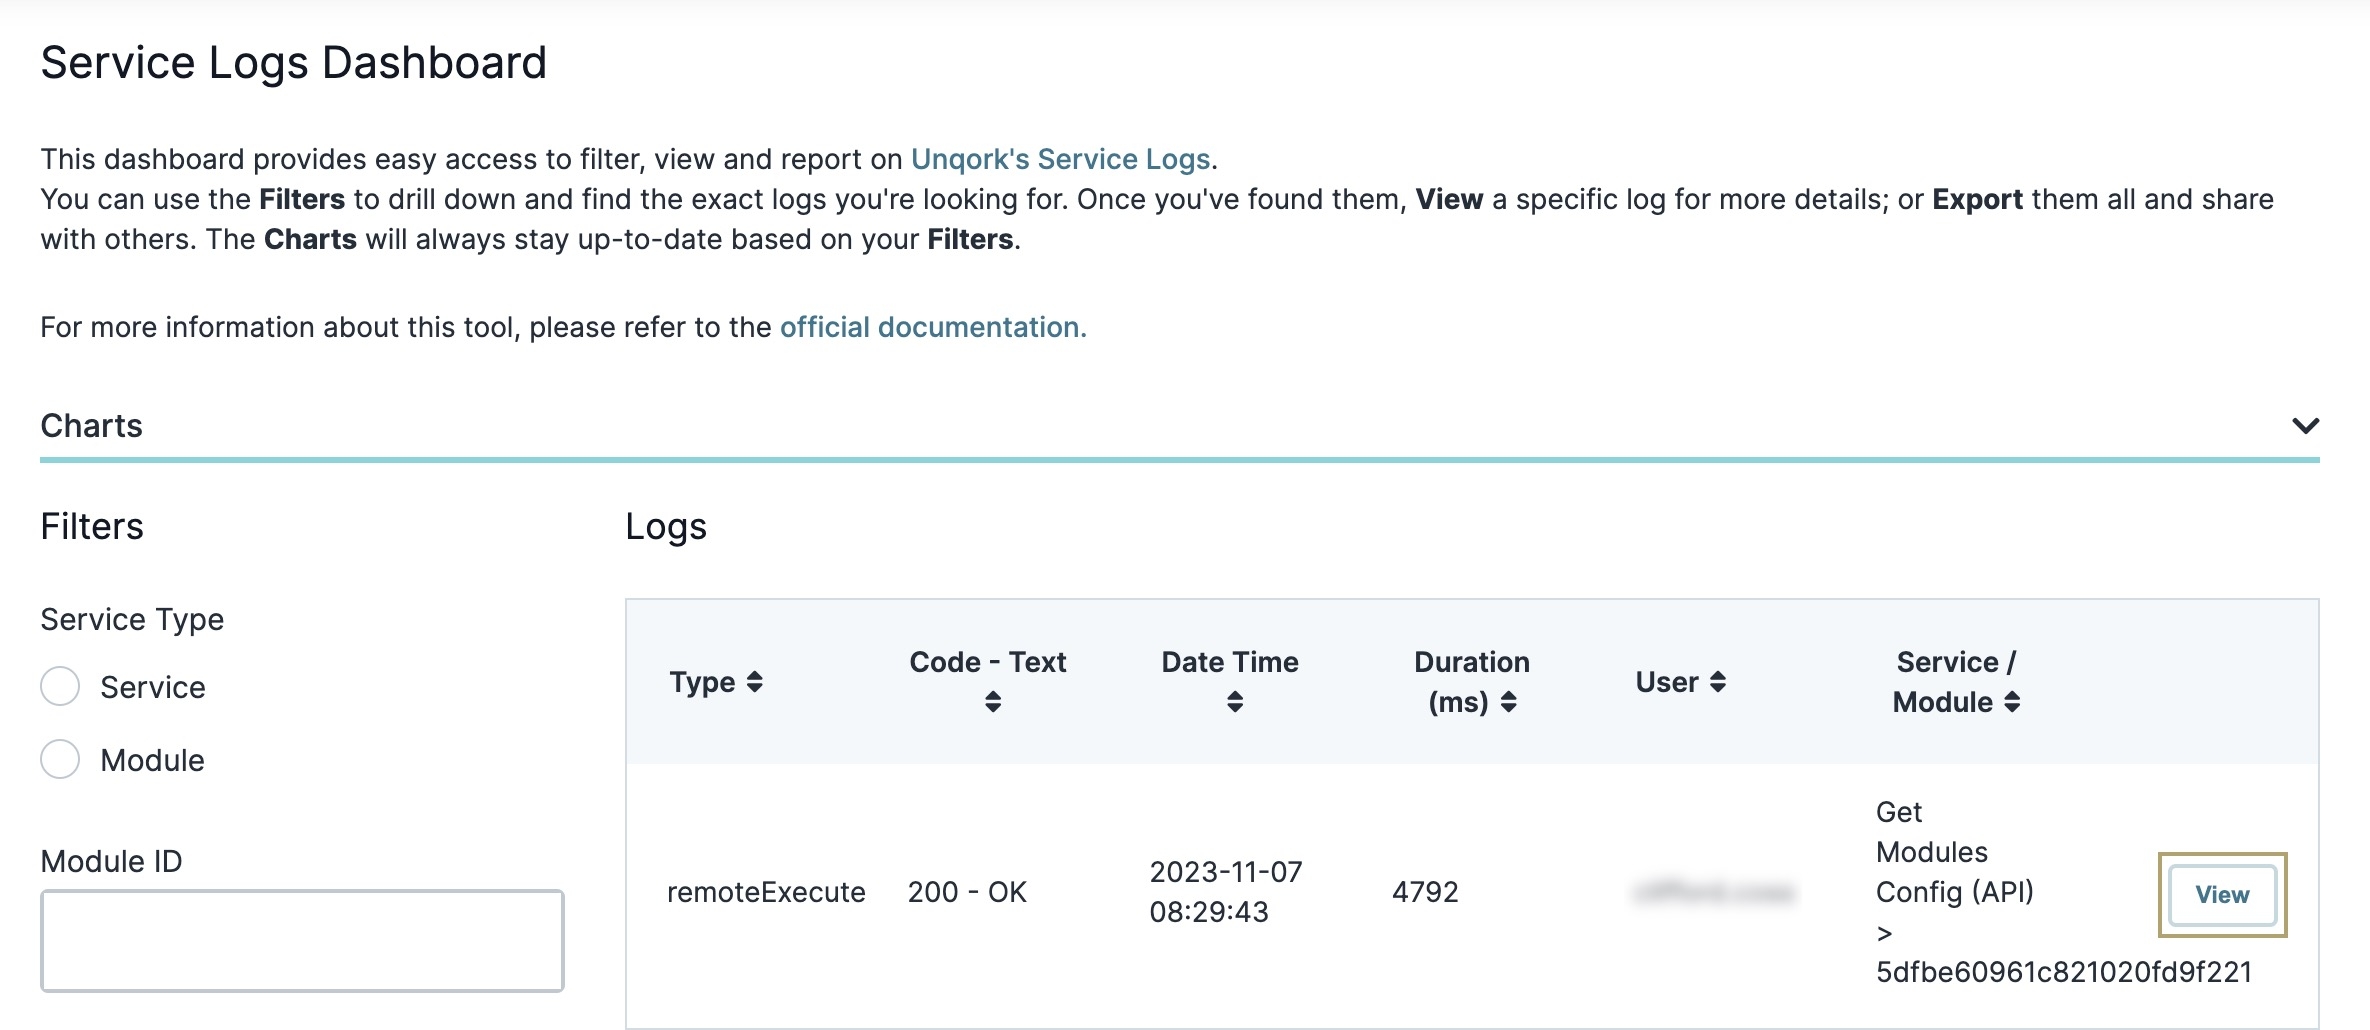
2. | Click the View button to the far right of your Logs table entry. This opens the Service Log Review pop-up modal. From here you’ll see every category that you saw in the Filters section of the tool. |
Viewing the Request and Response Body for a Remote Execute API Call
When you view a Remote Execute API call, you’ll see the JSON request and response of that call. At the bottom of the pop-up modal, you can expand the Request and Response Body panels. The data in these areas is the same as you’d find using DevTools Console to inspect your module. This is a great feature because it lets you see all the information relating to your API and module in one place.
At the bottom of the pop-up, you’ll find the View Module in Designer link. This link takes you directly to your API call's associated module.
Clicking the (X) at the top-right side of the pop-up returns your focus to the Logs table.
Viewing the Request and Response Body for a Service API Call
Now, to view the Request Body and Response Body data for a Service API call, you'll first turn on the Capture Response & Request Bodies setting. You'll find this setting in Services Administration. You only need to do this once for a module to access the Request Body and Response Body data for your Service API call.
Capturing the Response and Request Body
To capture response and request bodies:
1. | Click the Settings drop-down at the top right corner of the Unqork Designer Platform. |
2. | Click Administration. |
3. | Under Integration, click Services Administration. |
4. | Under Logging, check the Capture Response & Request Bodies checkbox. |
Viewing the Request and Response Body
1. | Return to the Service Logs Dashboard and click the View button to the far right of your chosen Logs table entry. |
2. | Expand the Request Body and Response Body panels. |
3. | Click the ![]() |
Navigating the Charts Panel
Above the Logs table, you'll see the Charts panel. If you click on and expand the Charts panel, you’ll see 4 graphs. These graphs plot the API calls that appear in the Logs table. So, if your Logs table shows 10 entries, you'll see data plotted for those 10 entries. To add more entries, you'll click the Load More button and your graphs will update automatically. These graphs include:
Graph | Description |
---|---|
Services/Modules | This graph plots the number of times the tool counts a Service/Module in the Service Logs table. |
Response Codes | This pie chart shows the percentage of response codes in the Logs table. |
Requests x Time | This line graph plots API requests versus time. To the right of the graph, you can choose if you want to plot the time in minutes, hours, or days. |
Performance x Time | This line graph plots the performance of the API requests versus time. To the right of the graph, you can choose if you want to plot the time in minutes, hours, or days. |
Below is an example of what your charts might look like:
Exporting and Sharing Your Data
The last feature of the Service Logs Dashboard tool makes exporting and sharing your data easy. Not only can you pick and choose what data you want to export or share, but you get to pick how. Let's take a look.
Exporting the Logs Table
You'll remember that the Logs table defaults to 10 entries. These entries result from every API call made in your application. To narrow the records you'll see, you can apply various filters. To see more rows, you'll click the Load More button. Once you have the Logs table loaded and displayed to your needs, you're ready to export your data. Your data exports as an Excel-type file. Your file includes a table with the following headers:
Created
Expired
Method
Modify
Module ID
Name
Request Time
Response Time
Response Code-Text
Type
Submission ID
Component
Duration (ms)
User
Request Body
Response Body
To export your Logs table:
1. | Click Excel Download at the end of the Logs table. |
2. | Check your Downloads folder for the Content Export.xlsx file. |
3. | Double-click the Content Export.xlsx file to open the file in Excel. |
In Excel, you can manipulate your data as needed to create more charts and graphs.
Exporting and Sharing Chart Data
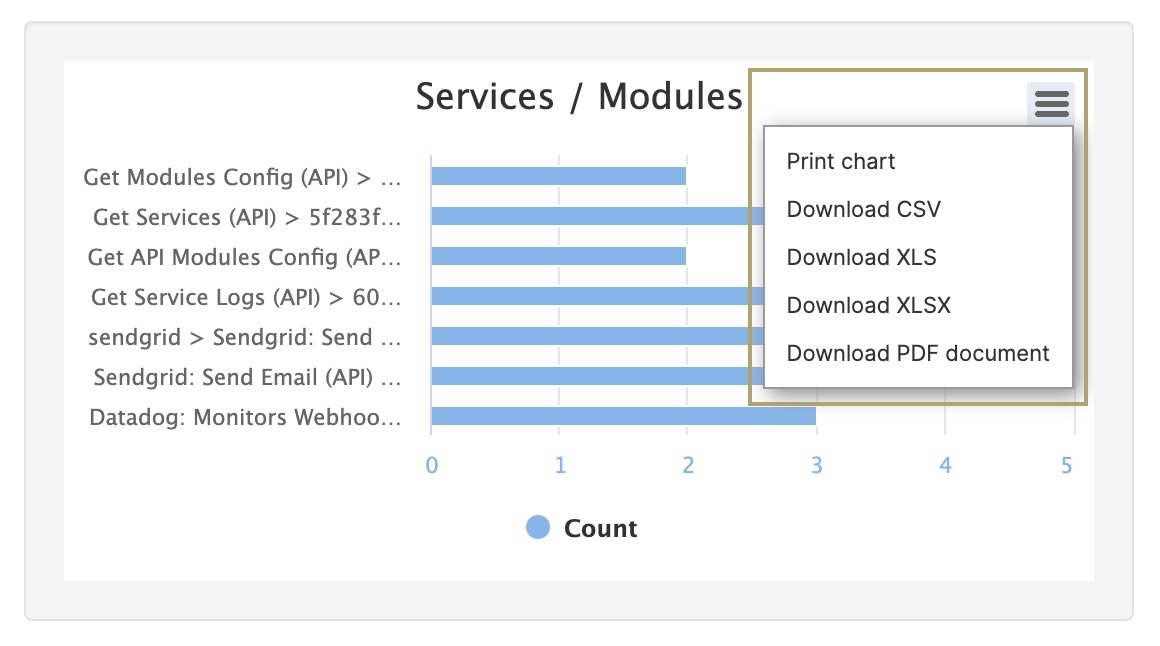
When you expand the Charts panel, you’ll notice a hamburger button () at the top right of each chart widget. When you click on this button, you get the following options:
Print chart
Download CSV
Download XLS
Download PDF document
Let's look at each of these in more detail.
Print Chart
The Print Chart option lets you print data from each chart.
To print a chart:
1. | Click the ![]() |
2. | Select Print Chart. |
3. | At the print dialog, set your Destination: |
a. | Save as PDF. |
b. | A connected printer device. |
4. | Set the Layout as Portrait or Landscape. |
5. | Under More Settings, set the Scale as either Default or Custom. The Custom option lets you adjust the chart size to fit the full page. |
6. | Click Save/Print. The button updates based on your Destination selected earlier. |
Download CSV
A CSV (comma-separated values) file is a plain text file that contains a list of data.
To download your chart as a CSV file:
1. | Click the ![]() |
2. | Select Download CSV. |
3. | Check your Downloads folder for the .csv file. Your file name is similar to that of the chart name. For example, the Services/Modules chart downloads as service-module.csv. |
Download XLS
XLS is a file extension created by Microsoft for use with Microsoft Excel.
To download your chart as an XLS file:
1. | Click the ![]() |
2. | Select Download XLS. |
3. | Check your Downloads folder for the .xls file. Your file name is similar to that of the chart name. For example, the Services/Modules chart downloads as service-module.xls. |
Download PDF Document
PDF stands for Portable Document Format. Using this format prevents modification of your chart file while still allowing sharing and printing.
To download your chart as a PDF file:
1. | Click the ![]() |
2. | Select Download PDF Document. |
3. | Check your Downloads folder for the .pdf file. Your file name is similar to that of the chart name. For example, the Services/Module chart downloads as service-module.pdf. |