The Config Analysis Dashboard tool helps Creators resolve complex issues that occur as they build in the Unqork Designer Platform. With this tool, Creators submit a configuration report so Unqork can provide feedback on in-progress application builds.
The Unqork team runs multiple tests on your configuration, suggesting possible improvements. Unqork also sends a detailed report of the tests, so you avoid similar configuration issues in the future. Upload your report to the Config Analysis Dashboard tool to filter and organize your information with ease. The tool includes various charts as visualization aids and KPI widgets to print, export, and share test results.
Config Analysis requests are sent to an Unqork team that performs a detailed analysis of your configurations. This tool does not return the analysis in real time. Expect to receive the results in one to two days.
Discover how to access the UDLC Toolkit in our Introduction to the Unqork Development Life Cycle Toolkit article.
To learn more about the Config Analysis Dashboard tool, click on each tab below:
Submitting a Config Analysis Request
The first step is to submit a Config Analysis Request. After receiving your request, Unqork reviews your module or application configuration to ensure it meets Unqork's best practices.
To submit a module or application for analysis, click + Request New Analysis.
Next, you'll choose what you want to submit for review. Your options include:
All Applications in the Environment: Choosing this option submits all applications in your current environment for review. It's important to note that this could potentially be a lot of data to analyze.
Specific Applications: Choosing this option displays the Applications drop-down menu. Use this drop-down to select specific applications in your environment. You can choose as many applications as needed.
Specific Modules: Choosing this option displays the Modules drop-down menu. Use this drop-down to select specific modules in your environment. You can choose as many modules as needed.
After you've made your selection(s), click Submit.
Click OK in the pop-up modal.
Another pop-up modal displays your Request Number. Use this number anytime to view the details and status of your request in the Config Analysis Dashboard.
Filtering the Config Analysis Dashboard
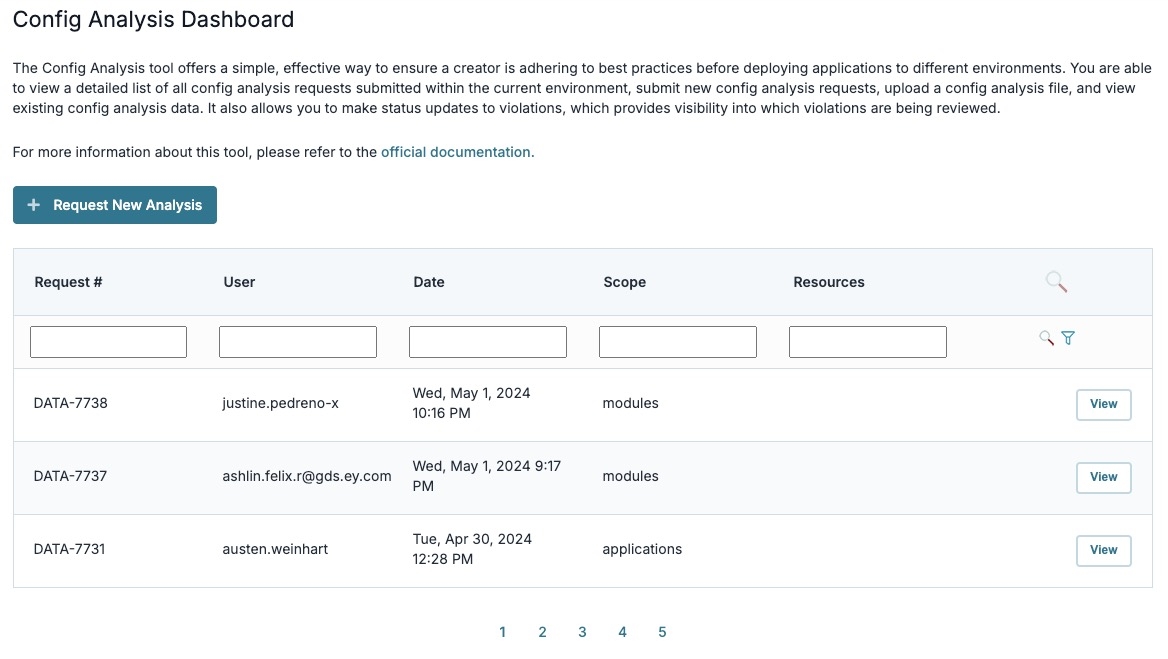
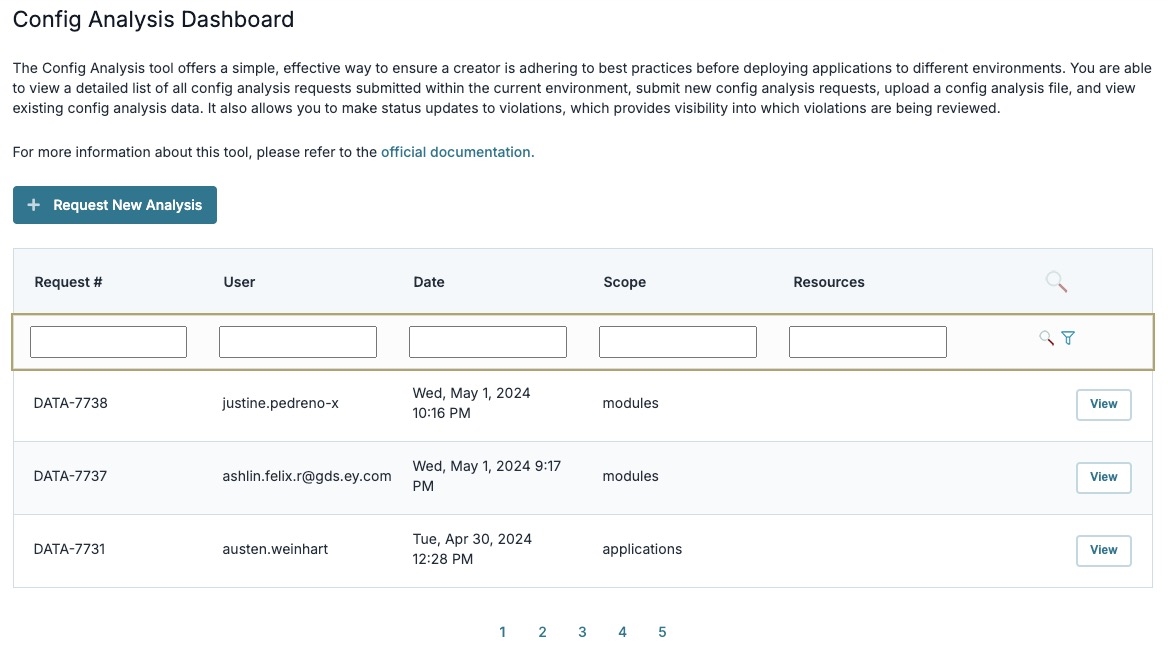
The Config Analysis Dashboard is where you'll find all your requests. As you continue to build applications, the number of requests will increase. But only ten requests display per Dashboard page. Click the pagination buttons below the table to see more. Or, to make it easier, you can use the dashboard's filters to help you find a specific request. You can use any or all of these filters, depending on how specific you want to be. As you enter text into the fields, the result displays automatically. To clear all fields, click the funnel icon to the far right.
Let’s take a look at the available filters:
Filter | Description |
|---|---|
Request # | This is the Request Number you receive after submitting your request. The typical format of the number is: DATA-####. |
User | The person who submitted the request. |
Date | The date the request was submitted. |
Scope | Use this filter to find requests that analyze either:
|
Resources | The specific modules or applications added to the request. |
Uploading Your Config Analysis Report
After submitting a request, you'll receive an email with an attached spreadsheet called Config Analysis {your-environment} {timestamp in UTC}.xlsx. This spreadsheet is your analysis report. You'll upload this spreadsheet to the Config Analysis Dashboard to organize the request information. Download and save this spreadsheet to your computer to make it easier to locate and upload.
To upload your spreadsheet file:
Access the Config Analysis Dashboard tool.
Use the Config Analysis Dashboard's filters to find your request.
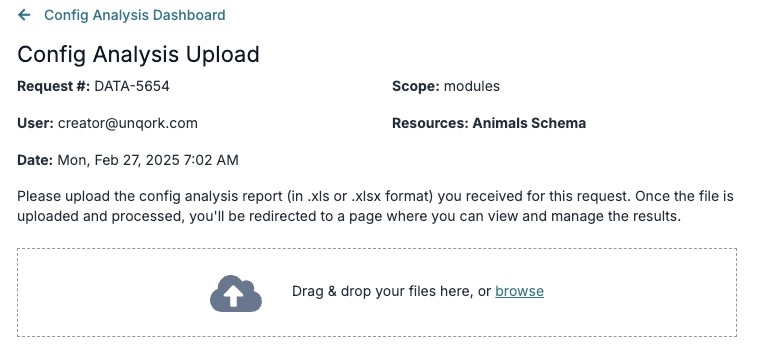
Click the View button to the right of your request. Doing so opens the Config Analysis Upload Dashboard.
Drag and drop your spreadsheet file onto the Config Analysis Upload Dashboard. Or, use the dashboard's Browse option to upload your file.
The format of your file must be .xls or .xlsx to successfully upload to the dashboard.
After the upload is complete, a new page opens displaying the Config Analysis Details page. You'll see all the detailed test results of your request.
After you've uploaded your spreadsheet, you do not have to do it again. When you view that request from the Config Analysis Dashboard, it opens directly in the Config Analysis Details page.
Navigating the Config Analysis Details Page
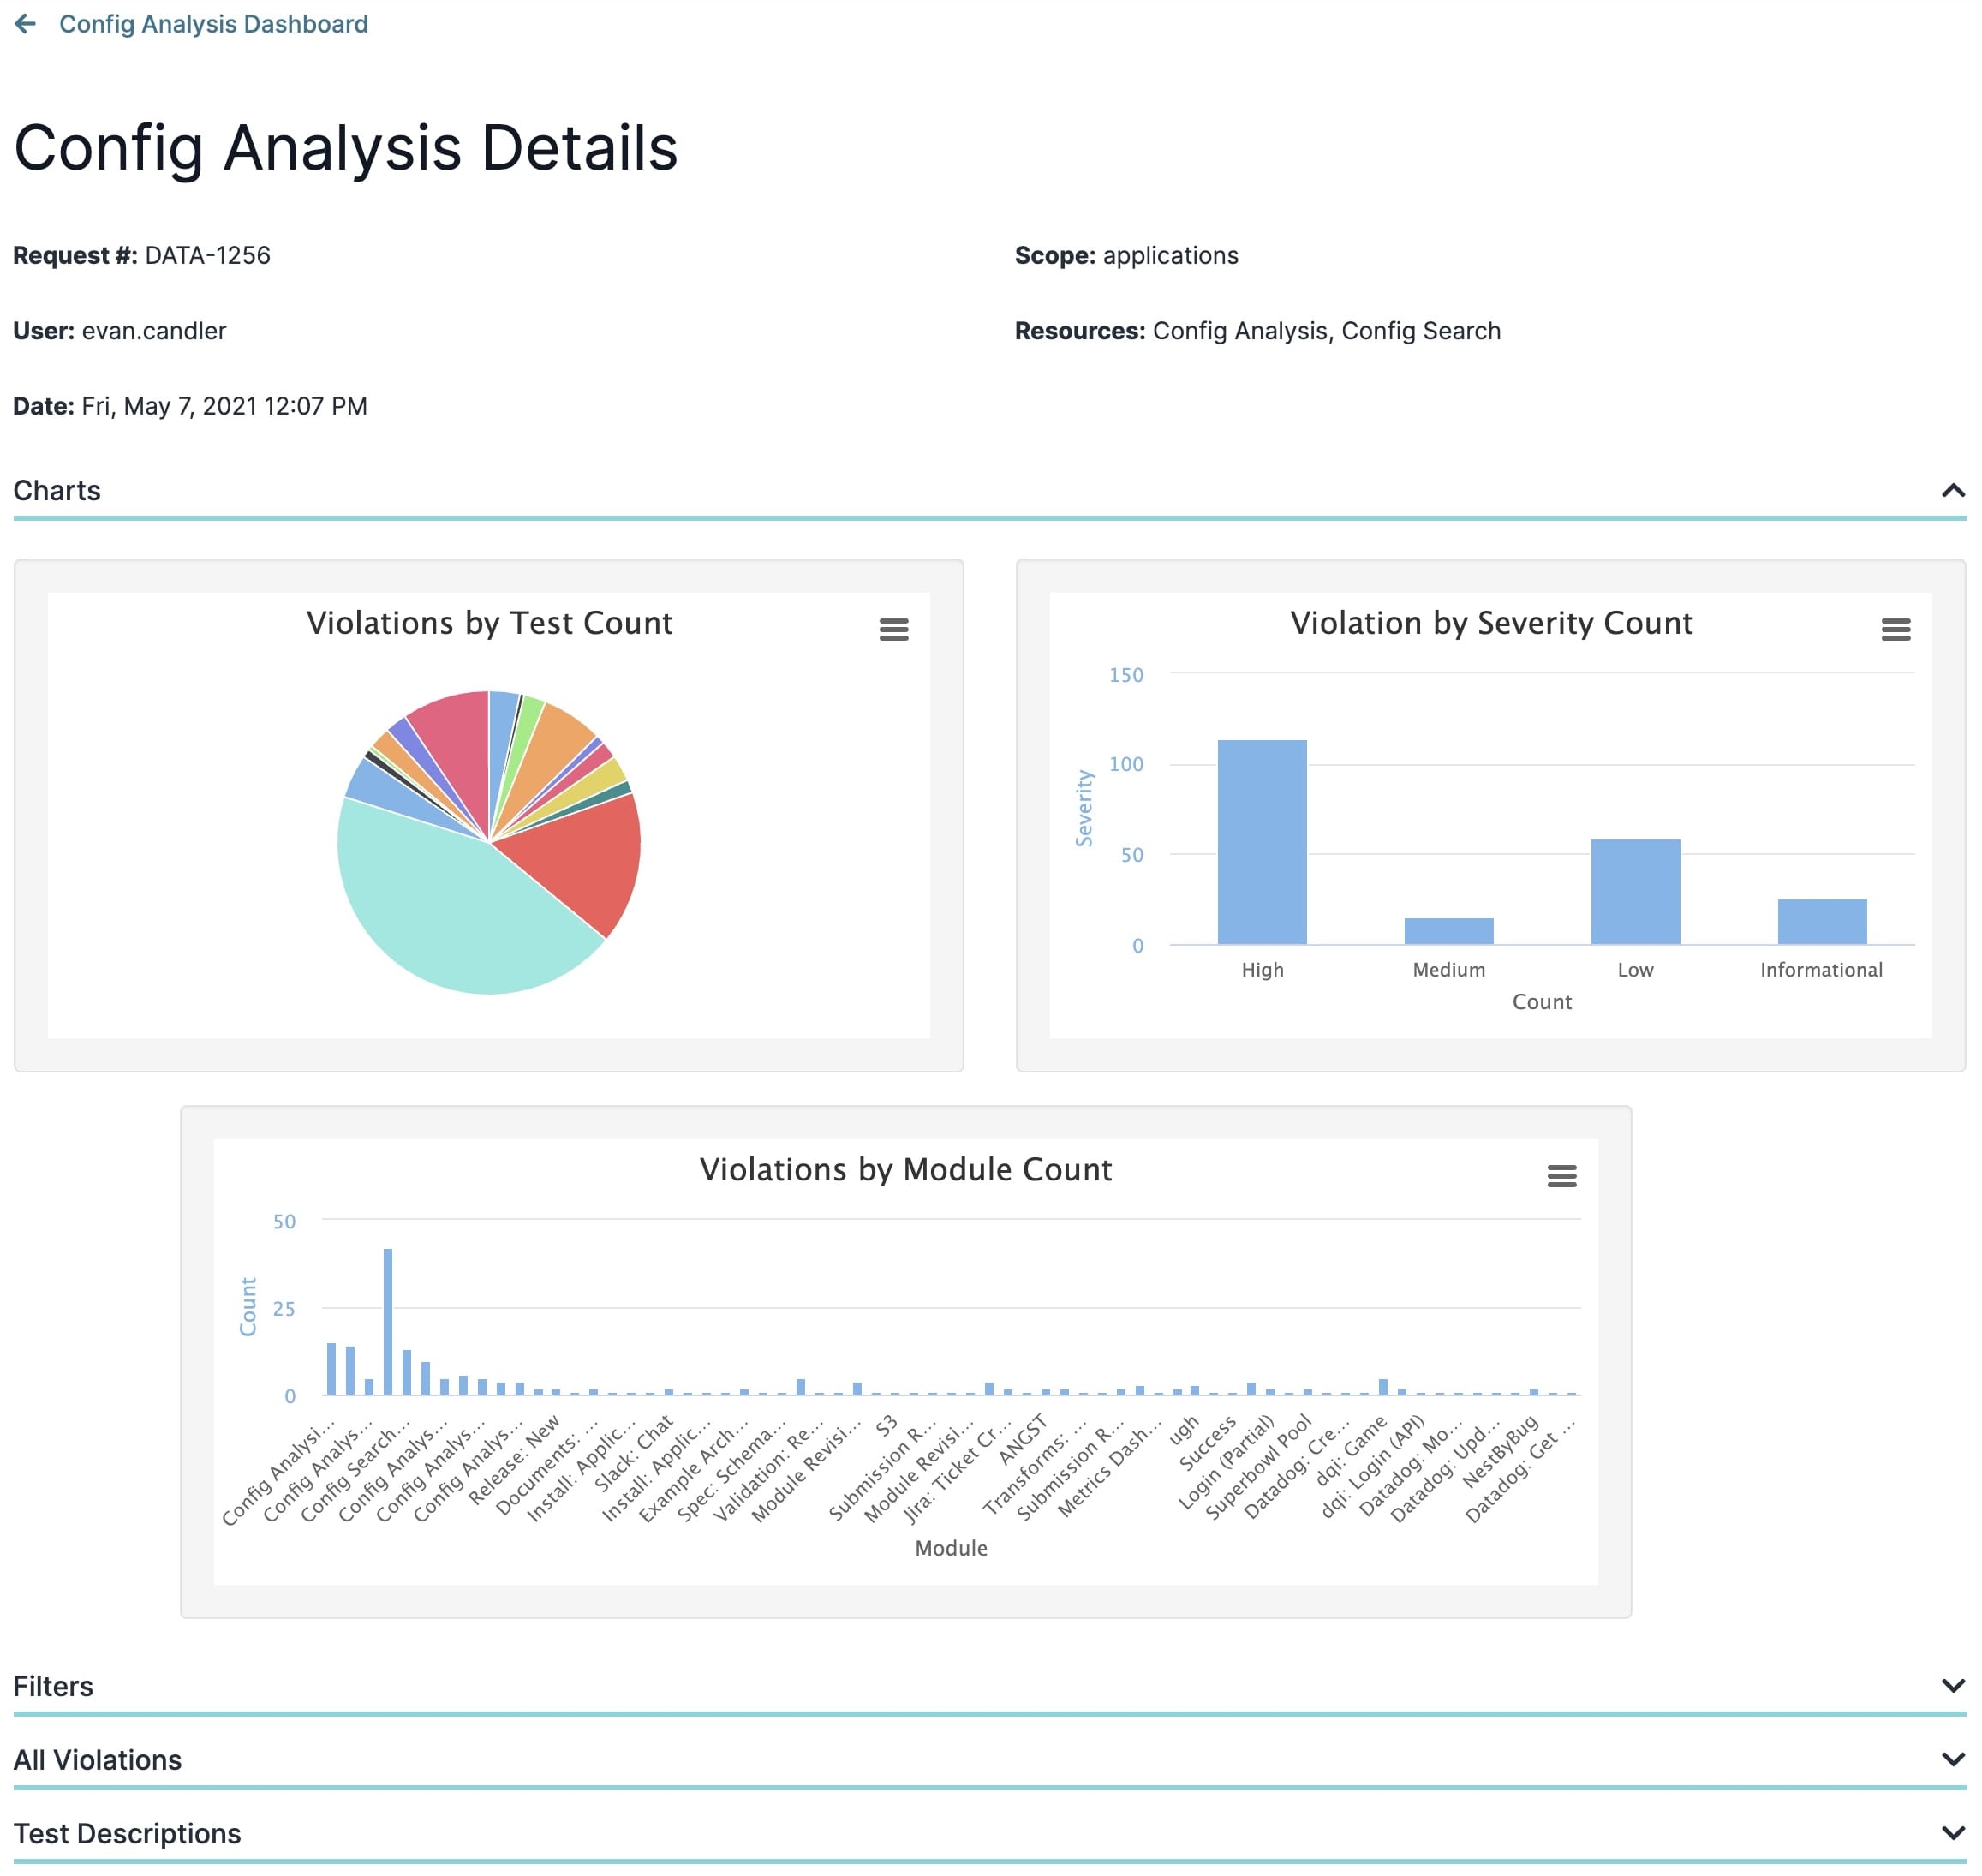
The Config Analysis Details page displays the test results for your request. The top of the page displays the basic information about your request:
Request #
User
Date
Scope
Resources
The dashboard also includes panels that let you view, filter, and share the results of the report. These panels include:
Charts
Filters
All Violations
Test Descriptions
Here's an example of a report in the Config Analysis Details page:
Let's look at each of these panels in more detail.
Navigating the Charts Panel
Expand the Charts panels to view all the test violations of your modules and applications. Violations are configurations that do not follow Unqork's best practices. You'll see that violations include severity types. The higher the severity, the greater the risk of issues occurring in your application.
Below are the charts you'll see in this panel:
Chart | Description |
|---|---|
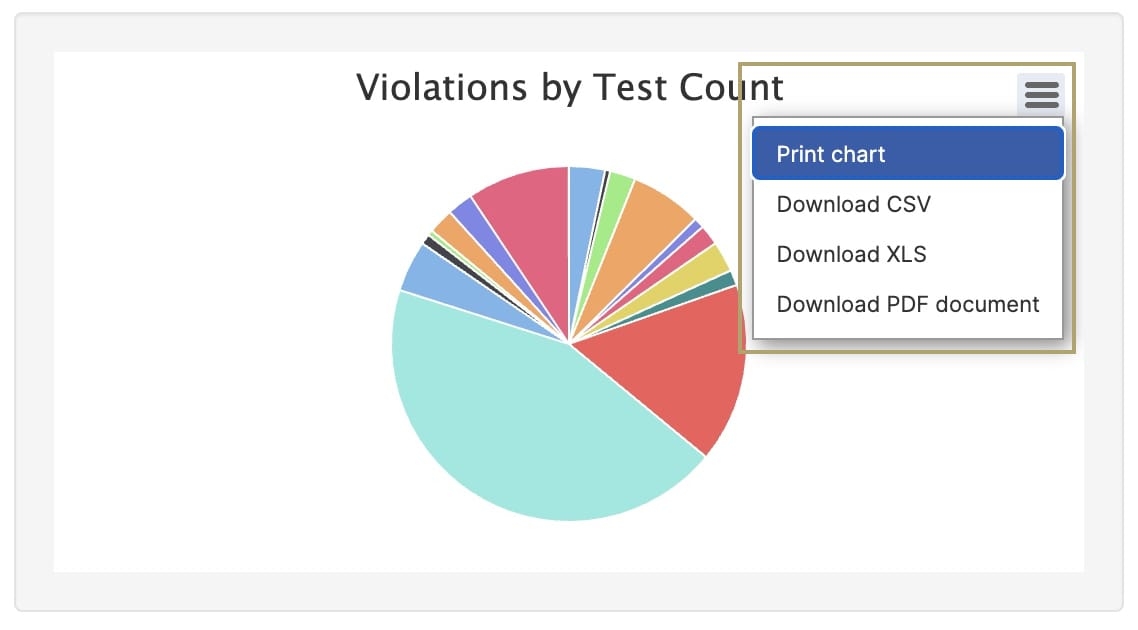
Violations by Test Count | This pie chart displays the number of violations per test. Hover over a section of the chart to see the test it represents, and the number of violations. |
Violations by Severity Count | This bar graph displays the number of violations per severity type. The different types of severities include:
|
Violations by Module Count | This bar graph displays the number of violations per module. |
One of the key features of these charts is that you can print and export them to share with your team. When you expand the Charts panel, you’ll notice a (Hamburger) button at the top right of each chart widget. When you click on this button, you see the following options:
Print chart
Download CSV
Download XLS
Download PDF document
Let's look at each of these in more detail.
Print Chart
The Print Chart option lets you print data from each chart.
To print a chart:
Click the
.jpg) (Hamburger) button to the right of the chart.
(Hamburger) button to the right of the chart.Select Print Chart.
At the print dialog, set your Destination:
Save as PDF.
A connected printer device.
Set the Layout as
PortraitorLandscape.Under More Settings, set the Scale as either Default or Custom. The Custom option lets you adjust the chart size to fit the full page.
Click Save/Print. The button updates based on the Destination selected previously.
Download CSV
A CSV (comma-separated values) file is a plain text file that contains a list of data.
To download your chart as a CSV file:
Click the
.jpg) (Hamburger) button to the right of the chart.
(Hamburger) button to the right of the chart.Select Download CSV.
Check your Downloads folder for the .csv file. Your file name is similar to that of the chart name. For example, the Violations by Test Count chart downloads as follows:
violations-by-test-count.csv.
Download XLS
XLS is a file extension created by Microsoft for use with Microsoft Excel.
To download your chart as an XLS file:
Click the
.jpg) (Hamburger) button to the right of the chart.
(Hamburger) button to the right of the chart.Select Download XLS.
Check your Downloads folder for the .xls file. Your file name is similar to that of the chart name. For example, the Violations by Test Count chart downloads as follows: violations-by-test-count.xls.
Download PDF Document
PDF stands for Portable Document Format. Using this format prevents modification of your chart file while still allowing sharing and printing.
To download your chart as a PDF file:
Click the
.jpg) (Hamburger) button to the right of the chart.
(Hamburger) button to the right of the chart.Select Download PDF Document.
Check your Downloads folder for the .pdf file. Your file name is similar to that of the chart name. For example, the Violations by Test Count chart downloads as follows: violations-by-test-count.pdf.
Navigating the Filters Panel
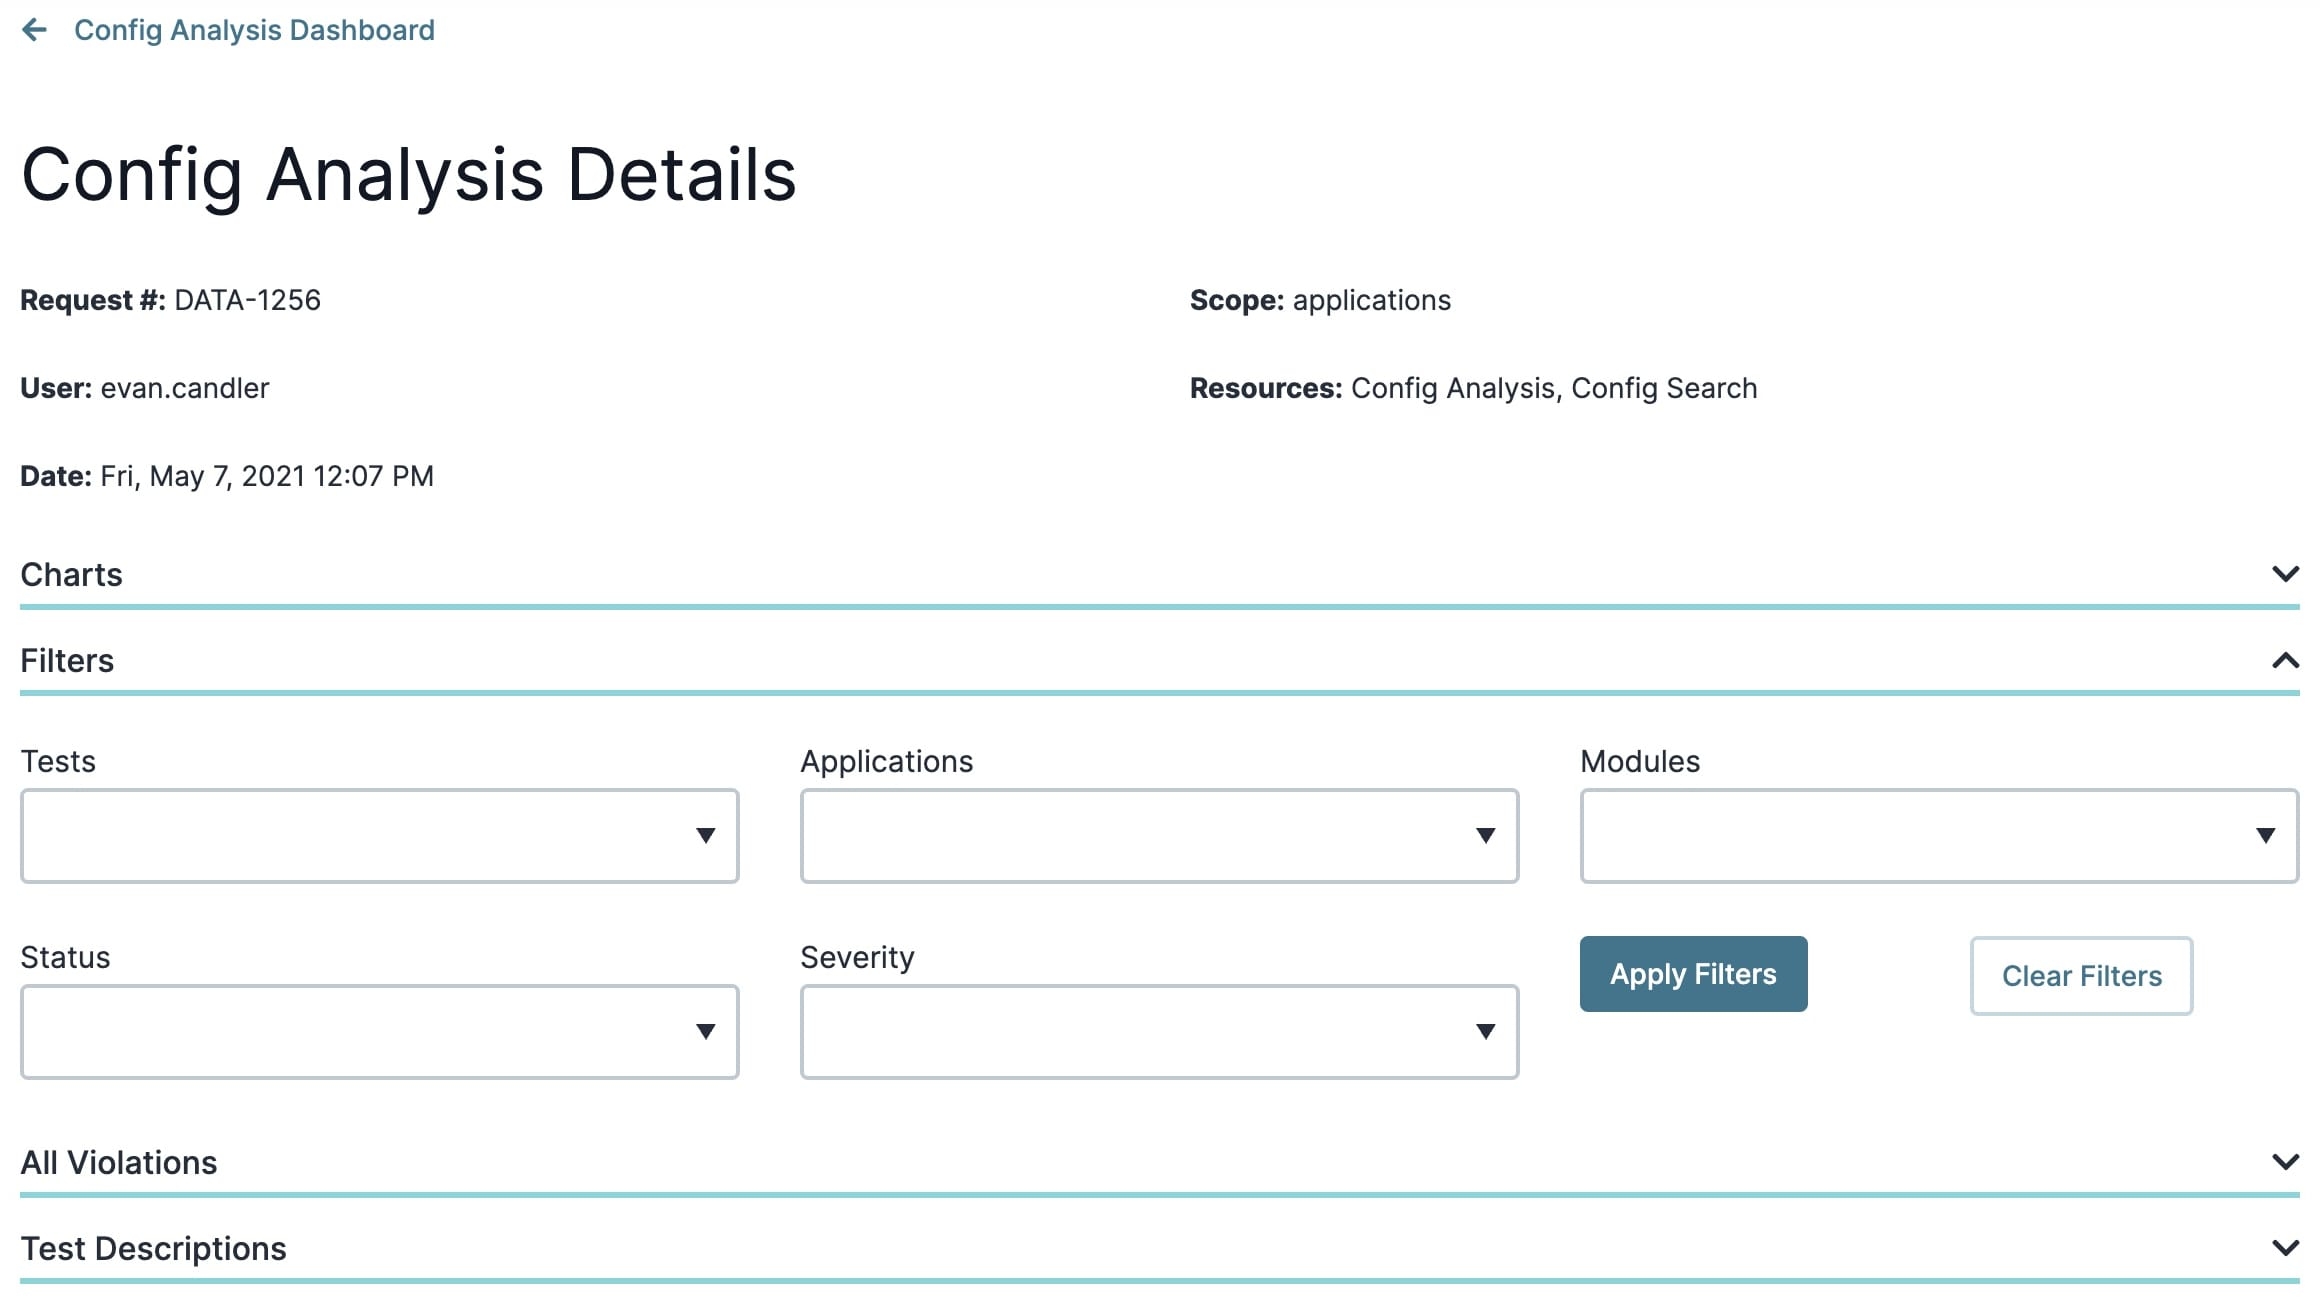
The Filters panel lets you locate specific information about your analysis, like a specific module or test. You can use any or all of these filters as needed.
The image below is how the Filters panel displays when expanded:
These filters include:
Filter | Description | ||||
|---|---|---|---|---|---|
Tests | This filter lets you view a specific test run on your configuration. The test options are specific to your configuration. The different tests might include:
The following Config Analysis tests are excluded from this drop-down menu because they do not apply to best practices:
| ||||
Applications | This drop-down menu lets you filter by application name. | ||||
Modules | Use this drop-down menu to locate a specific module in your application. | ||||
Status | Each violation has a status. The supported status options you can filter by include:
| ||||
Severity | Each violation has a severity associated with it. The higher the severity, the worse the practices are in the configuration. The different severity types include:
| ||||
Apply Filters | Click this button to apply the filters you've selected. | ||||
Clear Filters | Click this button to clear all the filters. |
Navigating the All Violations Panel
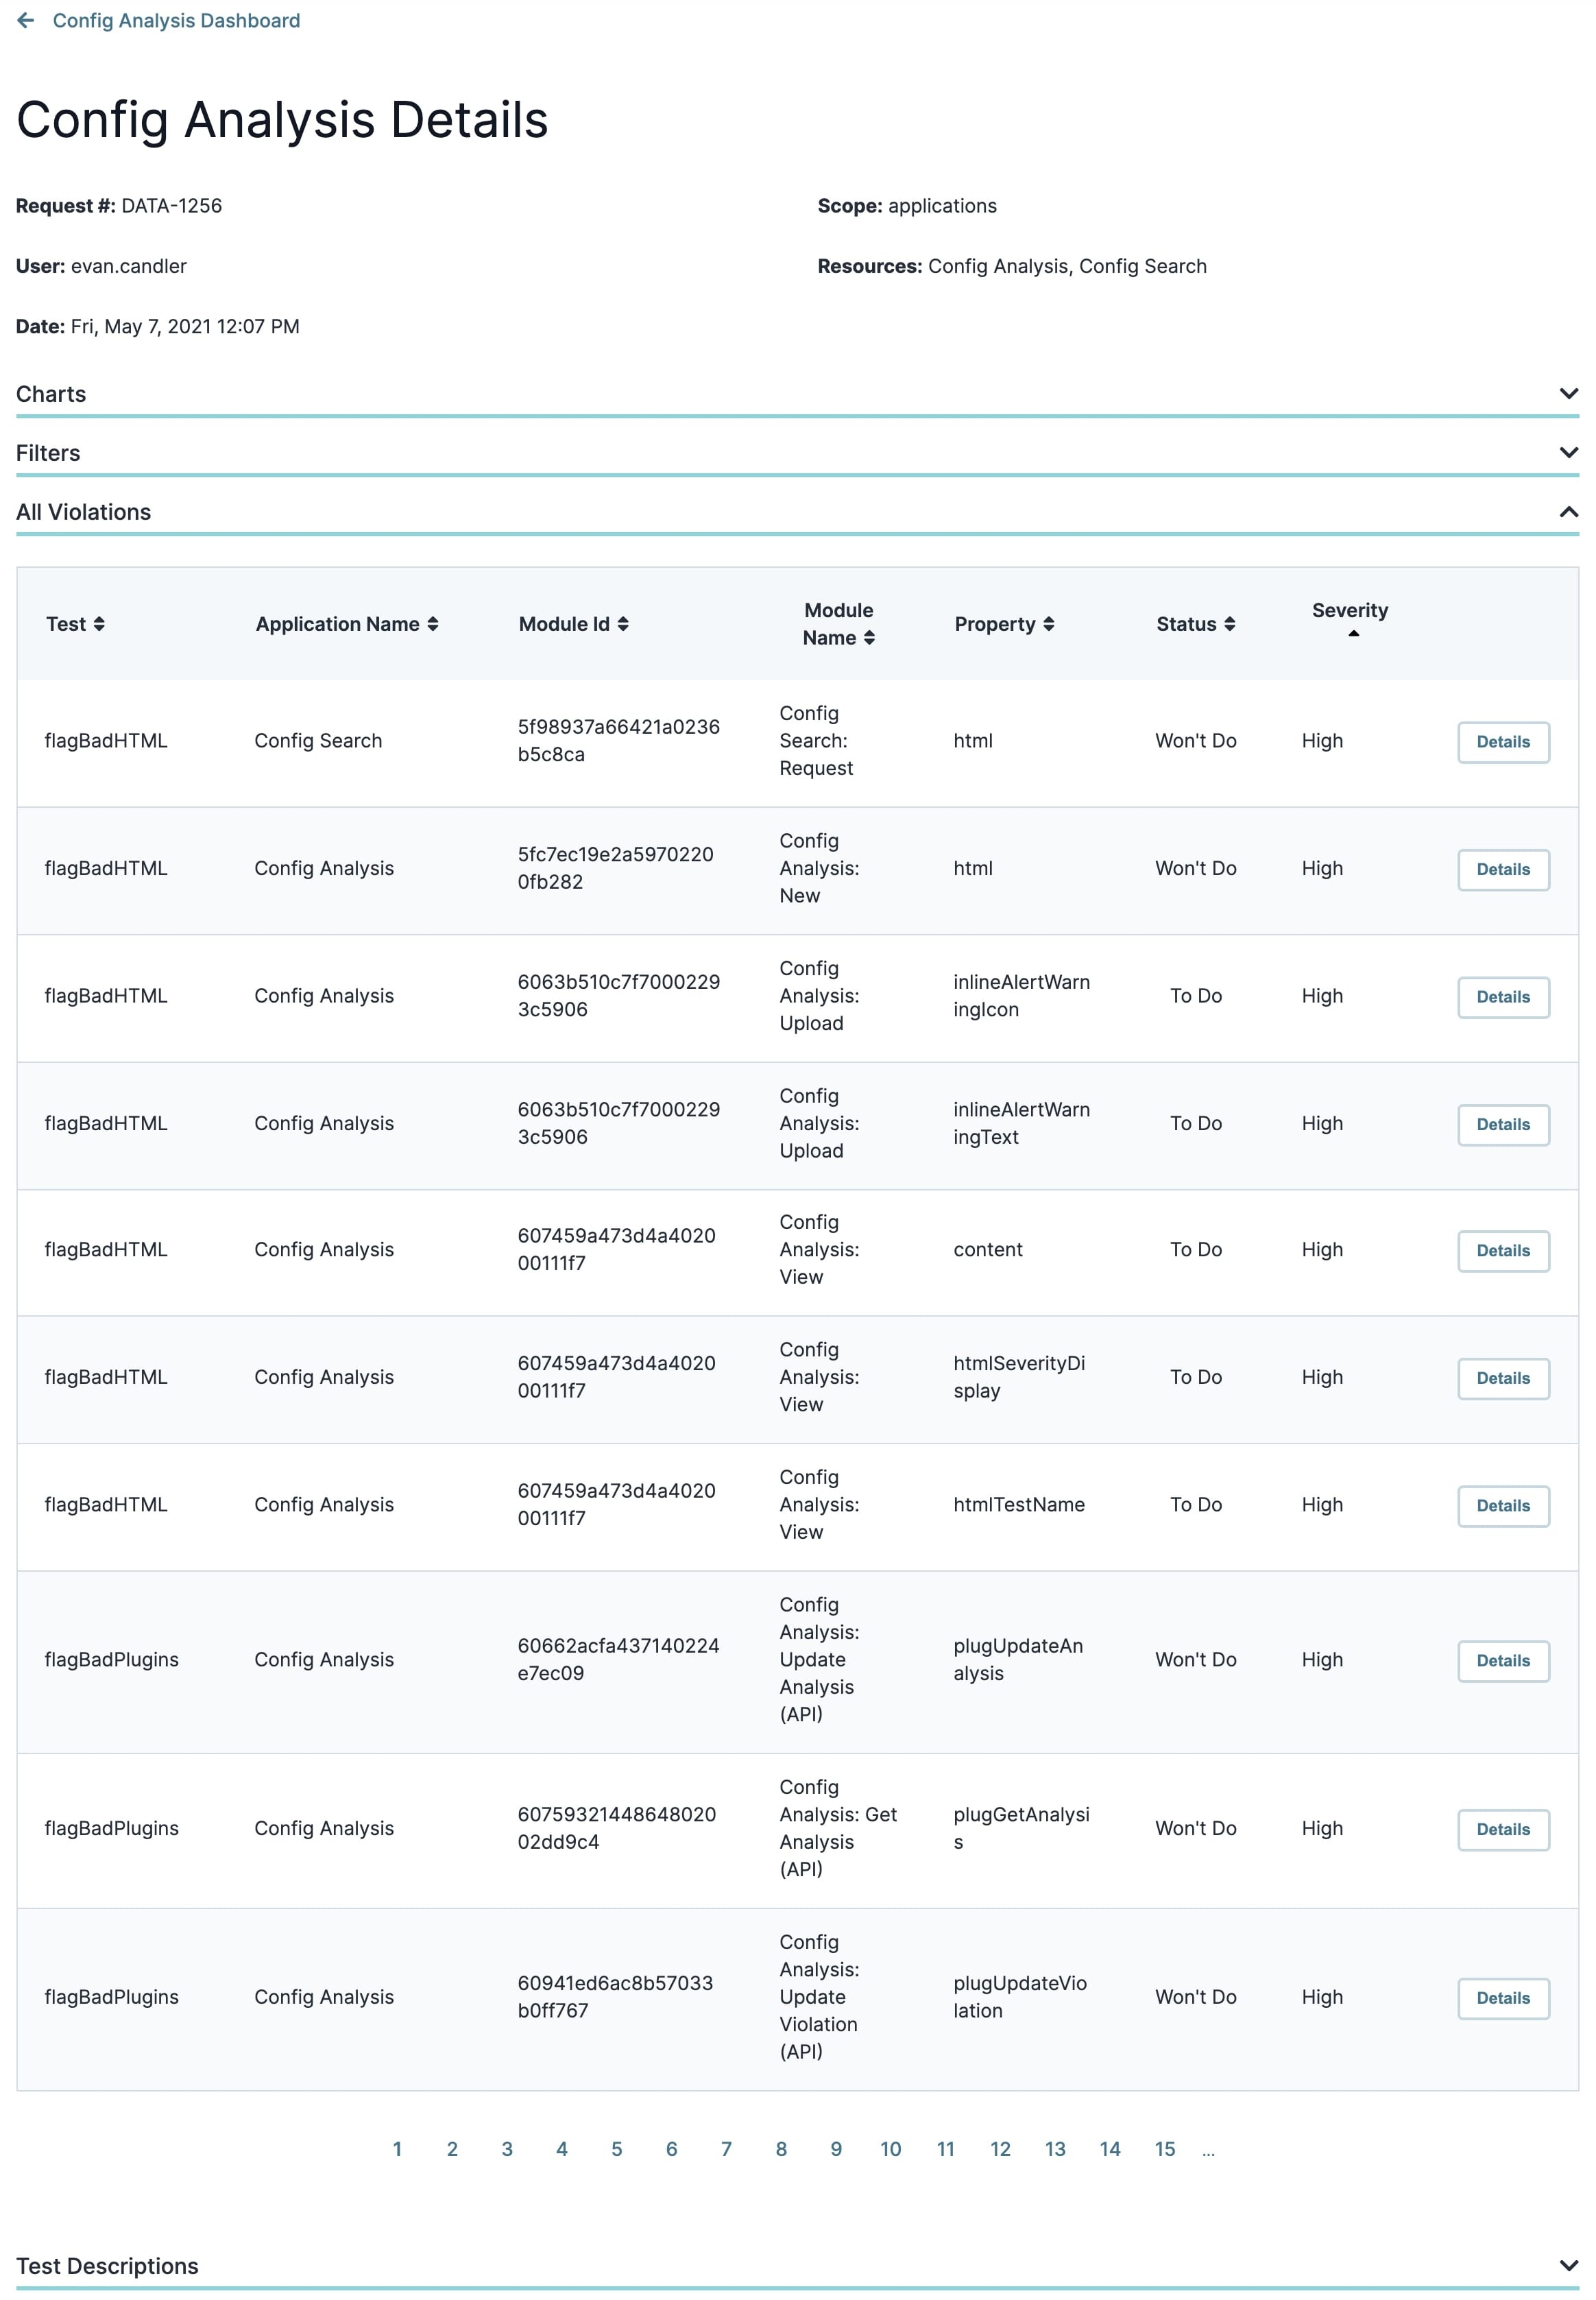
This panel shows all the violations for the individual components of your modules. The table also populates with the selections you made in the Filters panel. By default, the table displays 10 entries. You can click the pagination buttons below the table to see more.
Here's an example of how the All Violations table looks:
Here's what you'll see in the All Violations table:
Attribute | Description |
|---|---|
Test | The specific test run on this module's component(s). |
Application Name | The name of the application where the component exists. |
Module ID | The unique identifier of the component's associated module. |
Module Name | The name or title of the component's associated module. |
Property | The Property ID of this specific component. |
Status | The current status of the violation. Statuses include the following:
|
Severity | The severity of the violation. Severity types include:
|
Viewing a Component's Violation
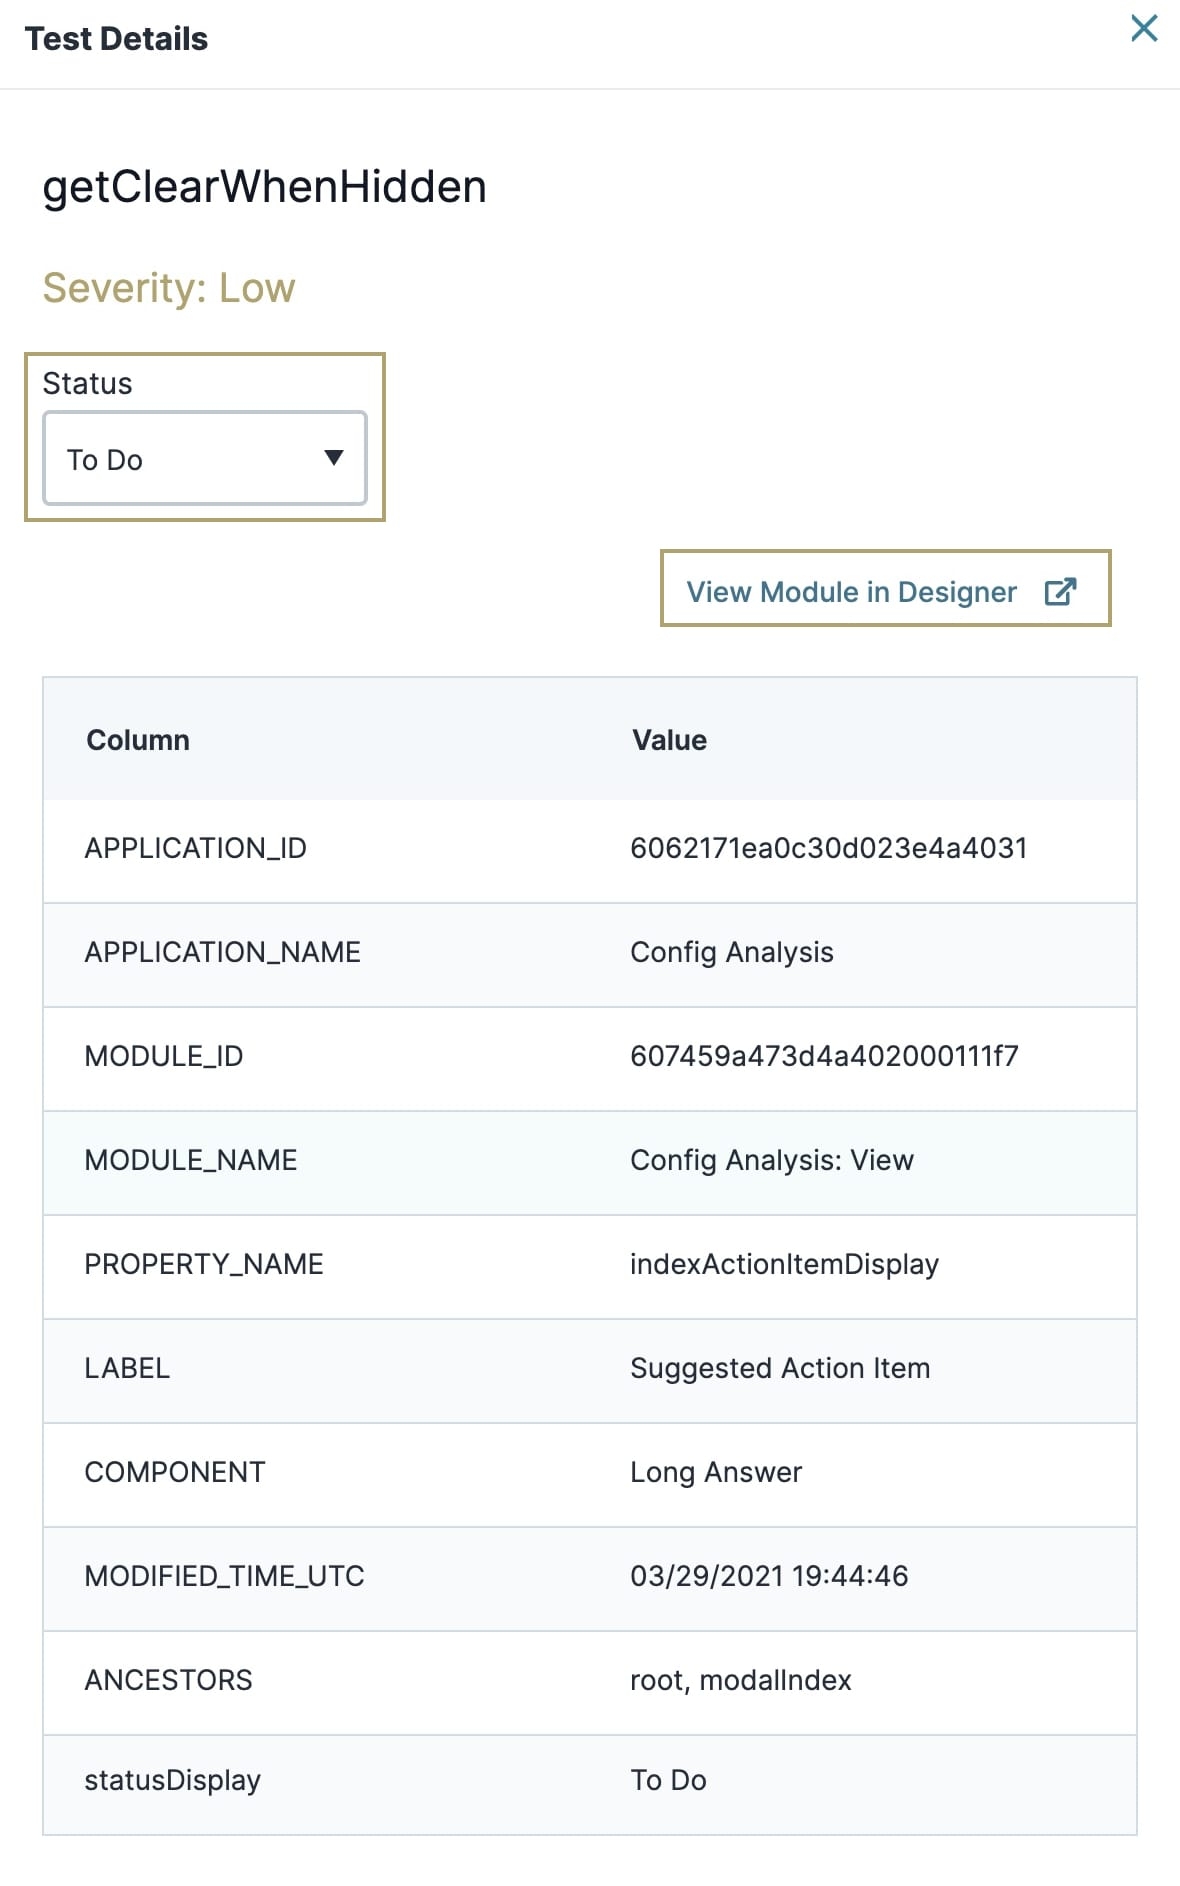
After you've located a violation to review, click the Details button to the right of it. A pop-up modal displays with the following information:
The test name.
The violation's severity.
The violation's status
A link to the module in the Module Builder.
Use the Status drop-down menu to update the progress of the violation.
The modal also displays a table of detailed information. Depending on the test and the component, you'll see differing information. The most common information is the following:
Application ID
Application name
Module ID
Module name
Component's property name
Modified time (UTC) and date
Component's ancestors
Violation status
By default, the table displays 10 entries. Click the pagination buttons below the table to see more.
Here's an example of what information you might see:
Navigating the Test Descriptions Panel
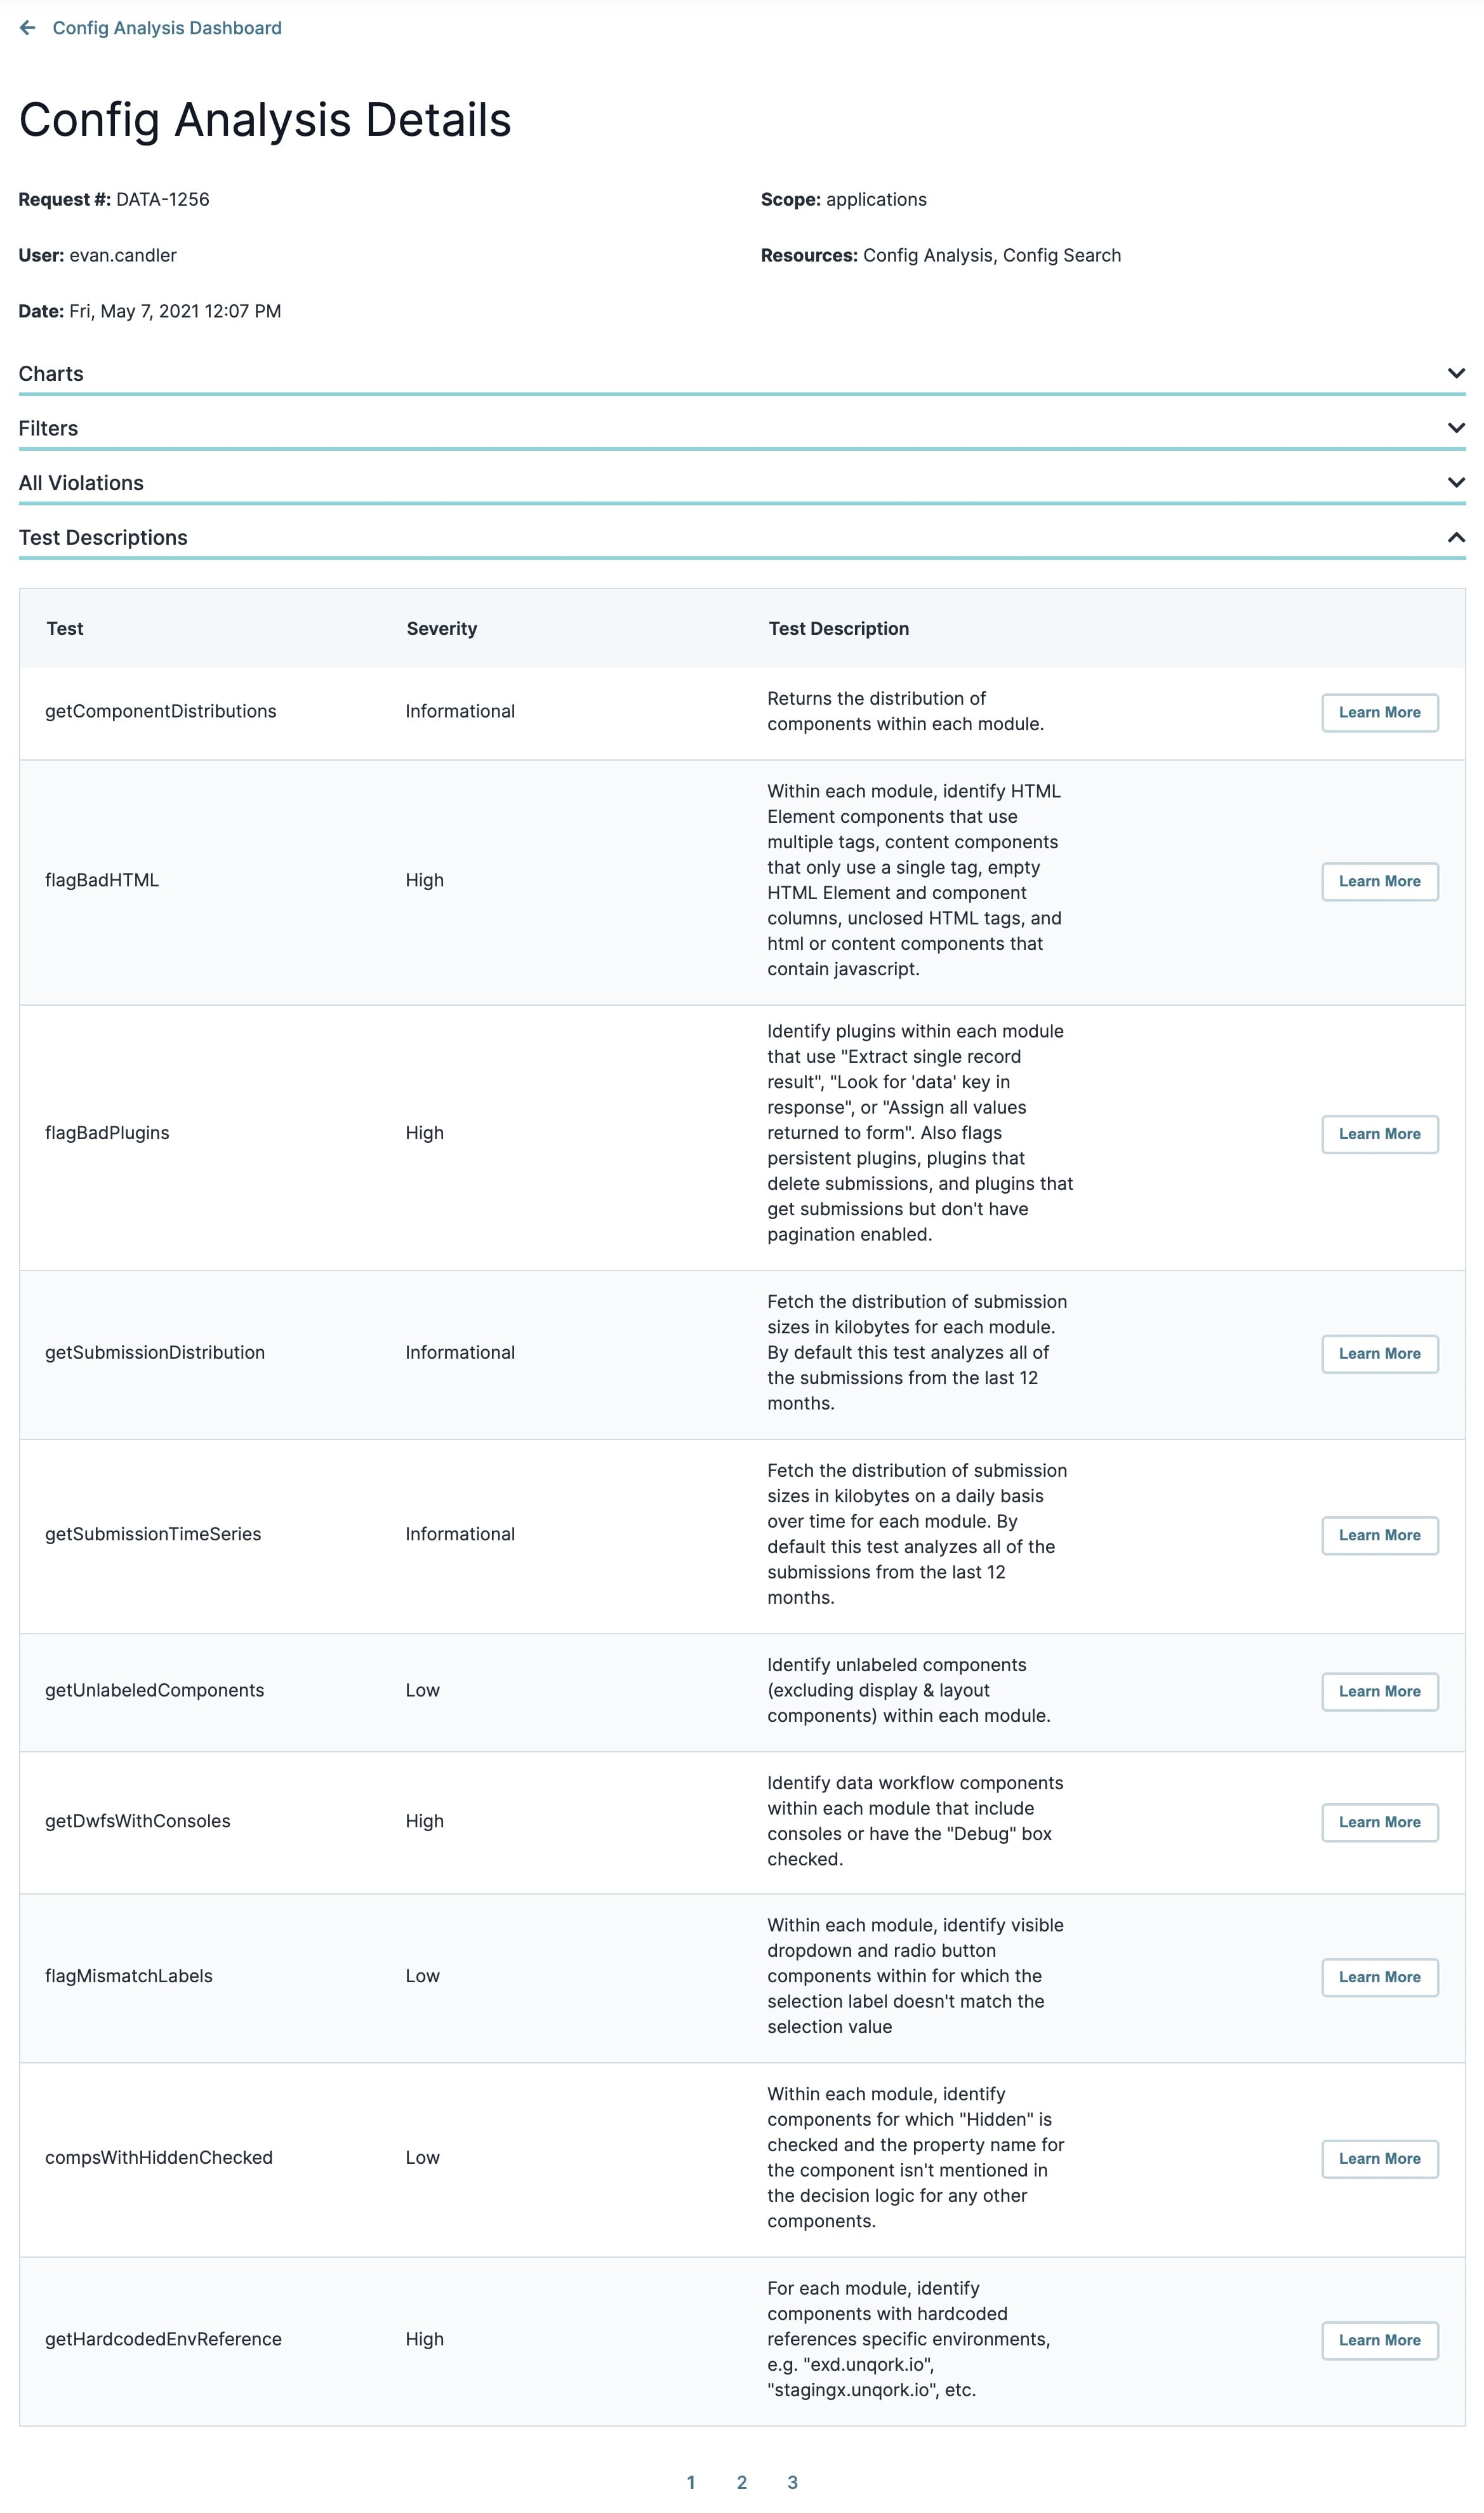
The final panel of the dashboard is the Test Descriptions panel. Here you can look at the tests run on your modules and applications. By default, the table shows 10 tests. You can click the pagination buttons below the table to see more. The table shows the following:
Test Name
Test Severity
Test description
Here's what the Test Descriptions panel looks like:
To get more detailed information about a test, click on the Learn More button to the right of it. When you do, a pop-up appears with an in-depth description of the test. You'll see the following sections in the pop-up:
Attribute | Description |
|---|---|
Test | This is the test's name. |
Severity | This is the test's severity. |
Test Description | This is a brief description of what the test does. |
Suggested Action Item | Here you can find a suggestion for your configuration. Following these suggestions will help ensure you configure the module using Unqork's best practices. |
Overview | An explanation for the suggested action. |
Columns Explanation | This is a description of the test fields you'll find in your spreadsheet report. |
