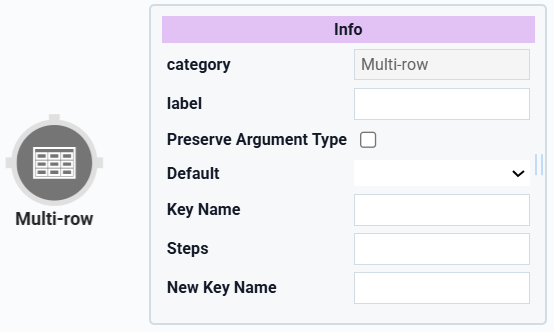
The Multi-Row operator duplicates a table column and shifts it to another row in the same table. Depending on your needs, you can shift data up or down in your table. First, you’ll set the number of rows you want your data shifted and a new key name for the data.
This operator is useful if you want to compare changes in your data over time. Let's say you're tracking your company's stock prices and want to compare the changes over a number of days. You can use the Multi-Row operator to generate that data.
You’ll find the Multi-Row operator under the Table group to the left of the Data Workflow canvas
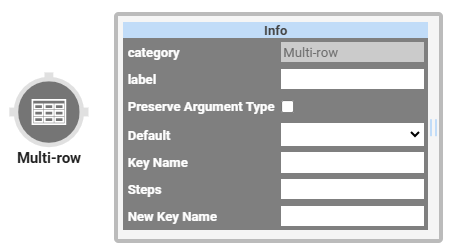
About the Info Window
Here's a breakdown of each setting in the Info window:
Setting | Description |
|---|---|
Category | Grayed out and non-adjustable setting indicating the operation type. |
Label | Sets the label for your operator, displaying below the operator on your Data Workflow canvas. This field is optional, but set a label if you use more than one of the same operator type. A label helps you identify your operators without opening any Info windows. |
Preserve Argument Type | When selected, this setting ensures the argument data type is respected when the operator executes. |
Default | When shifting data, there is inevitably an empty key. This drop-down determines what to use in that empty key. By default, this is set to |
Key Name | The key/value pair to duplicate and shift. |
Steps | Sets the number of rows to shift the data. You can input a positive or negative number. A positive number moves data up, and a negative number moves data down. |
New Key Name | Sets the name for the new key where your shifted data will be held. A new name is required so you do no have two keys with the same name. |
Adding a Multi-Row Operator
Let’s say you want to compare your company's stock prices over multiple days. To begin, you’ll create a set of sample data that includes:
Company Name
Stock Price
Date
Then, you use a Data Workflow with a Multi-Row operator to duplicate that data and shift it down one row. Doing so places your current stock prices next to the stock price for the previous day. You can then take the average of those two prices and display this data in a chart.
These instructions assume you have a new module open, saved, and with a title.
Configure the Data Table Component
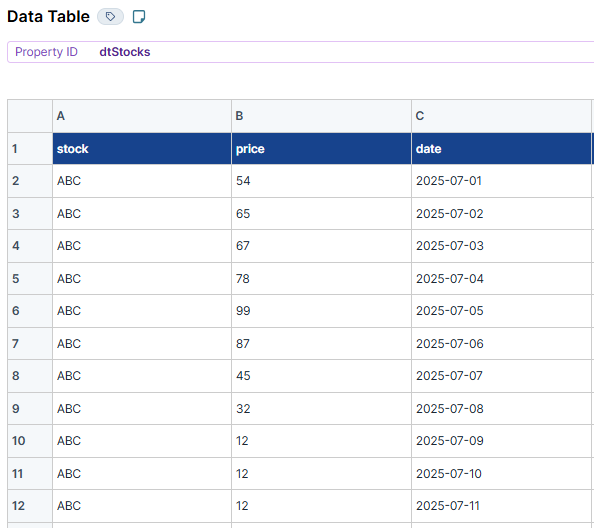
First, set up your sample data in a Data Table component.
In the Module Builder, drag and drop a Data Table component onto your canvas.
In the Property ID, enter
dtStocks.In the data table, enter the following:
#
stock
price
date
1
ABC
54
2025-07-01
2
ABC
65
2025-07-02
3
ABC
67
2025-07-03
4
ABC
78
2025-07-04
5
ABC
99
2025-07-05
6
ABC
87
2025-07-06
7
ABC
45
2025-07-07
8
ABC
32
2025-07-08
9
ABC
12
2025-07-09
10
ABC
12
2025-07-10
11
ABC
12
2025-07-11
12
ABC
87
2025-07-12
13
ABC
65
2025-07-13
14
ABC
54
20251-07-14
15
ABC
43
20251-07-15
16
ABC
55
2025-07-16
17
ABC
66
2025-07-17
18
ABC
77
2025-07-18
19
ABC
88
2025-07-19
Click Save Component.
Configure the Hidden Component
Before you can duplicate your stock prices using a Data Workflow, you need a Hidden component to store your final data.
Drag and drop a Hidden component onto your canvas, placing it below the
dtStocksData Table component.In the Property ID and Label Text fields, enter
multiOutput.Click Save Component.
Configure the Data Workflow Component
Now it's time to add your Data Workflow. You’ll use an Input operator to bring your data into the Data Workflow. Then, use a Multi-Row operator to duplicate your price data and shift your data up one row. Next, you use a Create Field operator to take the average between your two stock prices. You’ll also configure a Pick operator to select three pieces of data:
Date
Stock price
2-day average price
Lastly, an Output operator outputs the data in the multiOutput Hidden component.
Drag and drop a Data Workflow component onto your canvas, placing it below the
dtSocksData Table component.In the Property ID and Canvas Label Text fields, enter
dwfMultiRow.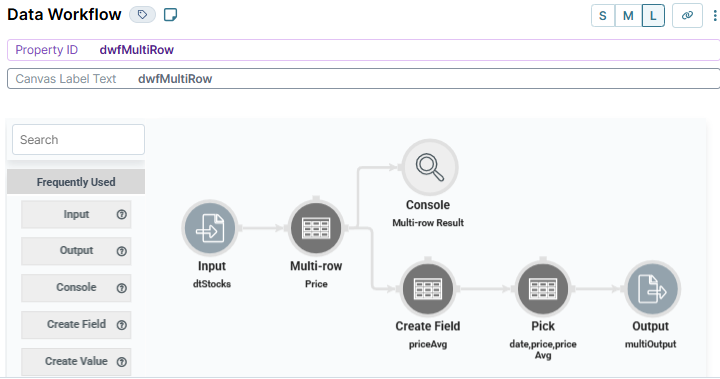
Configure the Input Operator
Drag and drop an Input operator onto your Data Workflow canvas.
Configure the operator's Info window as follows:
Setting
Value
category
Input
Component
dtStocks
required
Yes
source
Default
Configure the Multi-Row Operator
This operator duplicates your price data and moves it up one row.
Drag and drop a Multi-Row operator onto your Data Workflow canvas.
Configure the operator's Info window as follows:
Setting
Value
category
Multi-Row
label
Price
Default
0
Key Name
price
Steps
1
New Key Name
nextDayPrice
Connect the output port (right) of the
dtStocksInput operator to the input port (left) of thePriceMulti-Row operator.
Configure the Console Operator
This operator lets you view your data after it passes through the Multi-Row operator.
Drag and drop a Console operator onto your Data Workflow canvas.
Configure the operator's Info window as follows:
Setting
Value
category
Console
label
Multi-Row Result
Connect the output port (right) of the
PriceMulti-Row operator to the input port (left) of theMulti-Row ResultConsole operator.
Configure the Create Field Operator
This operator finds the average of your two stock prices. It then places that average in a new key of your table called priceAvg.
Drag and drop a Create Field operator onto your Data Workflow canvas.
Configure the operator's Info window as follows:
Setting
Value
Category
Formula
Label
priceAvg
Do Not Sanitize Formula
.png) (checked)
(checked)Field 1
priceAvg=SUM(price,nextDayPrice)/2
Field 2
Field 3
Field 4
Field 5
Connect the output port (right) of the
PriceMulti-Row operator to the input port (left) of thepriceAvgCreate Field operator.
Configure the Pick Operator
The Pick operator selects the date, price, and priceAvg values from your data.
Drag and drop a Pick operator onto your Data Workflow canvas.
Configure the operator's Info window as follows:
Setting
Value
category
Pick
label
date,price,priceAvg
Pick Keys
date,price,priceAvg
Connect the output port (right) of the
priceAvgCreate Field operator to the input port (left) of thedate,price,priceAvgPick operator.
Configure the Output Operator
This operator outputs the data from your Pick operator into your Hidden component.
Drag and drop an Output operator onto your Data Workflow canvas.
Configure the operator's Info window as follows:
Setting
Value
category
Output
Component
multiOutput
action
value
Connect the output port (right) of the
date,price,priceAvgPick operator to the input port (left) of themultiOutputOutput operator.Click Save.
Configure the Chart Component
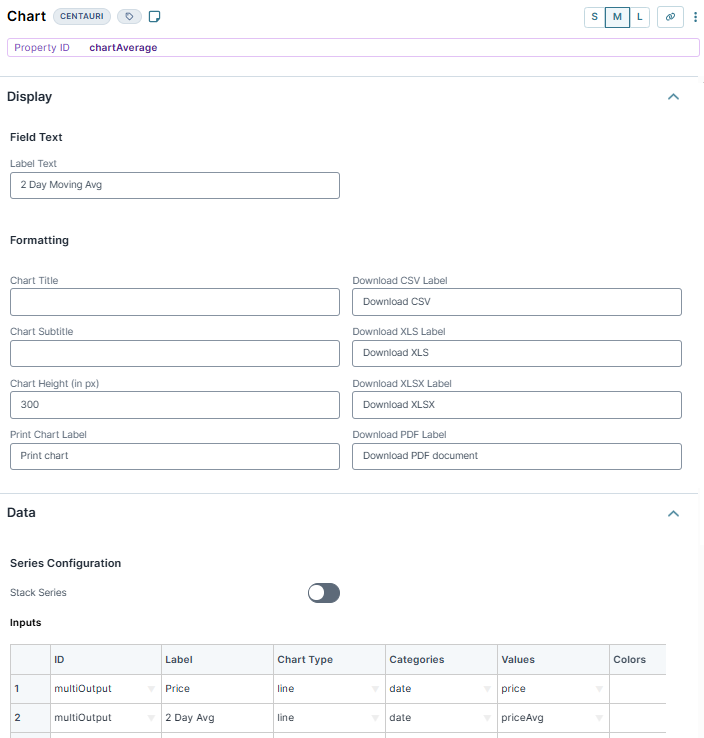
With your new data created, you'll display it in a Chart component. Remember, your Hidden component stores the date, the stock price for that date, and the 2-day average stock price for that date. So, you’ll set the date as the X-axis for the other data points.
Drag and drop a Chart component onto your canvas, placing it below the
multiOutputHidden component.In the Property ID, enter
chartAverage.In the Label Text field, enter
2 Day Moving Avg.In the Inputs table, enter the following:
ID
Label
Chart Type
Categories
Values
multiOutput
Price
line
date
price
multiOutput
2 Day Avg
line
date
priceAvg
Click Save Component.
Configure the Button Component
Lastly, add a Button component to trigger your Data Workflow.
Drag and drop a Button component onto your canvas, placing it below the
dtStocksData Table component.In the Property ID, enter
btnMultiRow.In the Label Text field, enter
Start Multi-Row.Under Element Type, select Module.
From the Action Type drop-down, select Event.
In the On Click field, select
dwfMultiRow - dwfMultiRow.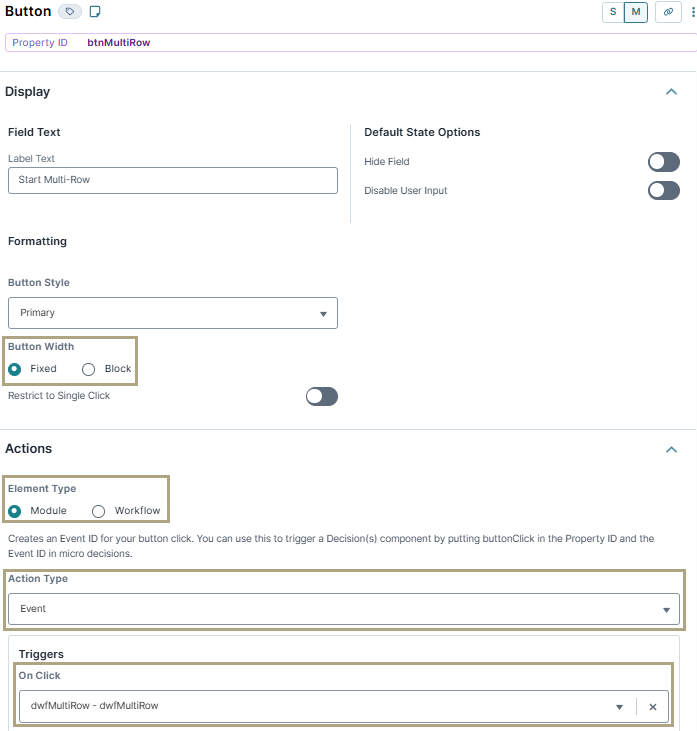
Click Save Component.
Save your module.
Here's how the completed example looks in the Module Builder:
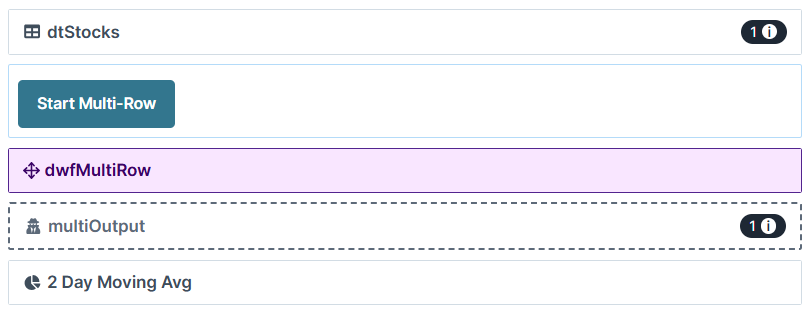
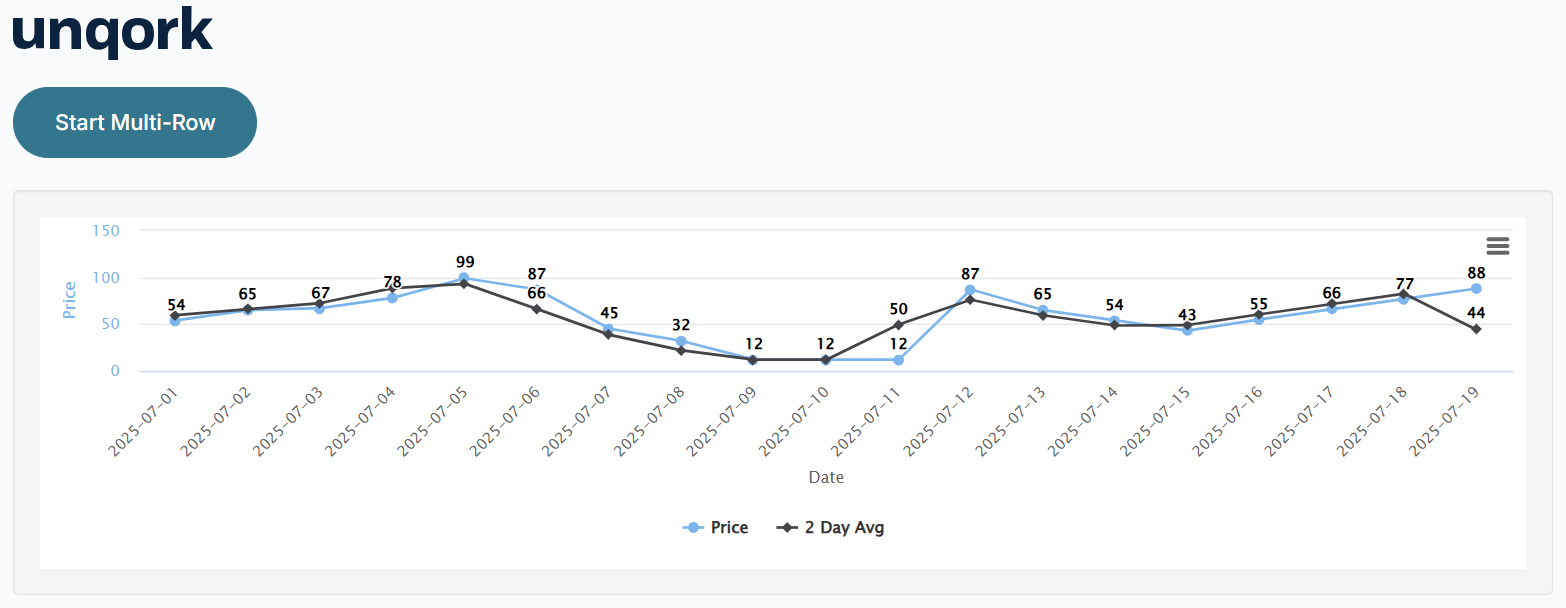
Preview your module in Express View and click the Start Multi-Row button. Your chart populates with the data from your Hidden component and displays the average stock prices that have changed over two days.
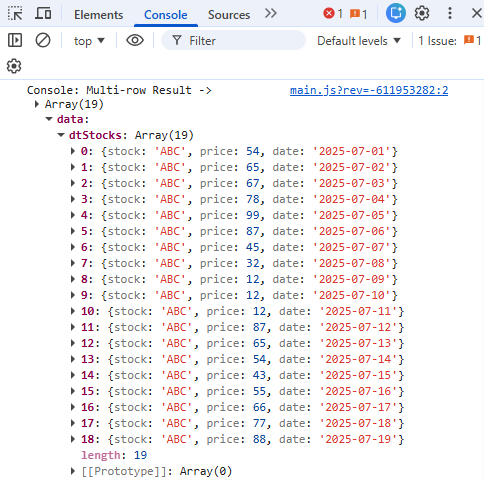
Open the DevTools Console to review the results from the Multi-Row operator. Here, you can see that each row of your data now contains nextDayPrice. This result is generated by your Multi-Row operator, taking your original price data and moving it up a row.
The Multi-Row operator duplicates a table column and shifts it to another row in the same table. Depending on your needs, you can shift data up or down in your table. First, you’ll set the number of rows you want your data shifted and a new key name for the data.
This operator is useful if you want to compare changes in your data over time. Let's say you're tracking your company's stock prices and want to compare the changes over a number of days. You can use the Multi-Row operator to generate that data.
You’ll find the Multi-Row operator under the Table group to the left of the Data Workflow canvas
About the Info Window
Here's a breakdown of each setting in the Info window:
Setting | Description |
|---|---|
Category | Grayed out and non-adjustable setting indicating the operation type. |
Label | Sets the label for your operator, displaying below the operator on your Data Workflow canvas. This field is optional, but set a label if you use more than one of the same operator type. A label helps you identify your operators without opening any Info windows. |
Preserve Argument Type | When selected, this setting ensures the argument data type is respected when the operator executes. |
Default | When shifting data, there is inevitably an empty key. This drop-down determines what to use in that empty key. By default, this is set to |
Key Name | The key/value pair to duplicate and shift. |
Steps | Sets the number of rows to shift the data. You can input a positive or negative number. A positive number moves data up, and a negative number moves data down. |
New Key Name | Sets the name for the new key where your shifted data will be held. A new name is required so you do no have two keys with the same name. |
Adding a Multi-Row Operator
Let’s say you want to compare your company's stock prices over multiple days. To begin, you’ll create a set of sample data that includes:
Company Name
Stock Price
Date
Then, you use a Data Workflow with a Multi-Row operator to duplicate that data and shift it down one row. Doing so places your current stock prices next to the stock price for the previous day. You can then take the average of those two prices and display this data in a chart.
These instructions assume you have a new module open, saved, and with a title.
Configure the Data Table Component
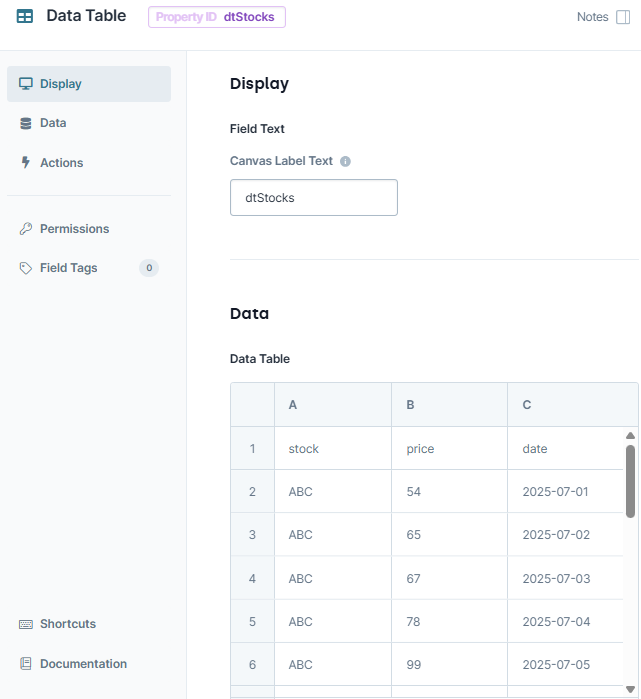
First, set up your sample data in a Data Table component.
In the Module Builder, drag and drop a Data Table component onto your canvas.
In the Property ID and Canvas Label Text, enter
dtStocks.In the data table, enter the following:
#
stock
price
date
1
ABC
54
2025-07-01
2
ABC
65
2025-07-02
3
ABC
67
2025-07-03
4
ABC
78
2025-07-04
5
ABC
99
2025-07-05
6
ABC
87
2025-07-06
7
ABC
45
2025-07-07
8
ABC
32
2025-07-08
9
ABC
12
2025-07-09
10
ABC
12
2025-07-10
11
ABC
12
2025-07-11
12
ABC
87
2025-07-12
13
ABC
65
2025-07-13
14
ABC
54
20251-07-14
15
ABC
43
20251-07-15
16
ABC
55
2025-07-16
17
ABC
66
2025-07-17
18
ABC
77
2025-07-18
19
ABC
88
2025-07-19
Click Save & Close.
Configure the Hidden Component
Before you can duplicate your stock prices using a Data Workflow, you need a Hidden component to store your final data.
Drag and drop a Hidden component onto your canvas, placing it below the
dtStocksData Table component.In the Property ID and Canvas Label Text fields, enter
multiOutput.Click Save & Close.
Configure the Data Workflow Component
Now it's time to add your Data Workflow. You’ll use an Input operator to bring your data into the Data Workflow. Then, use a Multi-Row operator to duplicate your price data and shift your data up one row. Next, you use a Create Field operator to take the average between your two stock prices. You’ll also configure a Pick operator to select three pieces of data:
Date
Stock price
2-day average price
Lastly, an Output operator outputs the data in the multiOutput Hidden component.
Drag and drop a Data Workflow component onto your canvas, placing it below the
dtSocksData Table component.In the Canvas Label Text and Property Name fields, enter
dwfMultiRow.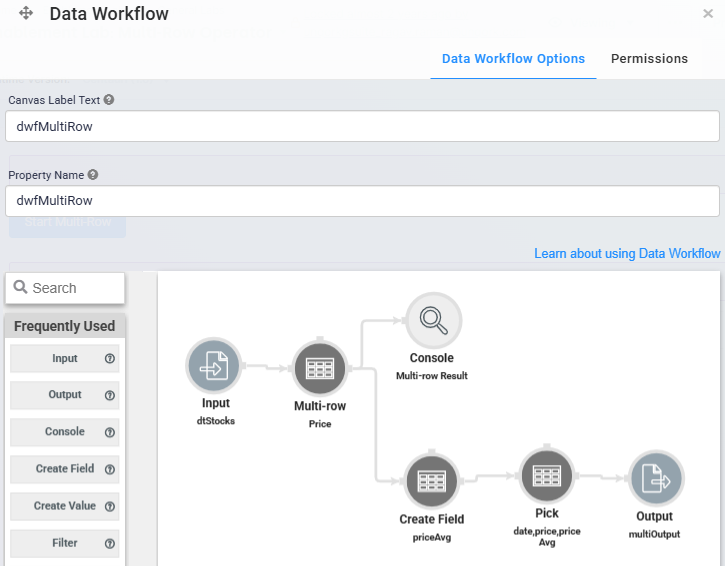
Configure the Input Operator
Drag and drop an Input operator onto your Data Workflow canvas.
Configure the operator's Info window as follows:
Setting
Value
category
Input
Component
dtStocks
required
Yes
Source
Default
Configure the Multi-Row Operator
This operator duplicates your price data and moves it up one row.
Drag and drop a Multi-Row operator onto your Data Workflow canvas.
Configure the operator's Info window as follows:
Setting
Value
category
Multi-Row
label
Price
Default
0
Key Name
price
Steps
1
New Key Name
nextDayPrice
Connect the output port (right) of the
dtStocksInput operator to the input port (left) of thePriceMulti-Row operator.
Configure the Console Operator
This operator lets you view your data after it passes through the Multi-Row operator.
Drag and drop a Console operator onto your Data Workflow canvas.
Configure the operator's Info window as follows:
Setting
Value
category
Console
label
Multi-Row Result
Connect the output port (right) of the
PriceMulti-Row operator to the input port (left) of theMulti-Row ResultConsole operator.
Configure the Create Field Operator
This operator finds the average of your two stock prices. It then places that average in a new key of your table called priceAvg.
Drag and drop a Create Field operator onto your Data Workflow canvas.
Configure the operator's Info window as follows:
Setting
Value
category
Formula
label
priceAvg
Do Not Sanitize Formula
.png) (checked)
(checked)Field 1
priceAvg=SUM(price,nextDayPrice)/2
Field 2
Field 3
Field 4
Field 5
Connect the output port (right) of the
PriceMulti-Row operator to the input port (left) of thepriceAvgCreate Field operator.
Configure the Pick Operator
The Pick operator selects the date, price, and priceAvg values from your data.
Drag and drop a Pick operator onto your Data Workflow canvas.
Configure the operator's Info window as follows:
Setting
Value
category
Pick
label
date,price,priceAvg
Pick Keys
date,price,priceAvg
Connect the output port (right) of the
priceAvgCreate Field operator to the input port (left) of thedate,price,priceAvgPick operator.
Configure the Output Operator
This operator outputs the data from your Pick operator into your Hidden component.
Drag and drop an Output operator onto your Data Workflow canvas.
Configure the operator's Info window as follows:
Setting
Value
category
Output
Component
multiOutput
action
value
Connect the output port (right) of the
date,price,priceAvgPick operator to the input port (left) of themultiOutputOutput operator.Click Save.
Configure the Chart Component
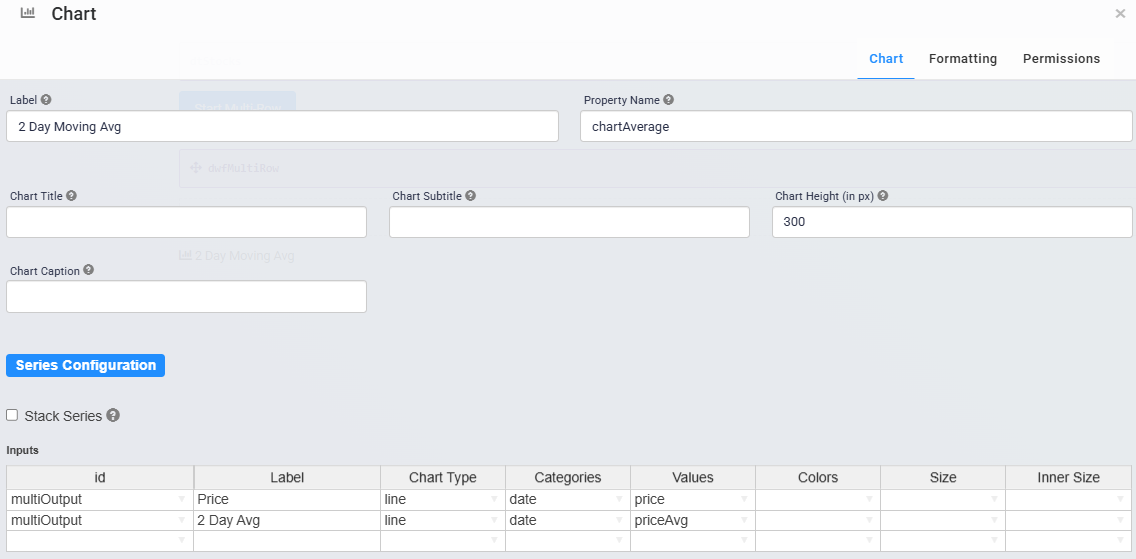
With your new data created, you'll display it in a Chart component. Remember, your Hidden component stores the date, the stock price for that date, and the 2-day average stock price for that date. So, you’ll set the date as the X-axis for the other data points.
Drag and drop a Chart component onto your canvas, placing it below the
multiOutputHidden component.In the Label field, enter
2 Day Moving Avg.In the Property Name field, enter
chartAverage.In the Inputs table, enter the following:
ID
Label
Chart Type
Categories
Values
multiOutput
Price
line
date
price
multiOutput
2 Day Avg
line
date
priceAvg
Click the Formatting tab at the top of the configuration window.
In the X Axis Label field, enter
Date.In the Y Axis Label (Primary) field, enter
Price.Set Show Legend to Yes (checked).
.jpg)
Click Save.
Configure the Button Component
Lastly, add a Button component to trigger your Data Workflow.
Drag and drop a Button component onto your canvas, placing it below the
dtStocksData Table component.In the Property ID, enter
btnMultiRow.In the Label Text field, enter
Start Multi-Row.Set the Action Type to Event.
In the Trigger on Click field, enter
dwfMultiRow.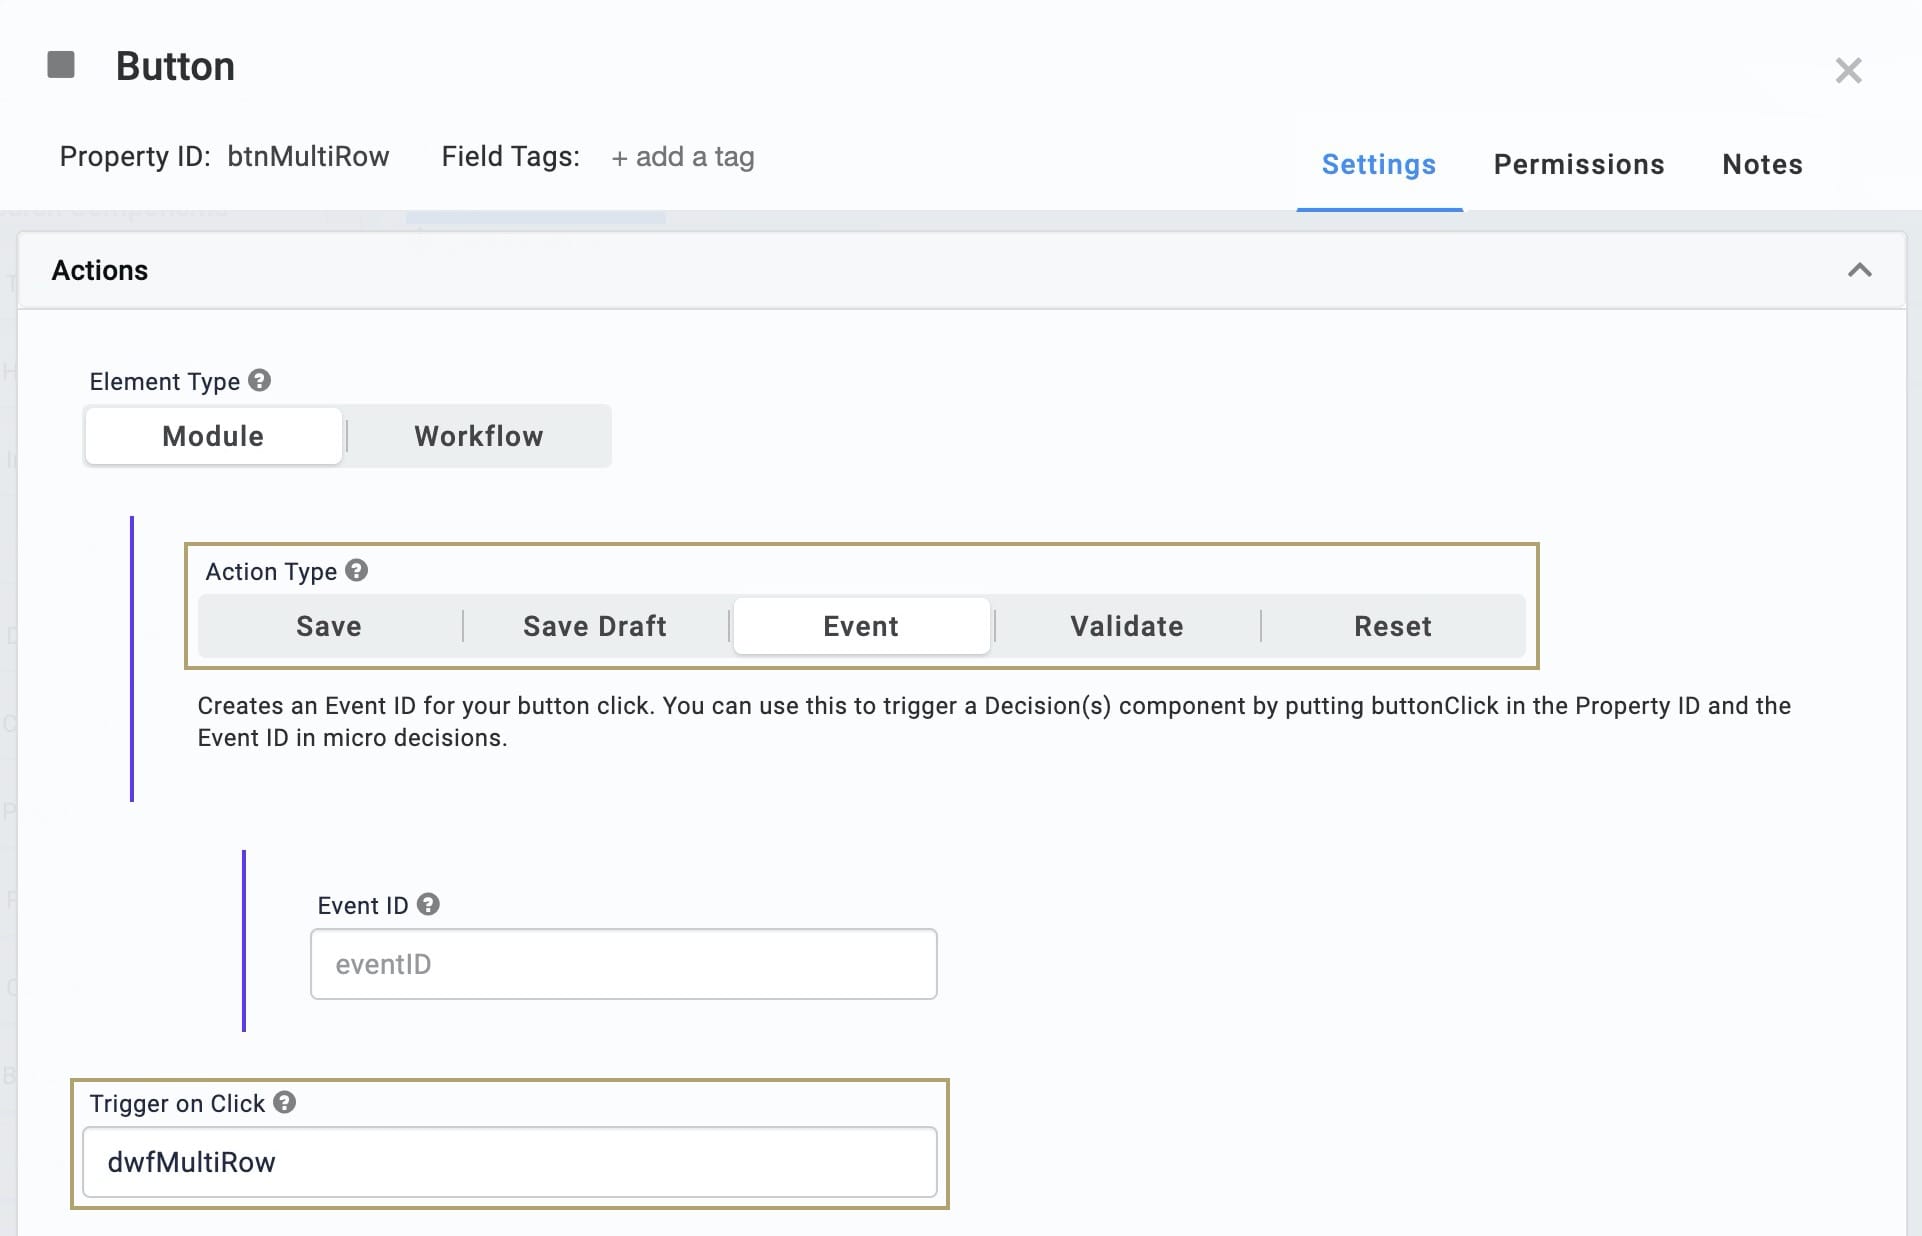
Click Save & Close.
Save your module.
Here's how the completed example looks in the Module Builder:

Preview your module in Express View and click the Start Multi-Row button. Your chart populates with the data from your Hidden component and displays the average stock prices that have changed over two days.

Open the DevTools Console to review the results from the Multi-Row operator. Here, you can see that each row of your data now contains nextDayPrice. This result is generated by your Multi-Row operator, taking your original price data and moving it up a row.
