Create Index Operator: Filtering on Individual Rows
Overview
There are many ways to use the Create Index operator. You can use it to add new rows of information to an existing Data Table. Or, you can use it to filter out a specific row of data. Let's say you have a table of patient names, birthdays, and insurance statuses. But you are only interested in looking at one patient's information at a time. You can use the Create Index operator to assign a number to each row and filter by that number.
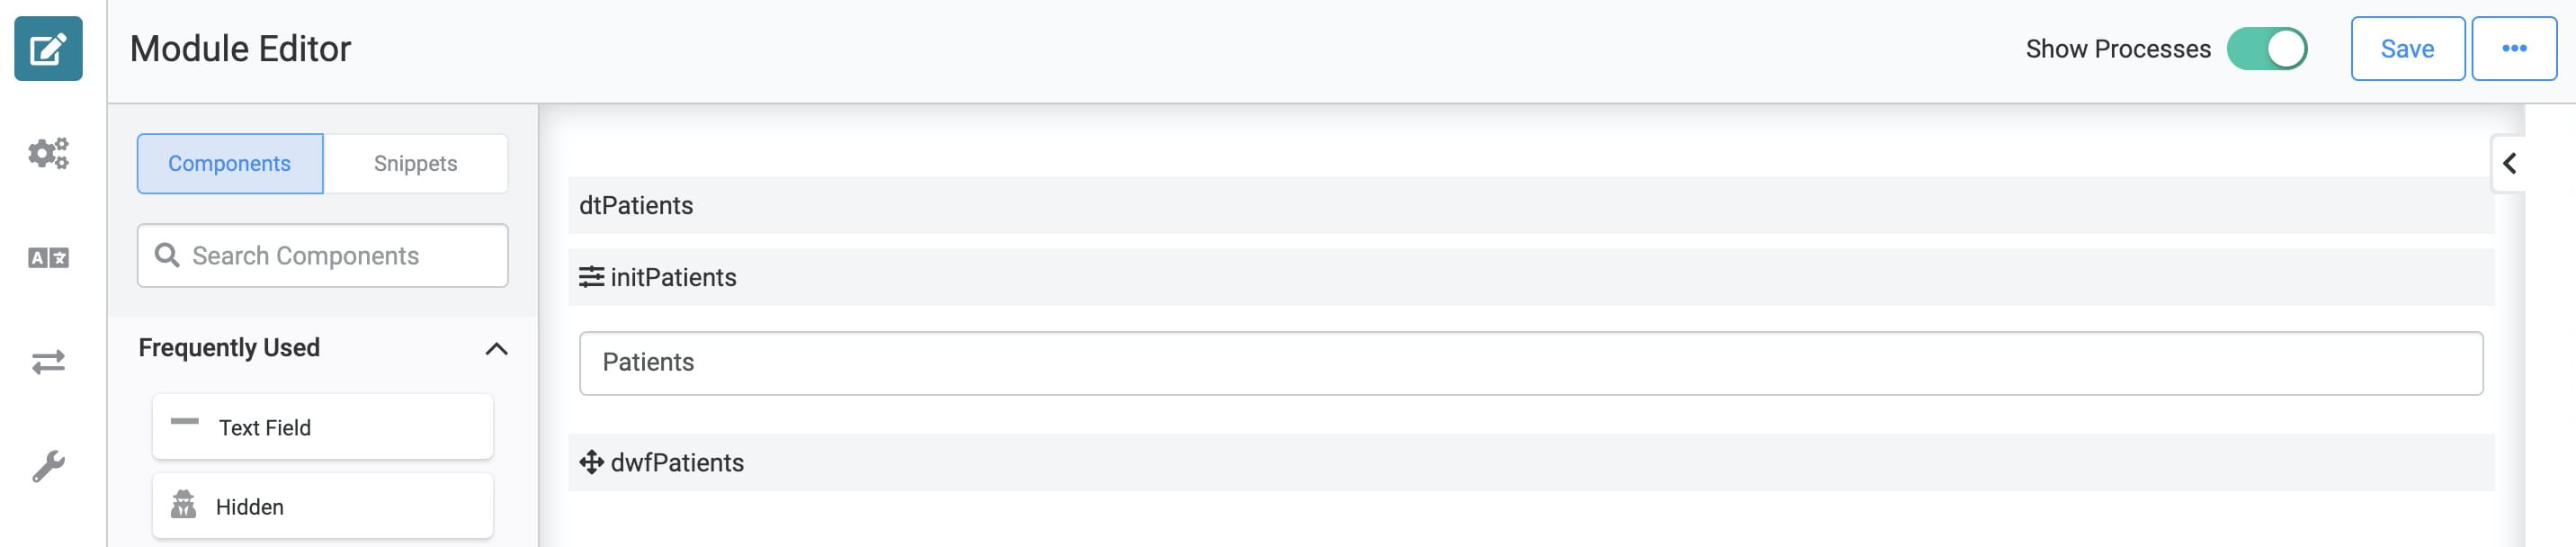
Here's how your module will look in the Module Builder:
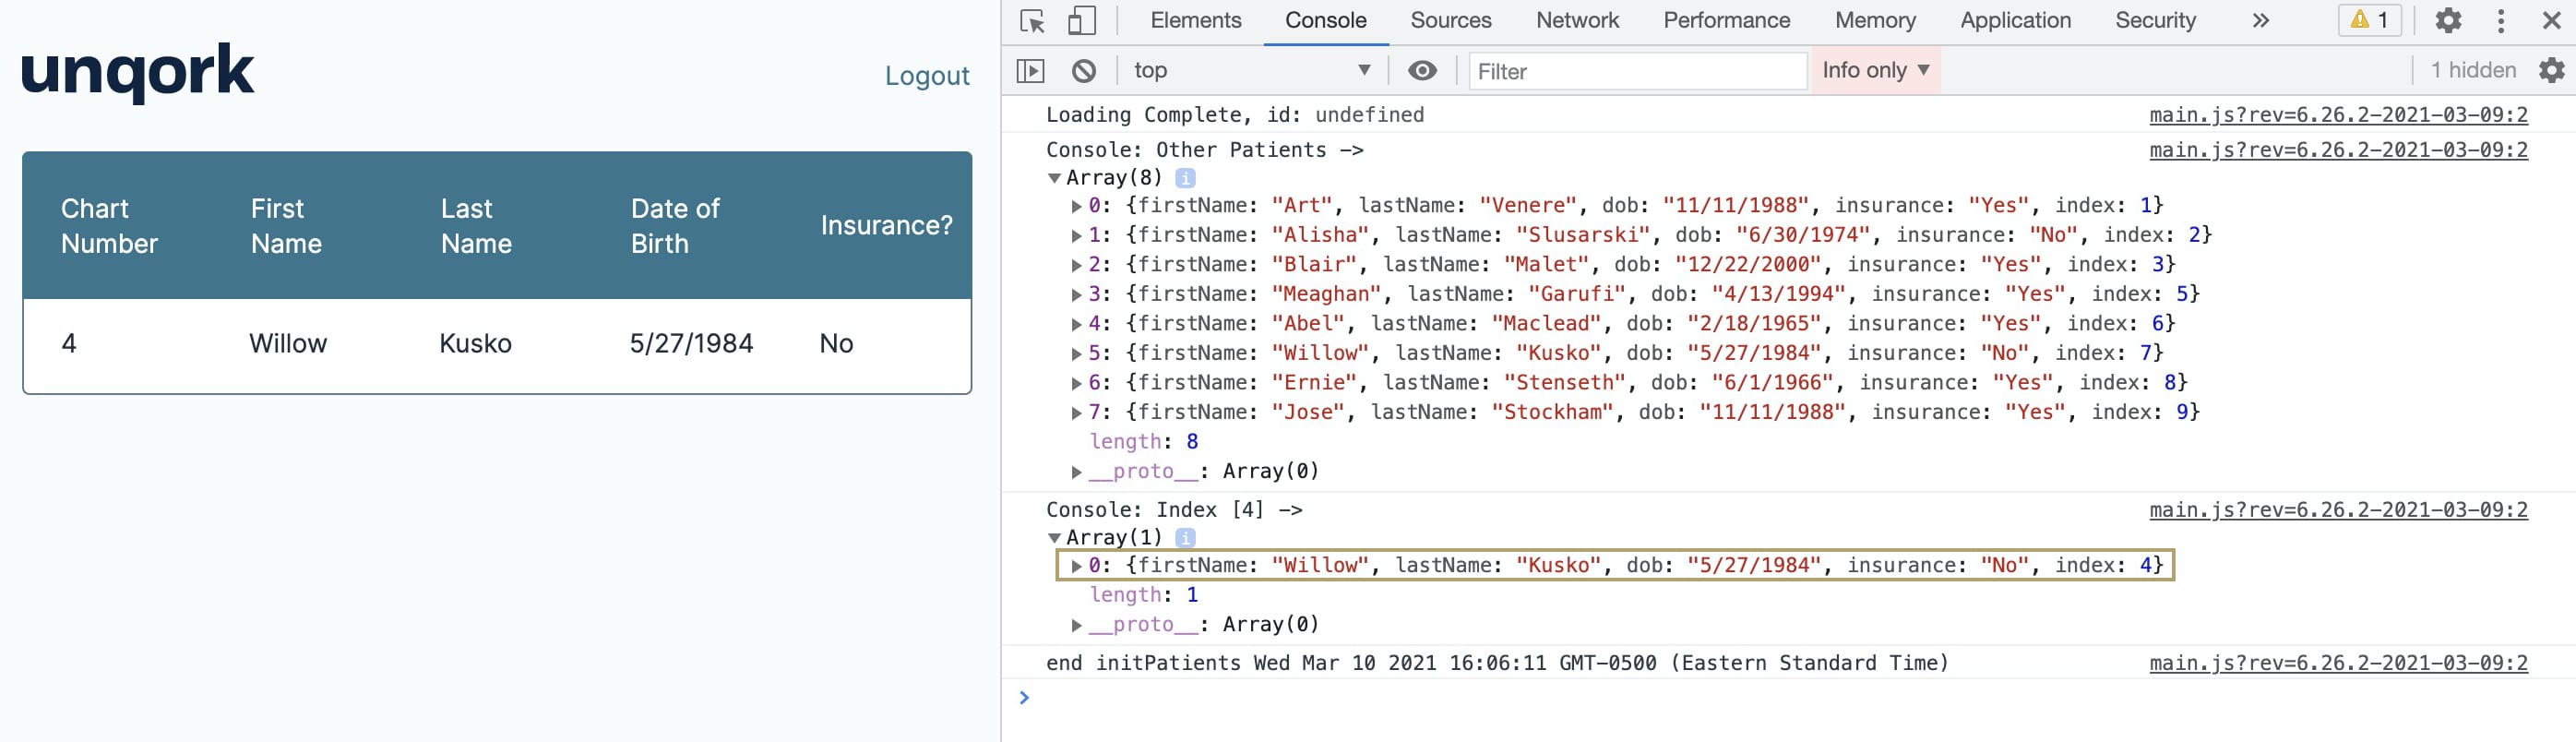
Here's how the completed use case will look in Express View, including a peek at the DevTools Console:
What You'll Learn
In this article, you'll learn how to use the Create Index operator to filter an index.
What You'll Need
To set up this use case, you’ll need:
-
1 Data Table component
-
1 Initializer component
-
1 ViewGrid component
-
1 Data Workflow component
To set up your Data Workflow, you'll need:
-
1 Input operator
-
1 Create Index operator
-
1 Filter operator
-
1 Output operator
-
2 Console operators
NOTE These instructions assume you have a new module open, saved, and with a title.
Configuration
Configure the Data Table Component
First, you'll set up a Data Table with a list of patient names, dates of birth, and their insurance status.
| 1. | In the Module Builder, drag and drop a Data Table component onto your canvas, placing it inside your Panel. |
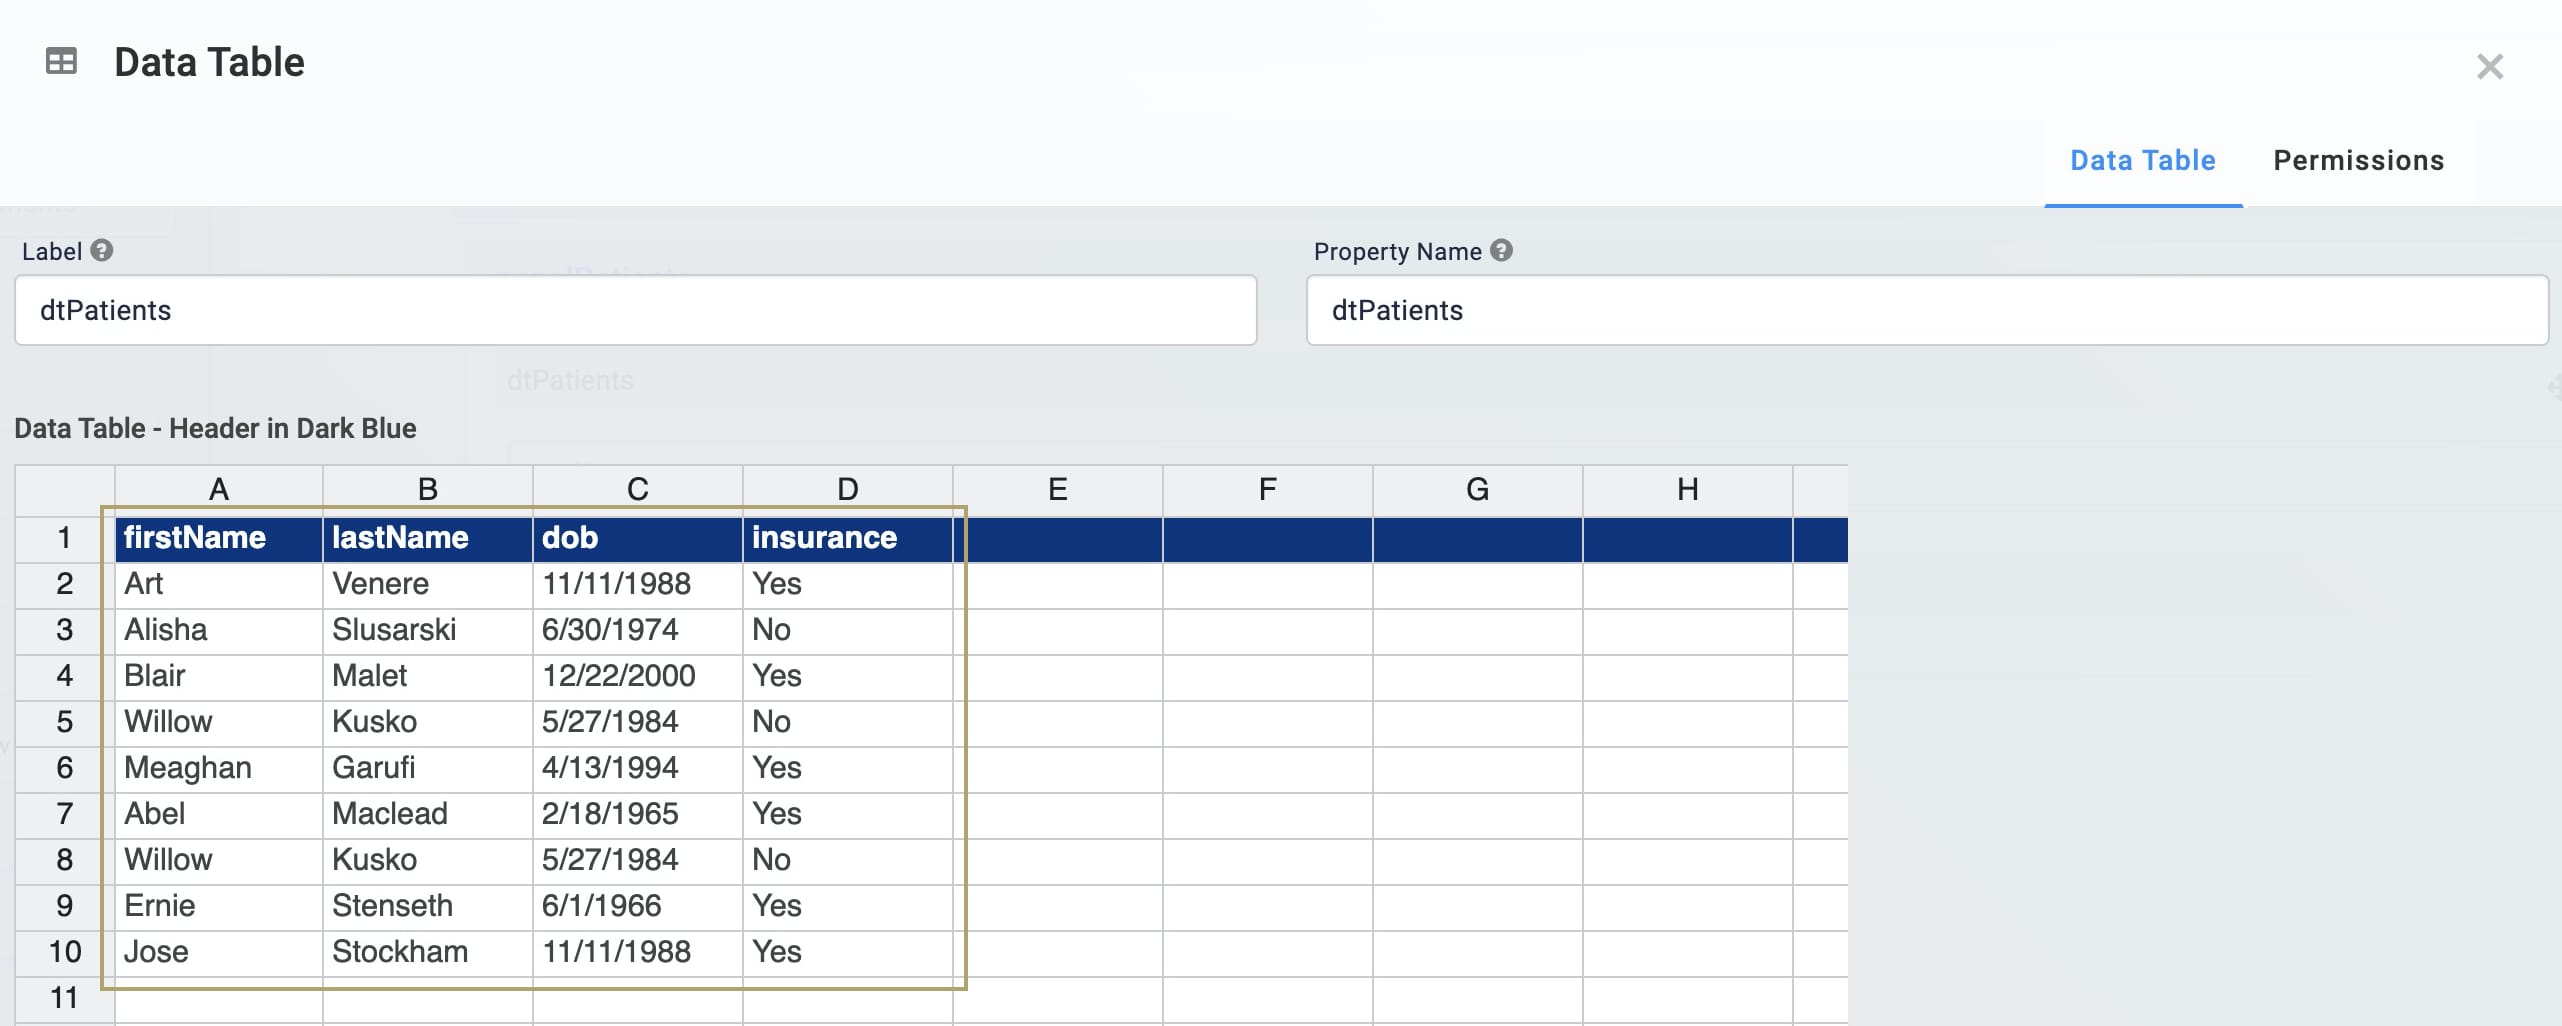
| 2. | Enter dtPatients in the Label and Property Name fields. |
| 3. | In the data table, enter the following: |
|
firstName |
lastName |
dob |
insurance |
|---|---|---|---|
|
Art |
Venere |
11/11/1988 |
Yes |
|
Alisha |
Slusarski |
6/30/1974 |
No |
|
Blair |
Malet |
12/22/2000 |
Yes |
|
Willow |
Kusko |
5/27/1984 |
No |
|
Meaghan |
Garufi |
4/13/1994 |
Yes |
|
Abel |
Maclead |
2/18/1965 |
Yes |
|
Willow |
Kusko |
5/27/1984 |
No |
|
Ernie |
Stenseth |
6/1/1966 |
Yes |
|
Jose |
Stockham |
11/11/1988 |
Yes |
NOTE You've intentionally added duplicate information for other Create Index use cases.
| 4. | Click Save. |
Configure the Initializer Component
Now, you'll set up an Initializer component to trigger your Data Workflow. You'll add your Data Workflow soon.
| 1. | Drag and drop an Initializer component onto your canvas, placing it below your Data Table. |
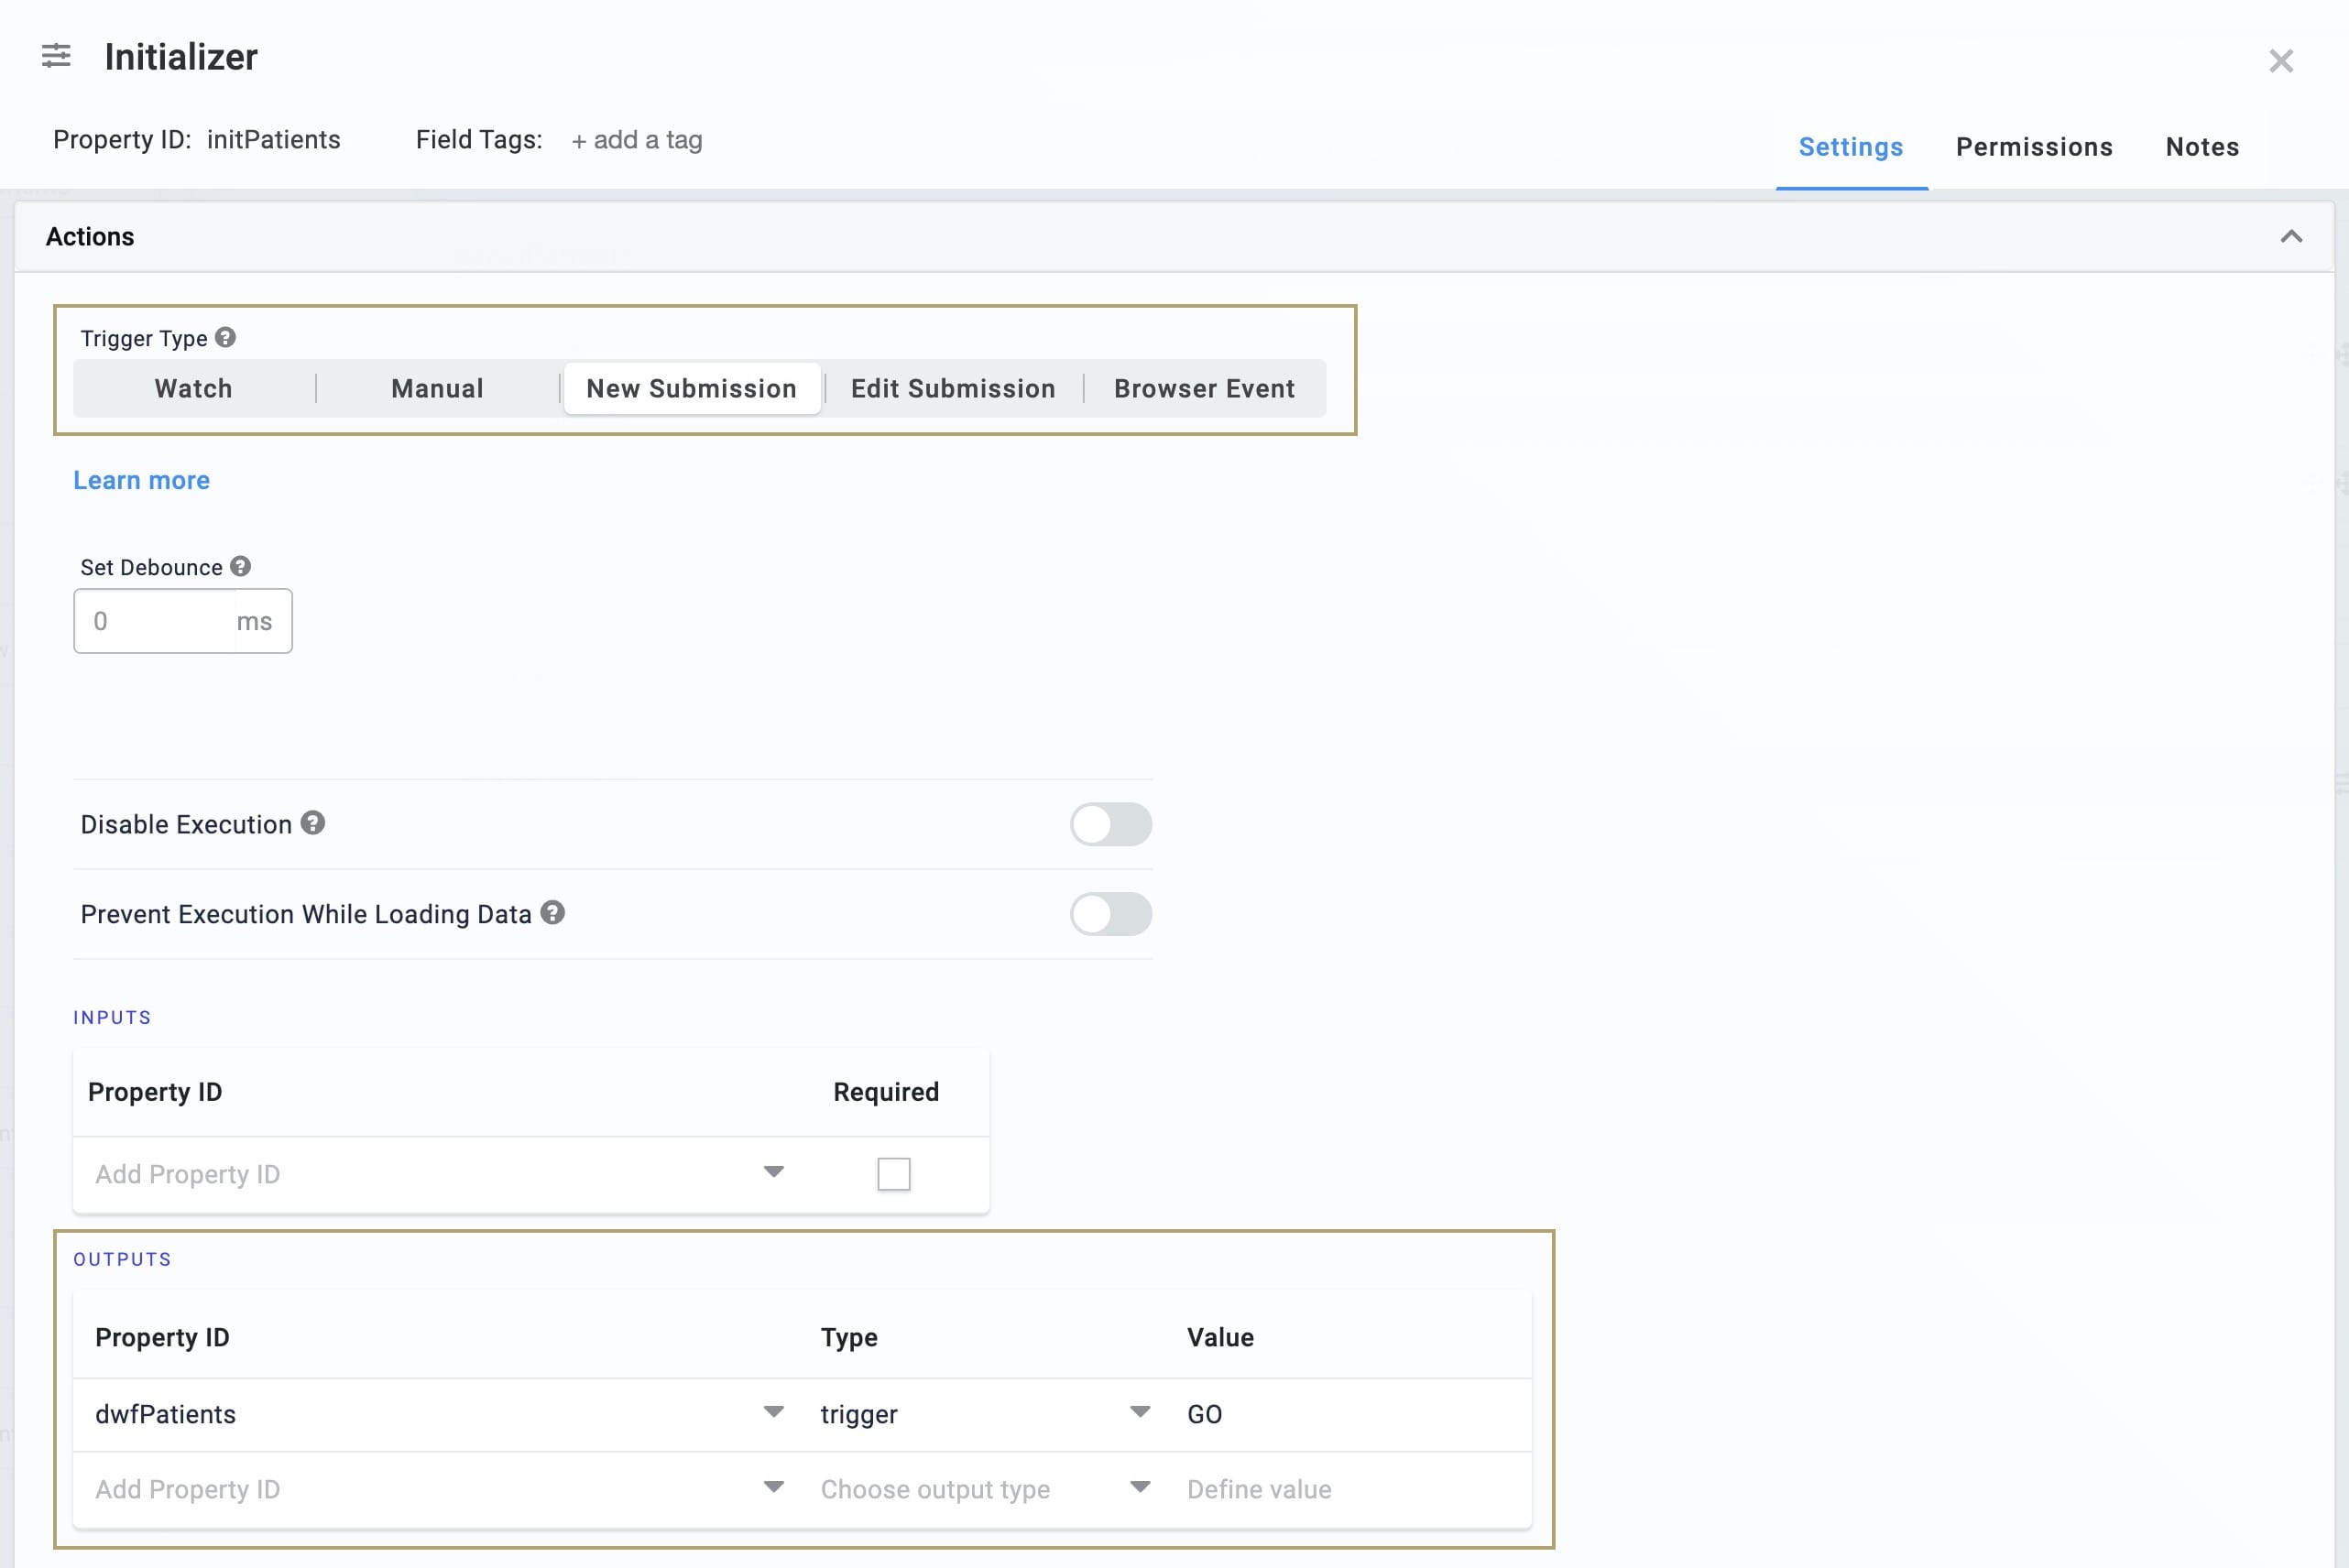
| 2. | Enter initPatients in the Property ID and Canvas Label Text fields. |
| 3. | Select New Submission as the Trigger Type. |
| 4. | In the Outputs table, set the following: |
| Property ID | Type | Value |
|---|---|---|
|
dwfPatients |
trigger |
GO |
| 5. | Click Save. |
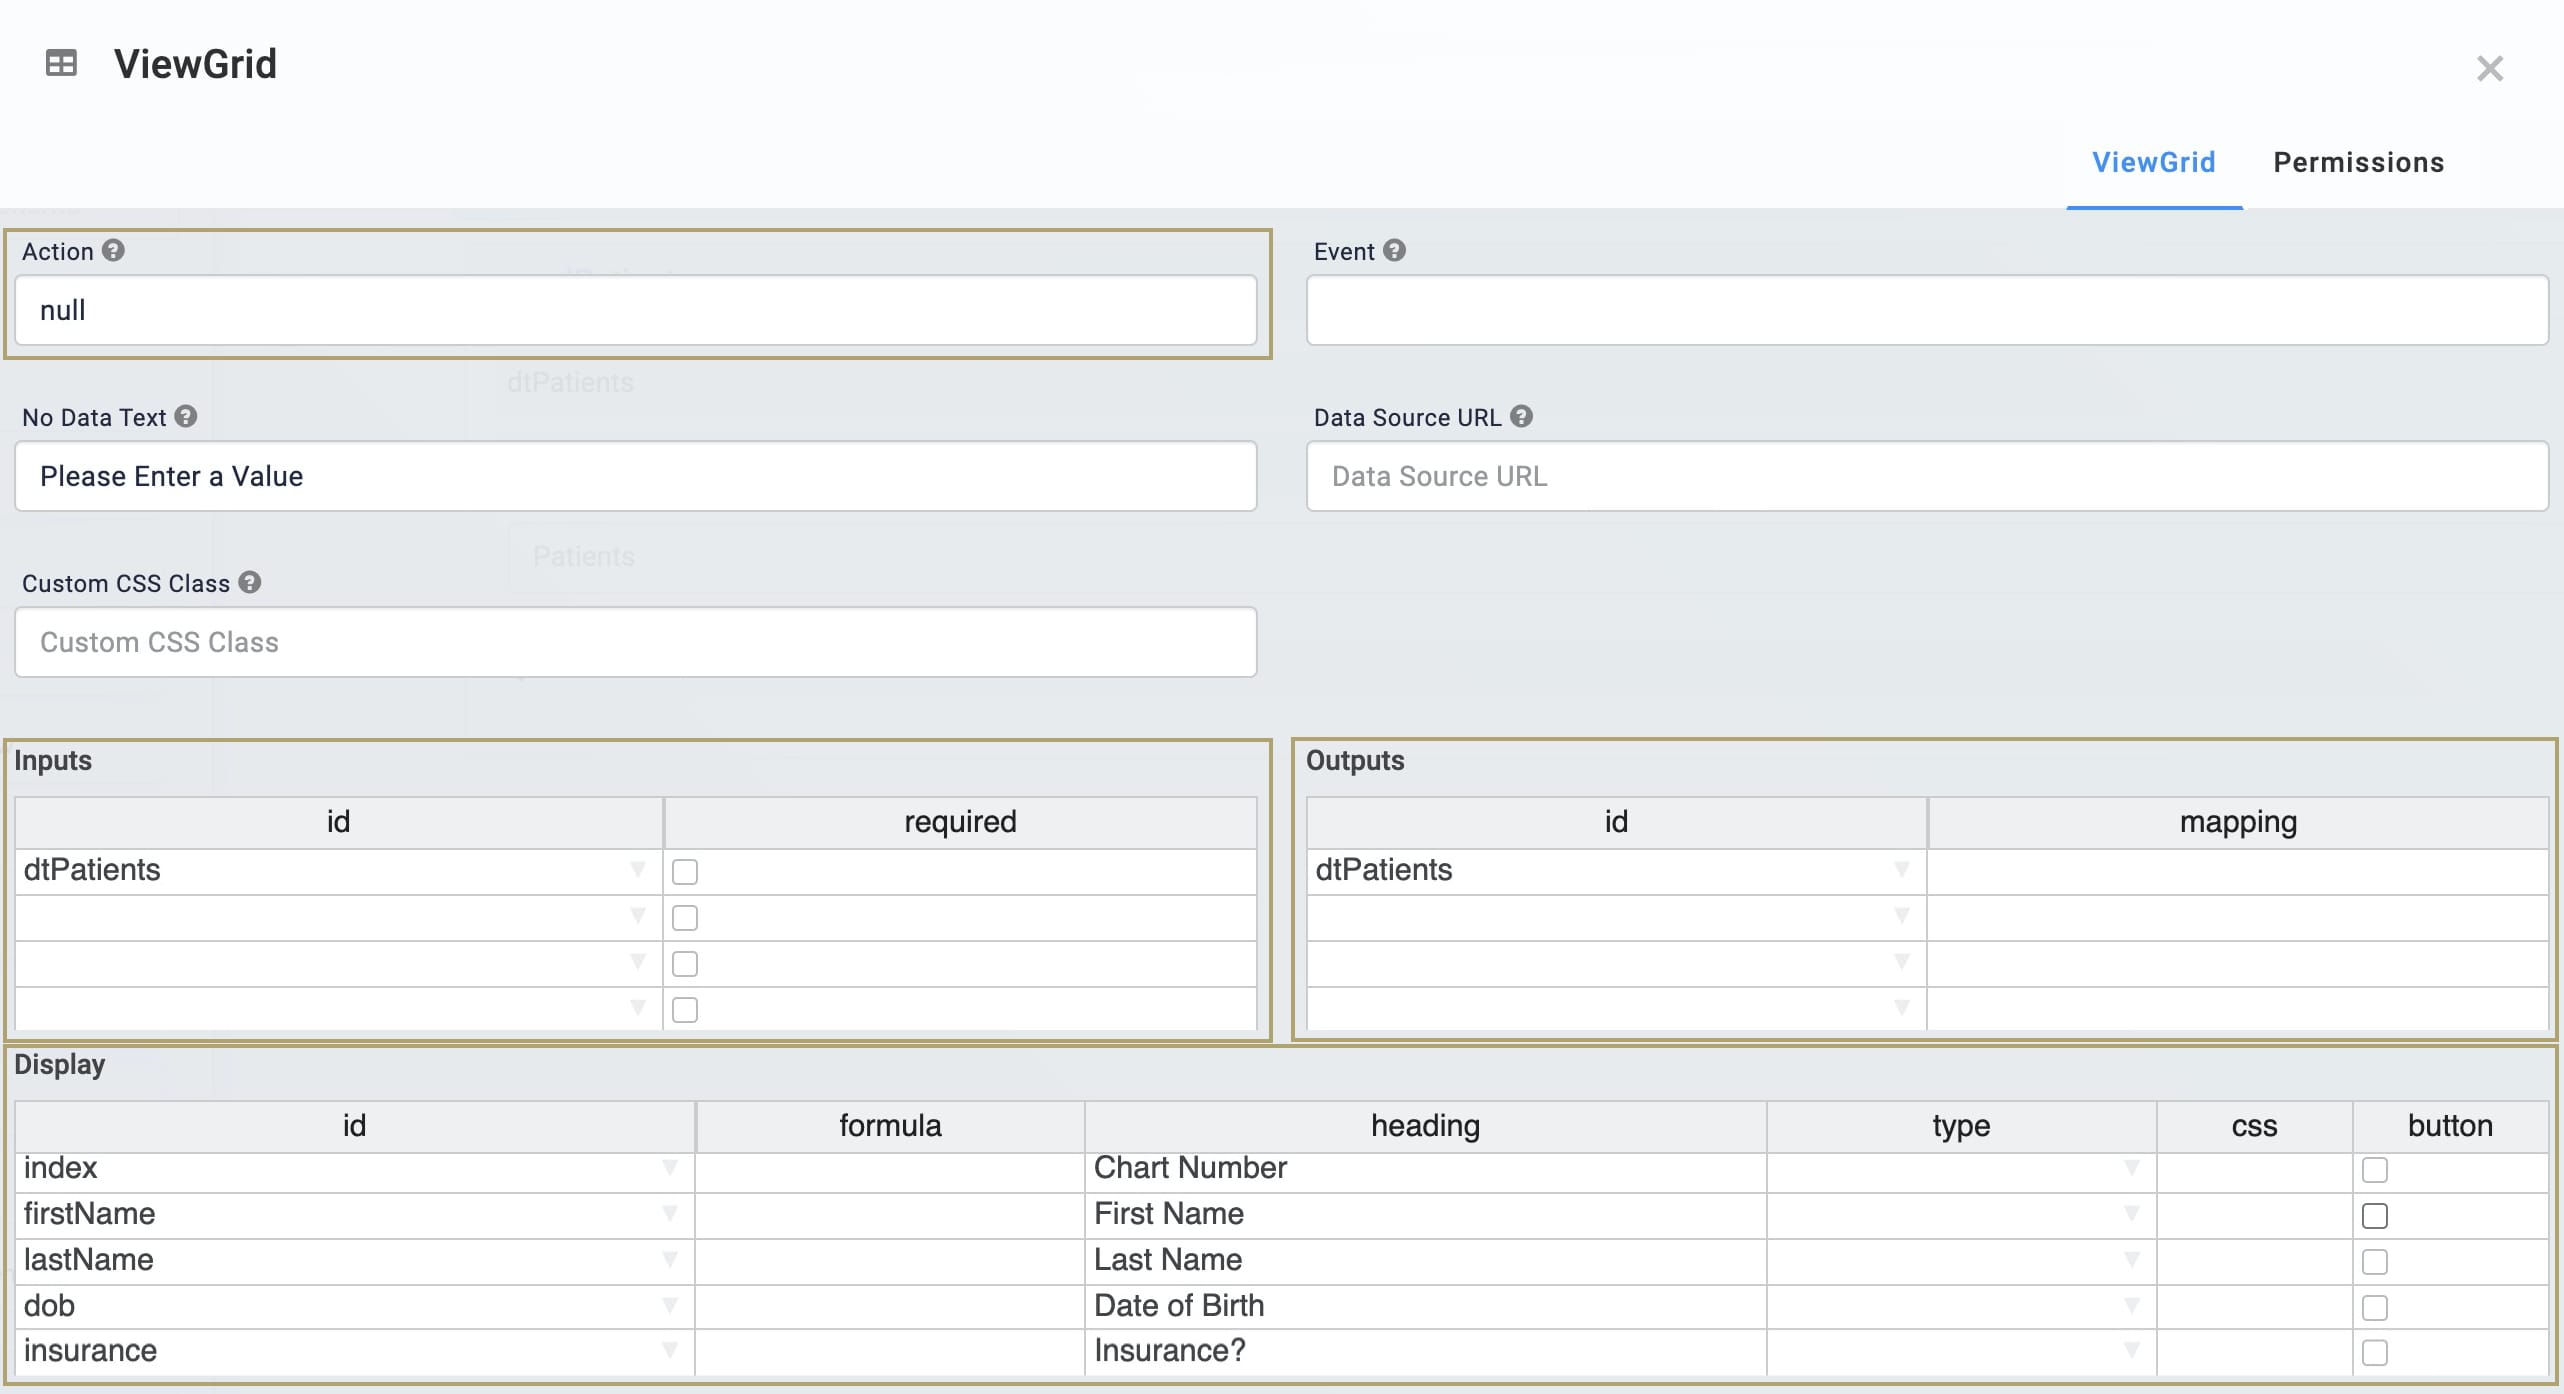
Configure the ViewGrid Component
Next, let's bring in a ViewGrid component so your end-user can see the patient information.
| 1. | Drag and drop a ViewGrid component onto the canvas, placing it below your Data Table. |
| 2. | Enter Patients in the Label field. |
| 3. | Enter gridPatients in the Property Name field. |
| 4. | Enter null in the Action field. |
| 5. | Enter dtPatients in the ID column of the Inputs and Outputs tables. |
| 6. | In the Display table, enter the following: |
| ID | Formula | Heading |
|---|---|---|
|
index |
|
Chart Number |
|
firstName |
|
First Name |
|
lastName |
|
Last Name |
|
dob |
|
Date of Birth |
|
insurance |
|
Insurance? |
| 7. | Click Save. |
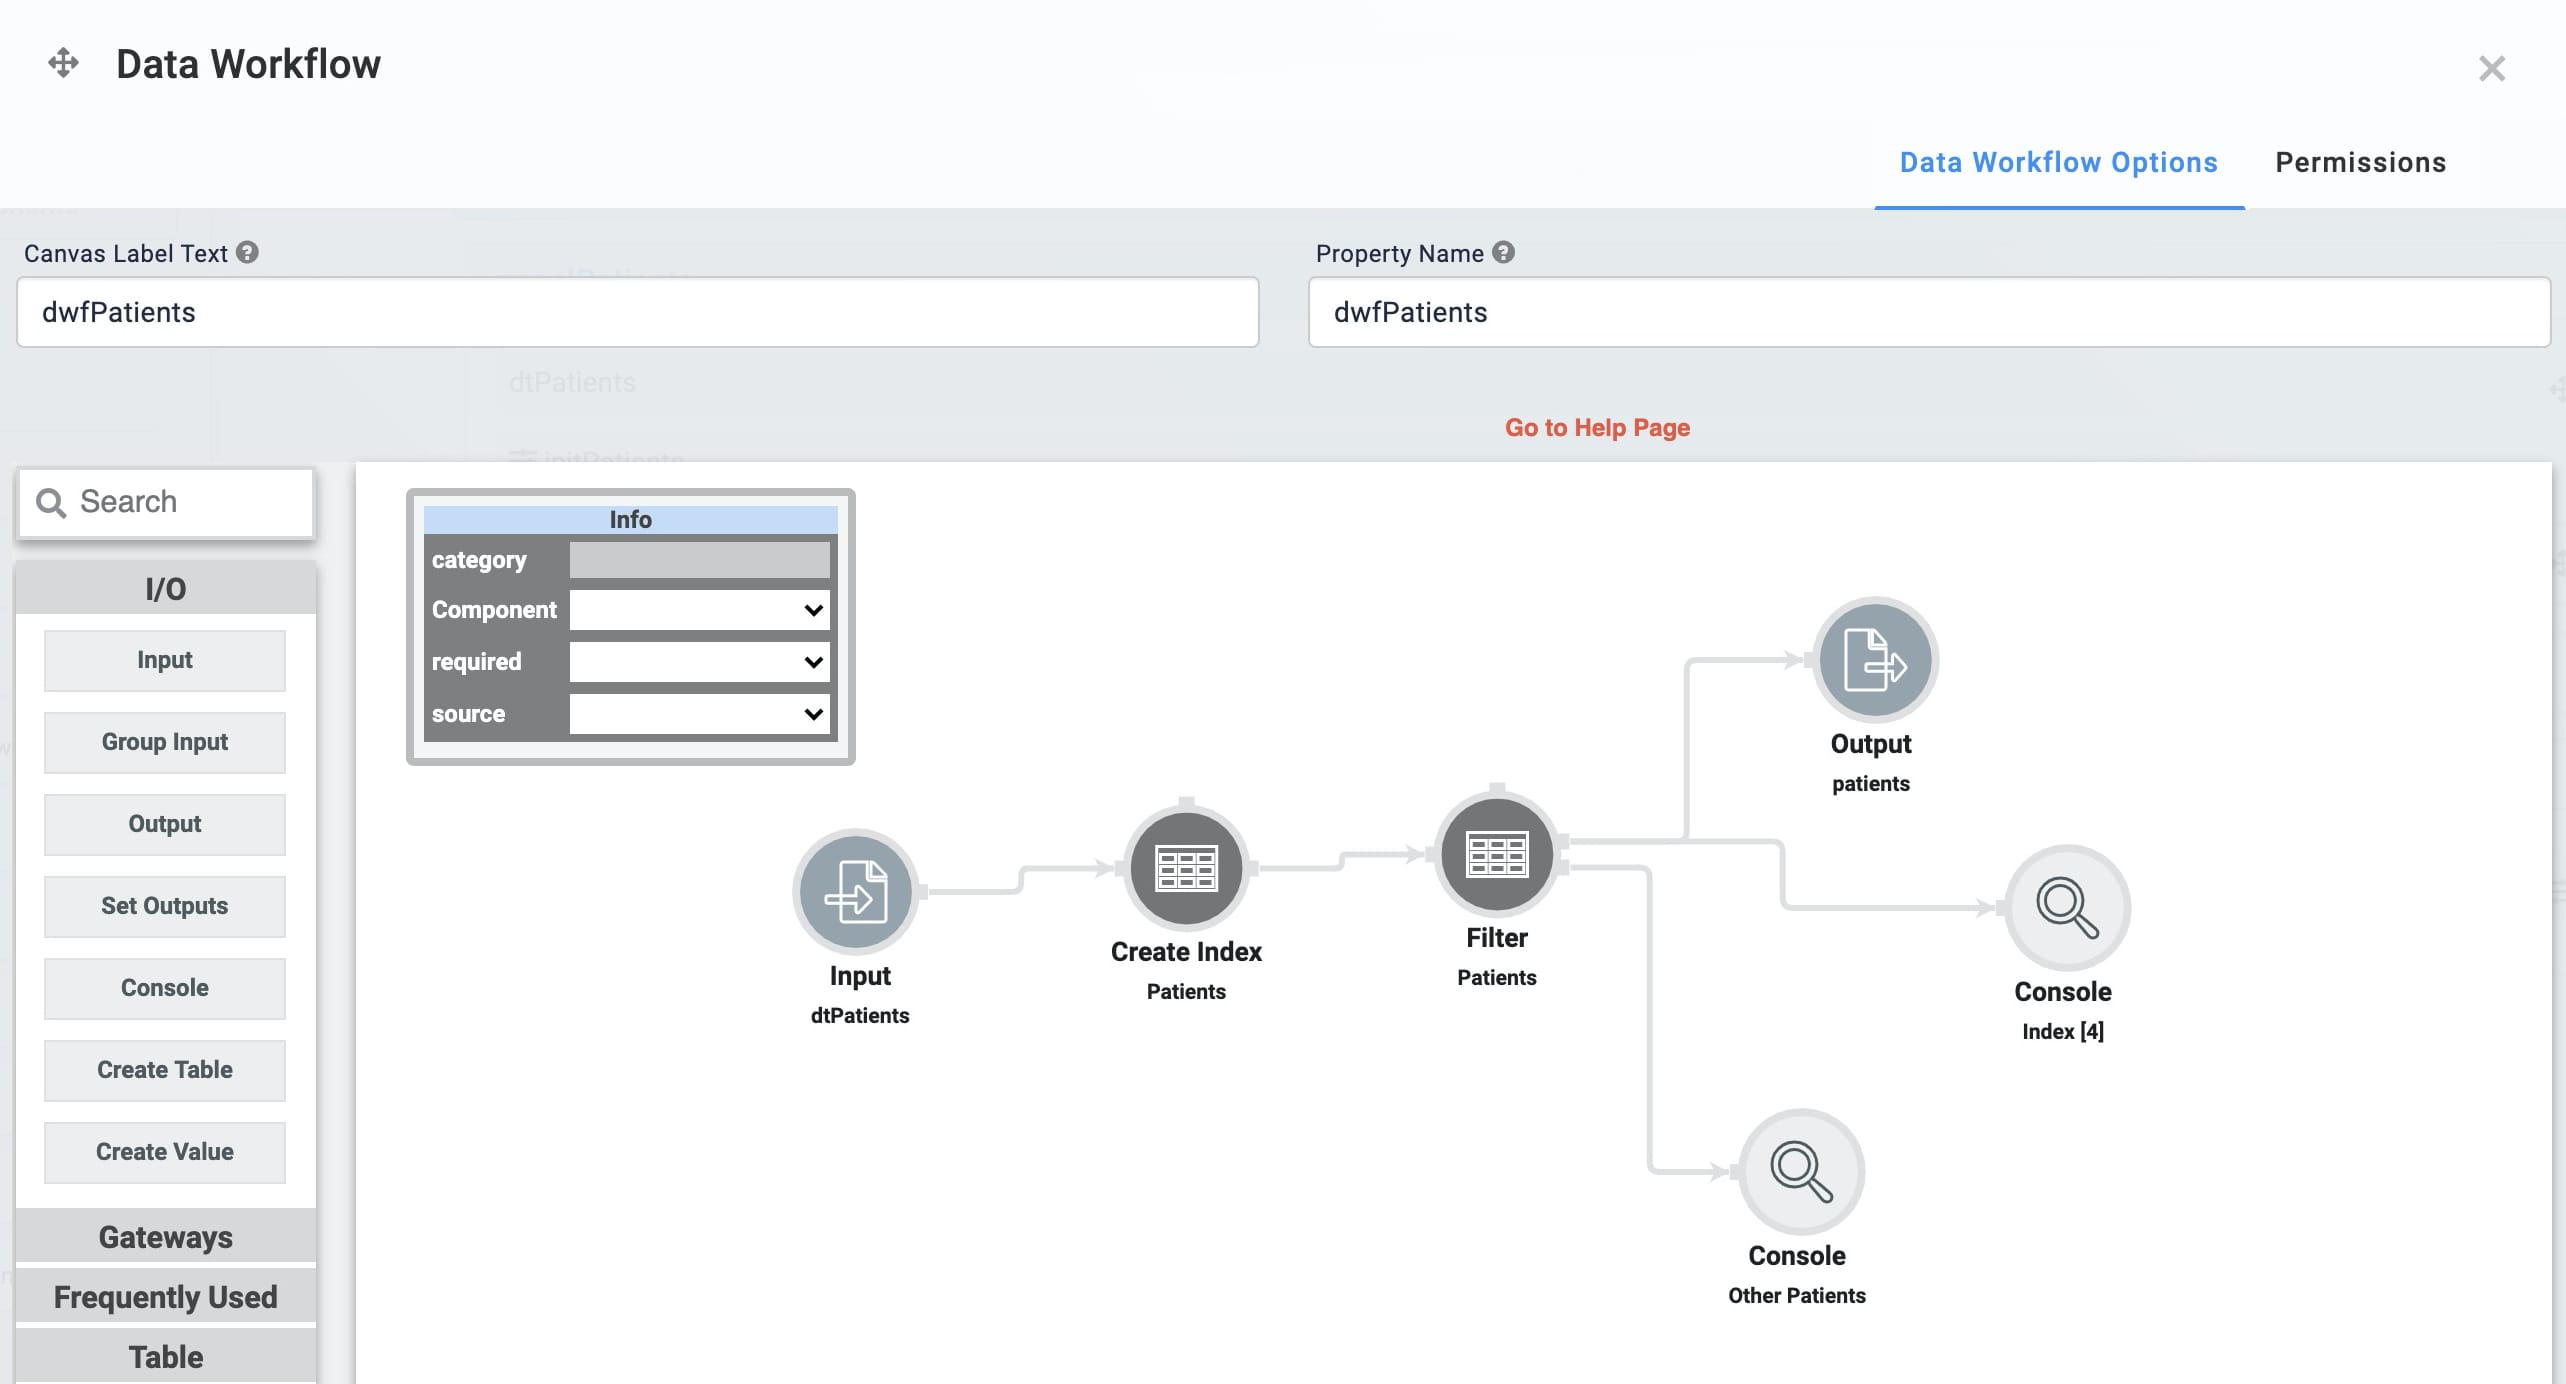
Configure the Data Workflow Component
Now, you'll set up your Data Workflow. You'll configure your Create Index operator to assign a chart number to each patient. You'll configure the operator to number each row starting with [1]. After that, you'll set up a Filter operator to filter a specific chart number and output it onto your dashboard. You can filter any index of your choosing. For this example, you'll configure the Data Workflow to filter chart number [4]. You'll also add a couple of Console operators to see the results of the Filter operator.
| 1. | Drag and drop a Data Workflow component onto your canvas. Place your Data Workflow below your ViewGrid component. |
| 2. | Enter dwfPatients in the Canvas Label Text and Property Name fields. |
Configure the First Input Operator
| 1. | Drag and drop an Input operator onto your Data Workflow canvas. |
| 2. | Configure the Input operator's Info window as follows: |
| Setting | Value |
|---|---|
|
Category |
Input |
|
Component |
dtPatients |
|
Required |
No |
|
Source |
Default |
Configure the Create Index Operator
| 1. | Drag and drop a Create Index operator onto your Data Workflow canvas. |
| 2. | Configure the Create Index operator's Info window as follows: |
| Setting | Value |
|---|---|
|
Category |
Create Index |
|
Label |
Patients |
|
Index Name |
index |
|
Starting Index |
1 |
|
Keys |
|
| 3. | Connect the output port (right) of the Input operator to the input port (left) of the Create Index operator. |
Configure the Filter Operator
| 1. | Drag and drop a Filter operator onto your Data Workflow canvas. |
| 2. | Configure the Filter operator's Info window as follows: |
| Setting | Value |
|---|---|
|
Category |
Filter |
|
Label |
Patients |
|
Do Not Sanitize Formula |
Checked (yes) |
|
Expression |
index=4 |
| 3. | Connect the output port (right) of the Create Index operator to the input port (left) of the Filter operator. |
Configure the Output Operator
| 1. | Drag and drop an Output operator onto your Data Workflow canvas. |
| 2. | Configure the Output operator's Info window as follows: |
| Setting | Value |
|---|---|
|
Category |
Output |
|
Component |
dtPatients |
|
Action |
value |
| 3. | Connect the upper output port (right) of the Filter operator to the input port (left) of the Output operator. |
Configure the First Console Operator
| 1. | Drag and drop a Console operator onto your Data Workflow canvas. |
| 2. | Configure the Console operator's Info window as follows: |
| Setting | Value |
|---|---|
|
Category |
Console |
|
Label |
Index [4] |
| 3. | Connect the upper output port (right) of the Filter operator to the input port (left) of the Console operator. |
Configure the Second Console Operator
| 1. | Drag and drop another Console operator onto your Data Workflow canvas. |
| 2. | Configure the Console operator's Info window as follows: |
| Setting | Value |
|---|---|
|
Category |
Console |
|
Label |
Other Patients |
| 3. | Connect the lower output port (right) of the Filter operator to the input port (left) of the Console operator. |
| 4. | Click Save. |
| 5. | Save your module. |
Now you can test out your Data Workflow. Because you set an index of [4], the fourth patient in your Data Table shows in Express View. The rest of the patients appear in the DevTools Console. Expand the Other Patients Console to see the rest of your Data Table. You'll also notice a unique chart number assigned to each patient.
Lab
You can view this complete use case here: https://training.unqork.io/#/form/604781e65746b2024161a236/edit.
