Overview
At times, it might be useful to take snapshot of a dashboard, or reference it outside of Unqork. Exporting your dashboard to a PDF file is a simple solution that can be achieved using a transform. Transforms let you format data sent out of Unqork and export it as a specific file type.
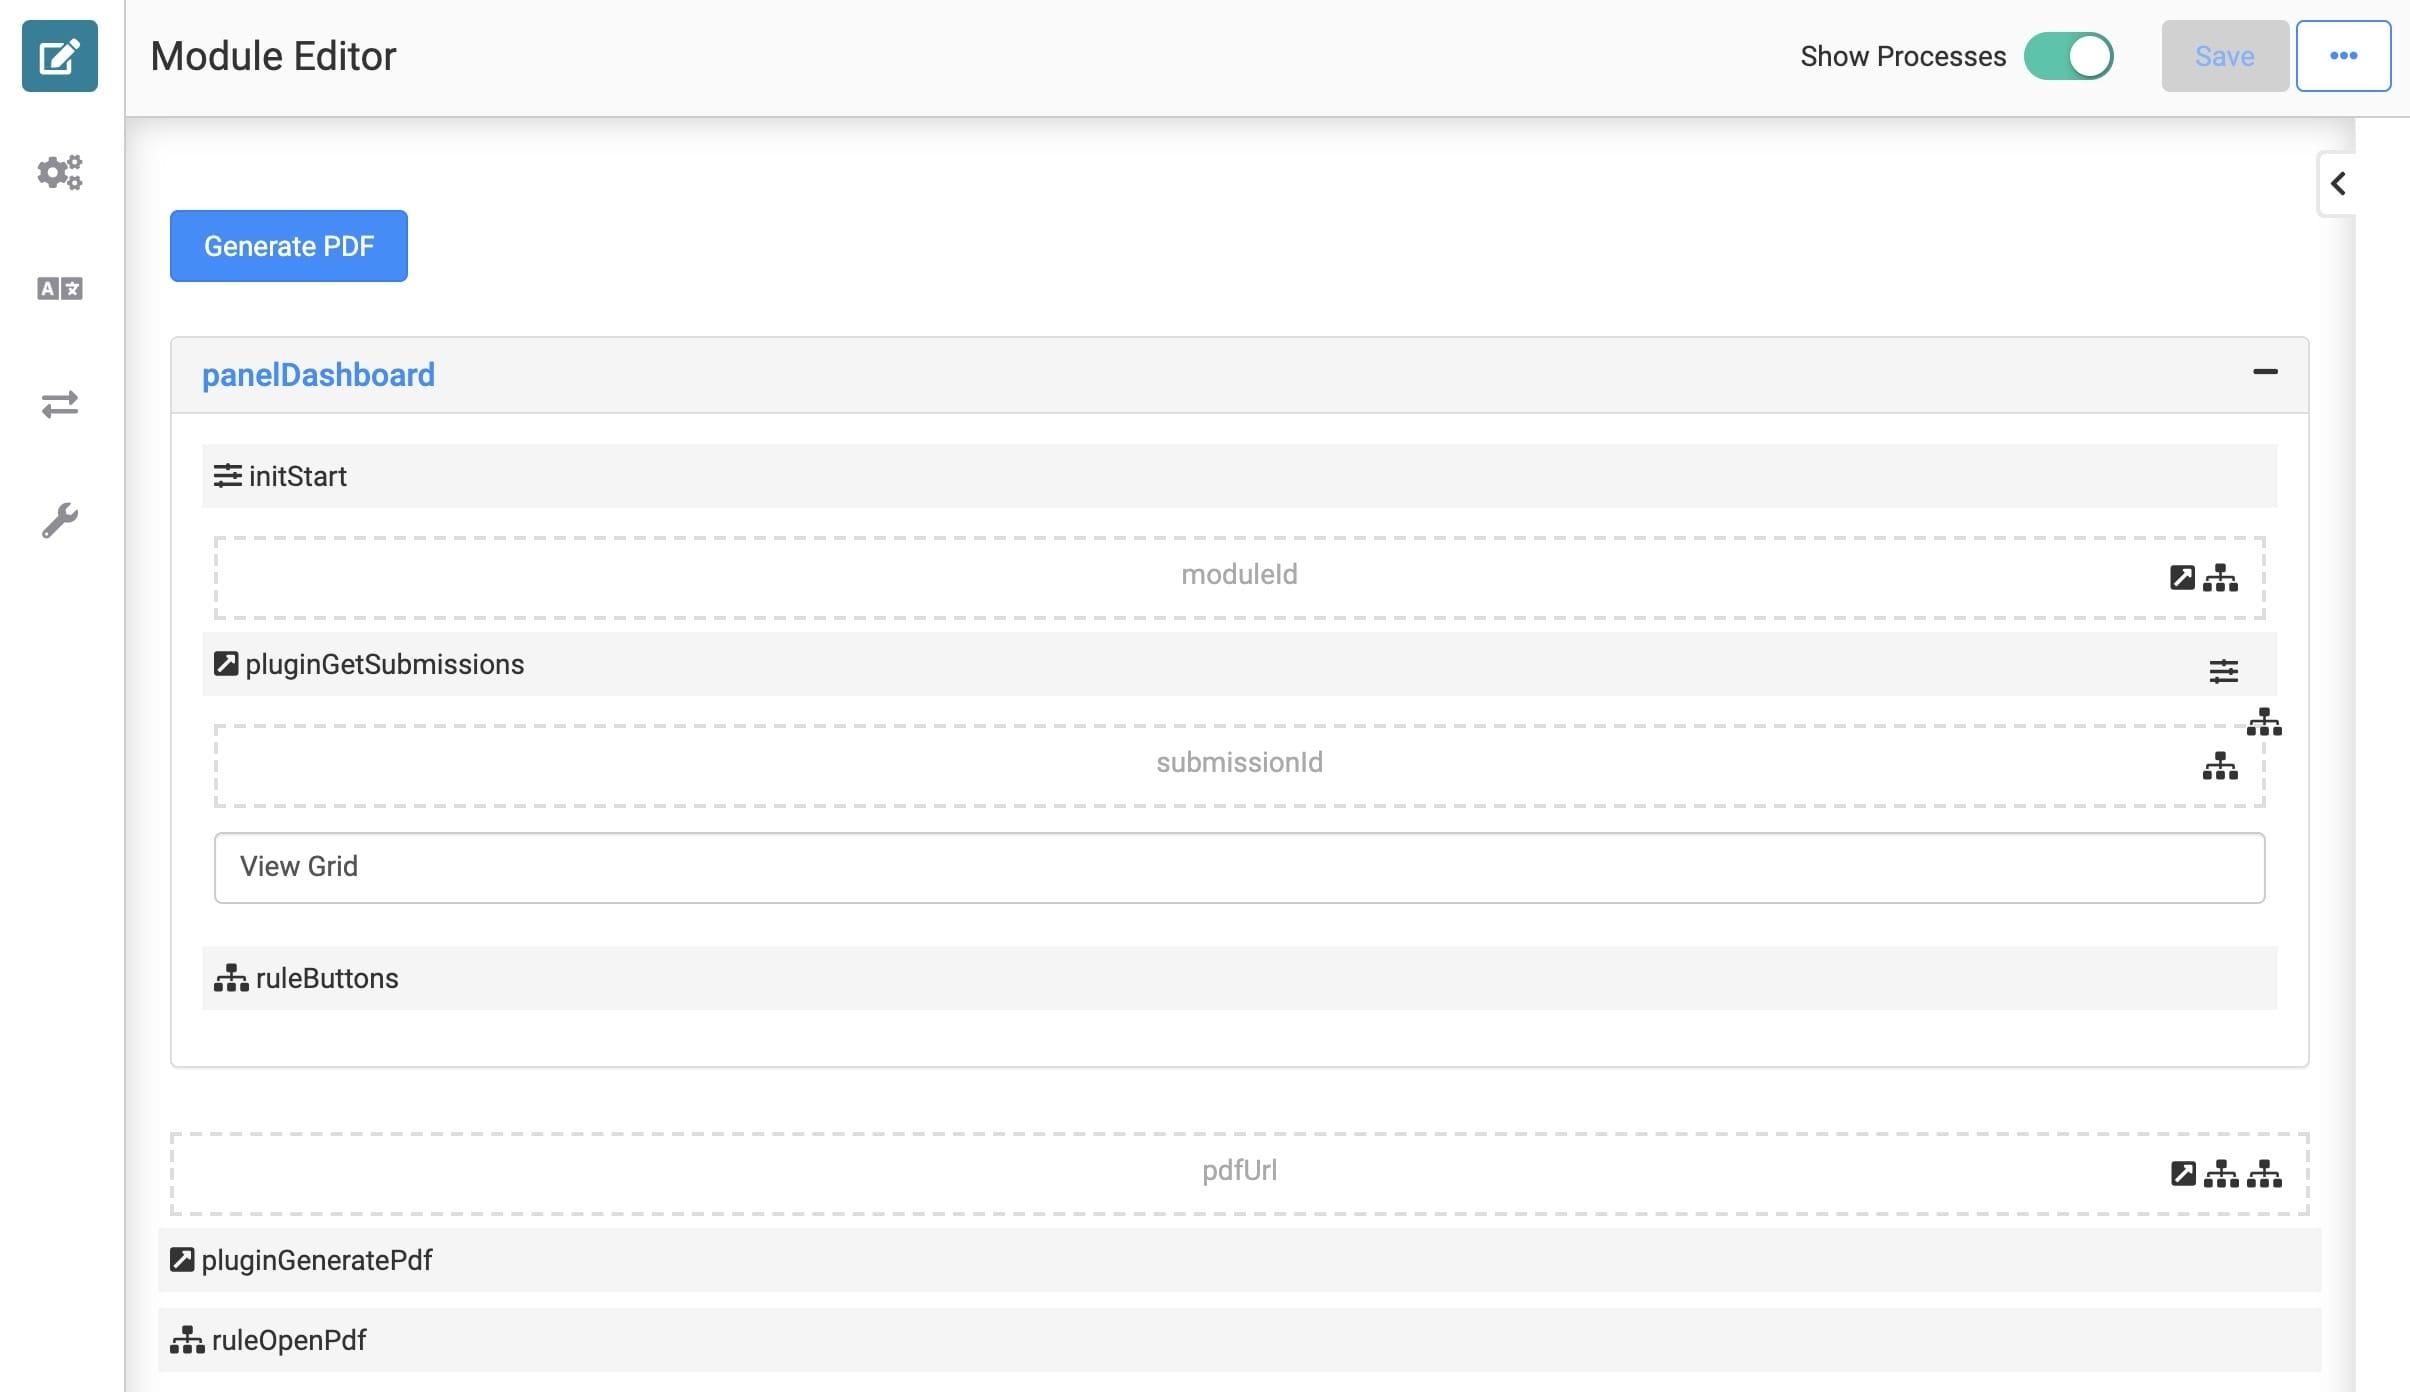
In this how-to guide, you'll use a Nunjucks PDF transform. Nunjucks is a JavaScript templating language that you can use to map the dashboard data to a PDF file. Then, you can configure a button to generate and open the PDF file.
Preconfiguration
Configure the Panel Component
This Panel component acts as a container for the components that follow.
In the Module Builder, drag and drop a Panel component onto your canvas.
In the Property ID field, enter panelDashboard.
Click Save Component.
Configure the Initializer Component
This Initializer component triggers the Plug-In components that configure in later steps.
Drag and drop an Initializer component inside your Panel component.
In the Property ID and Canvas Label Text fields, enter
initStart.Set the Trigger Type to New Submission.
To the right of Inputs & Outputs, click Edit.
Complete the Outputs table as follows:
Source
Type
Value
1
pluginGetSubmissions
trigger
GO
Click Save Component.
Configure the First Hidden Component
This is the first of two Hidden components in the preconfiguration. It houses the module ID of your source or submission module. You can locate the module ID from the source module’s hyperlink as follows: https://training.unqork.io/#/form/5eb482f3c8368d0210c74cbf/edit.
Drag and drop a Hidden component inside the Panel component, placing it below the Initializer component.
In the Property ID and Canvas Label Text fields, enter
moduleId.In the Default Value field, enter
5eb482f3c8368d0210c74cbf. This is the source module's module ID.Click Save Component.
Configure the Plug-In Component
This Plug-In components uses and API to retrieve the submissions so they can be displayed in your dashboard.
1Drag and drop a Plug-In component inside the Panel component, placing it below the moduleId Hidden component.
In the Property ID and Canvas Label Text fields, enter
plugGetSubmissions.From the Internal Services drop-down, select List Submissions for Dashboard.
To the right of Inputs & Outputs, click Edit.
Complete the Inputs table as follows:
Property ID
Mapping
1
moduleId
moduleId
2
'firstName,middleName,lastName,email,dateOfBirth'
fields
3
'investmentAmount,transferringBank'
fields
The first row references the module ID stored in the moduleId Hidden component. The second and third rows determine fields you'll retrieve to display in into the dashboard. For this example, you'll retrieve the firstName, middleName, lastName, email, dateOfBirth, investmentAmount, and transferringBank fields. The values entered in the Mapping column (moduleId and fields) are native values recognized by the Unqork Designer Platform.
Click Save Component.
Configure the Second Hidden Component
This Hidden component stores the submission ID.
Drag and drop a Hidden component inside the Panel component, placing it below your plugGetSubmissions Plug-In component.
In the Property ID and Canvas Label Text fields, enter
submissionId.Click Save Component.
Configure the ViewGrid Component
Next, configure a ViewGrid component to display the data in a dashboard in Express View.
Drag and drop a ViewGrid component inside the Panel component, placing it below your submissionId Hidden component.
In the Property ID field, enter
gridView.In the Canvas Label Text field, enter
View Grid.To the right of Inputs, Display & Outputs, click Edit.
Complete the Inputs table as follows:
Source
Required
1
pluginGetSubmissions
.png) (checked)
(checked)Complete the Outputs table as follows:
Source
Mapping
1
submissionId
id
Complete the Display table as follows:
ID
Heading
Button
1
firstName
First Name
☐ (unchecked)
2
lastName
Last Name
☐ (unchecked)
3
email
Email
☐ (unchecked)
4
investmentAmount
Investment Amount
☐ (unchecked)
5
transferringBank
Transferring Bank
☐ (unchecked)
6
ruleButtons
View
☐ (unchecked)
Navigate to the ViewGrid component's Actions settings.
In the Action field, enter
null.Click Save Component.
Configure the Decisions Component
This Decisions component provides the trigger for your dashboard's View button.
Drag and drop a Decisions component onto the canvas. Place it below your submissionId ViewGrid component.
In the Property ID and Canvas Label Text fields, enter
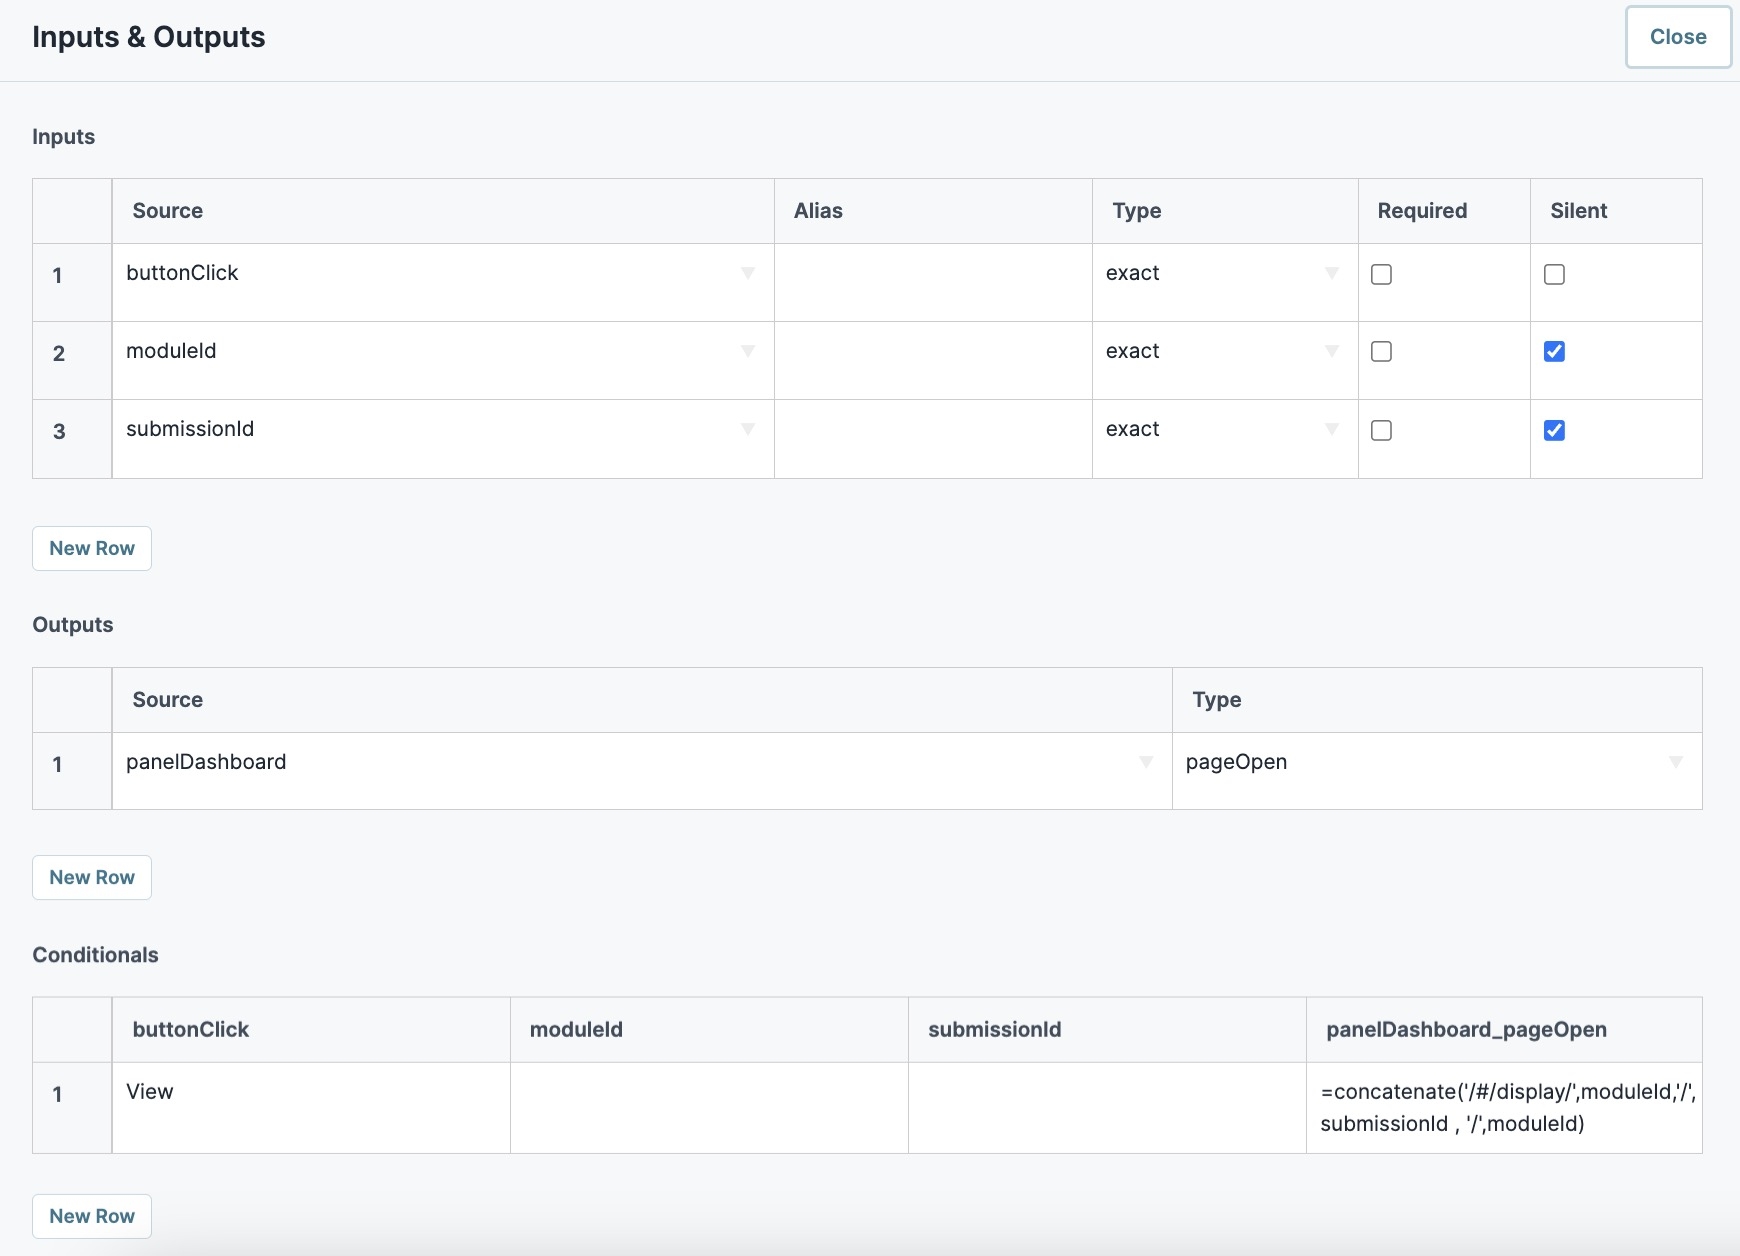
ruleButtons.To the right of Inputs & Outputs, click Edit.
Configure the Inputs table as follows:
Source
Type
Required
Silent
1
buttonClick
exact
☐ (unchecked)
☐ (unchecked)
2
moduleId
exact
☐ (unchecked)
.png) (checked)
(checked)3
submissionId
exact
☐ (unchecked)
.png) (checked)
(checked)Every row in the Inputs table gets an associated column in the Micro Decisions table. If an input does not have a value in its Micro Decisions column, Unqork sets it to silent. In the next steps, you are not required to add values to the moduleId and submissionId columns. You'll use these inputs in the panelDashboard_pageOpen Micro Decision. So, you'll set these values as silent, or let Unqork do it for you.
Complete the Outputs table as follows:
Source
Type
1
panelDashboard
pageOpen
Complete the Conditionals table as follows:
buttonClick
moduleId
submissionId
panelDashboard_pageOpen
View
=concatenate('/#/display/',moduleId,'/', submissionId , '/',moduleId)
Click Save Component.
Configuration
Set Up the Transform
Next, set up the transform that your Plug-In component uses to convert your ViewGrid component content into a PDF. You'll use a Nunjucks (NJK) PDF transform that includes custom CSS styling.
To the top right of the Module Builder, click the (ellipsis) button.
Select Transforms. You navigate to the Transforms page.
Click + Add New Transform.
In the Transform Name field, enter
PDF. You'll use this name to reference your transform in your module.Once created, you cannot change this name.
Under Direction of Transform, select
 Output.
Under Type of Transform, select
 NJK (PDF).
In the Transform field, copy and paste the following transform:
Comments on the transform are inside {# #} brackets. Text inside these brackets does not affect the transform or display in your PDF. It's there to explain the purpose of each section of the transform.
<!DOCTYPE html>
<html>
    <style>
    {# This style section sets the appearance of your PDF. You can use custom CSSstyling, or use what's shown. #}
        h1 {
            font-family: arial, sans-serif;
            color: #031a3a;
            }
        table {
            font-family: arial, sans-serif;
            border-collapse: collapse;
            width: 100%;
        }
        td {
            border: 1px solid #FFFFFF;
            text-align: left;
            padding: 8px;
        }
        th {
            border: 1px solid #FFFFFF;
            text-align: left;
            color: #FFFFFF;
            padding: 8px;
            background-color: #33768e;
        }
        tr:nth-child(odd) {
            background-color: #f0f3f7;
        }
    </style>
        <head>
        {# The line below is where you'll set the title that appears on your PDF. In this case, ViewGrid PDF. #}
            <h1>ViewGrid PDF</h1>
                <div>
                    <table>
                        <tr>
                            {# The section below is where you'll reference your dashboard's headings. They should correspond to the Headings column of your ViewGrid Display table. You can add new headings using the same format. #}
                            <th >First Name</th>
                            <th >Last Name</th>
                            <th >Investment Amount</th>
                            <th >Transferring Bank</th>
                            <th >Email</th>
                        </tr>
                            {# The line below references the data source of your dashboard. In this case, pluginGetSubmissions. This allows you to reference the properties that pluginGetSubmissions pulls in from your source module. #}
                            {% for item in data.pluginGetSubmissions %}
                        <tr >
                            {# The section below is where you'll reference the Property Names of the data in your dashboard. They should correspond to the ID column of your ViewGrid Display table. You can add new Properties using the same format. #}
                            <td>{{ item.firstName }}</td>
                            <td>{{ item.lastName }}</td>
                            <td>{{ item.investmentAmount }}</td>
                            <td>{{ item.transferringBank }}</td>
                            <td>{{ item.email }}</td>
                        </tr>
                            {% endfor %}
                    </table>
                </div>
</html>
Click Save. Your transform now displays under the Active Transforms list.
Click Close to return to the Module Builder.
Configure the Hidden Component
This Hidden component stores the URL where Unqork hosts your generated PDF.
Drag and drop a Hidden component onto your canvas, placing it below the panelDashboard Panel component.
In the Property ID and Canvas Label Text fields, enter
pdfUrl.Click Save Component.
Configure the Plug-In Component
This Plug-In component executes your transform and generates your PDF.
Drag and drop a Plug-In component onto your canvas, placing it below your pdfUrl Hidden component.
In the Property ID and Canvas Label Text fields, enter
pluginGeneratePdf.From the Internal Services drop-down, select Execute Transform with Input Data. The
/fbu/uapi/transformerendpoint displays in the Data Source URL field.Set the Request Type to Post.
To the right of Inputs & Outputs, click Edit.
Complete the Inputs table, as follows:
Property ID
Mapping
1
'PDF'
transformName
2
'5ebafff17b2213020fc9e897'
moduleId
3
_getData
data
The first row references the name of your transform. The second row is the module ID of the module where you added the transform. In this case, the transform is in the module Lab: Generate PDF from Dashboard Using Transform, found here: https://training.unqork.io/#/form/5ebafff17b2213020fc9e897/edit. The third row passes all of your module's data to the transform. Because your transform only references specific values, it only uses that data. Using _getData avoids needing to enter every Property ID that the transform references.
Complete the Outputs table as follows:
Property ID
Mapping
1
pdfUrl
pdfUrl
This mapping ensures the Plug-In component maps the URL, where Unqork hosts your generated PDF, to the pdfUrl Hidden component .
Click Save Component.
Configure the Button Component
Next, create a button for your dashboard. When an end-user clicks this button, it triggers the create PDF process.
Drag and drop a Button component onto your canvas, placing it above your panelDashboard Panel component.
In the Property ID field, enter
btnGeneratePdf.In the Label Text field, enter
Generate PDF.Set the Action Type to Event.
In the On Click field, enter or select pluginGeneratePdf.
In the Click Event field, enter
btnGeneratePdf.Click Save Component.
Configure the Decisions Component
Lastly, you'll set up the rule that opens your generated PDF in a new tab. Your PDF opens as soon as its URL displays in the pdfUrl Hidden component.
Drag and drop a Decisions component onto the canvas, placing it below your pluginGeneratePDF Plug-In component.
In the Property ID and Canvas Label Text, enter
ruleOpenPdf.Set the Trigger Type to Watch.
To the right of Inputs & Outputs, click Edit.
Complete the Inputs table as follows:
Source
Alias
Type
1
pdfURL
exact
Complete the Outputs table as follows:
Source
Type
1
pdfURL
pageOpen
Complete the Conditionals table as follows:
pdfURL
pdfURL_pageOpen
=pdfUrl
Click Save Component.
Save your module.
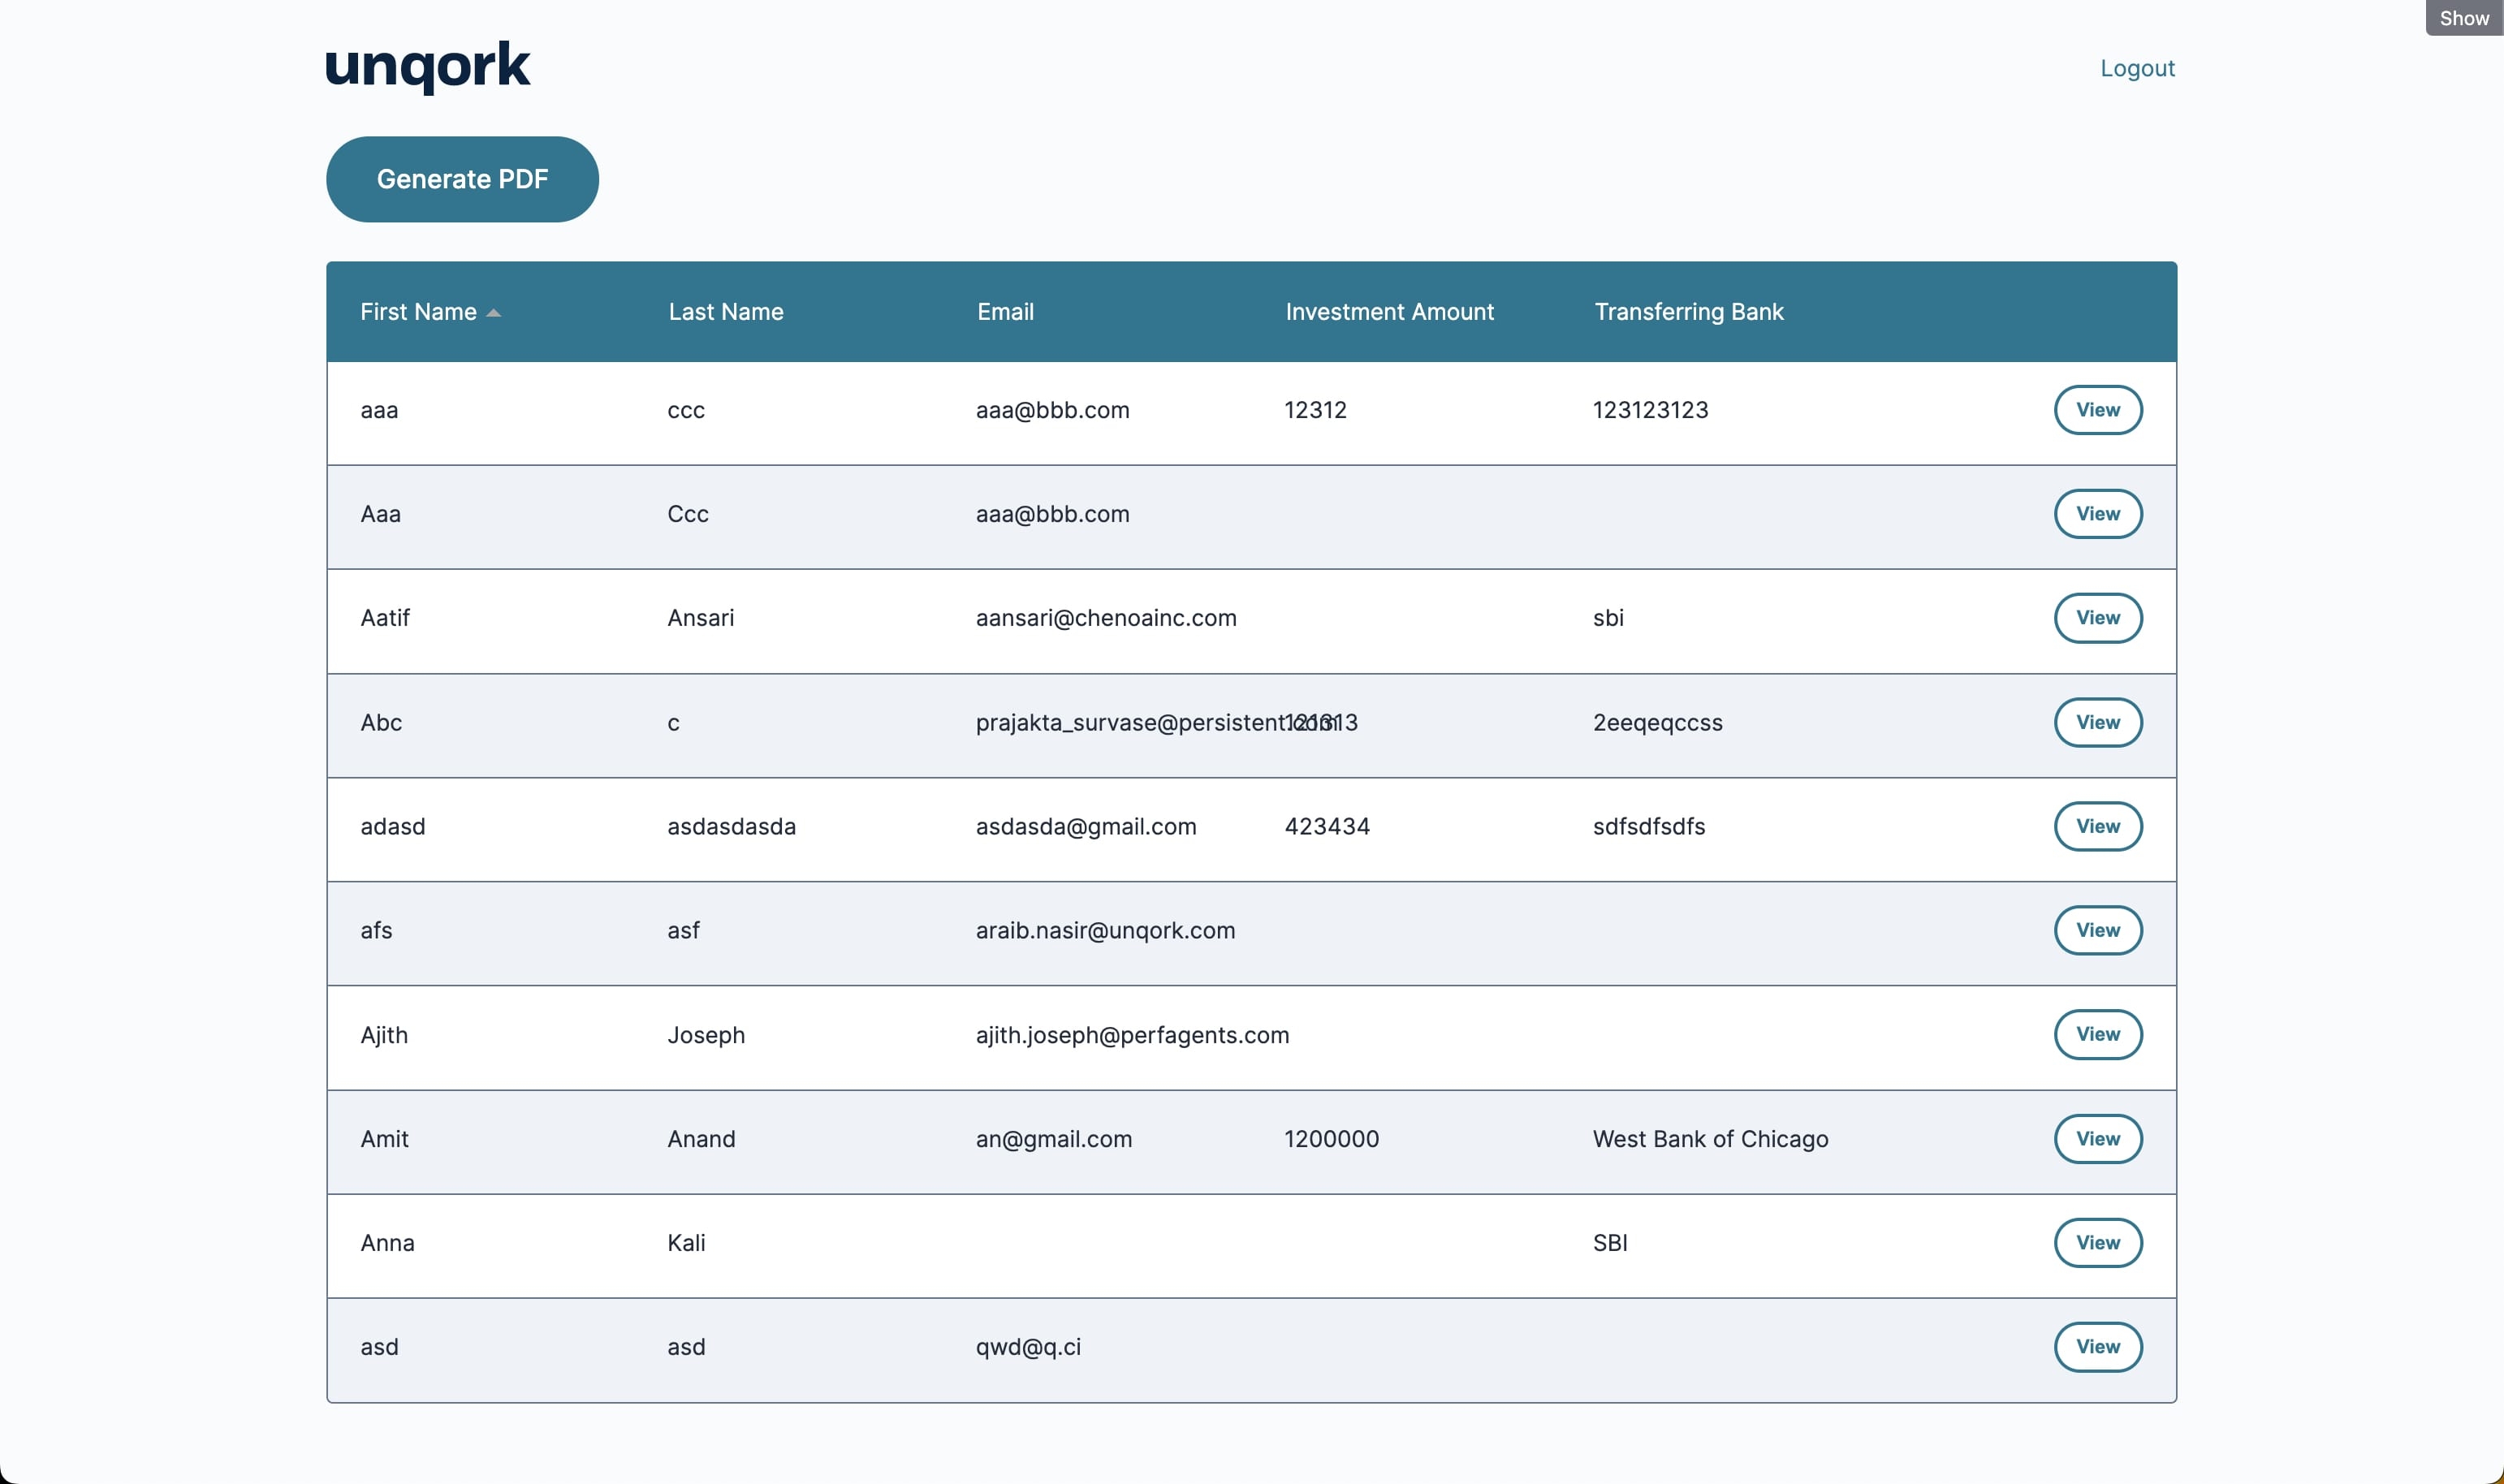
Here’s how your completed dashboard looks in Express View:
Here's how your PDF looks once created:

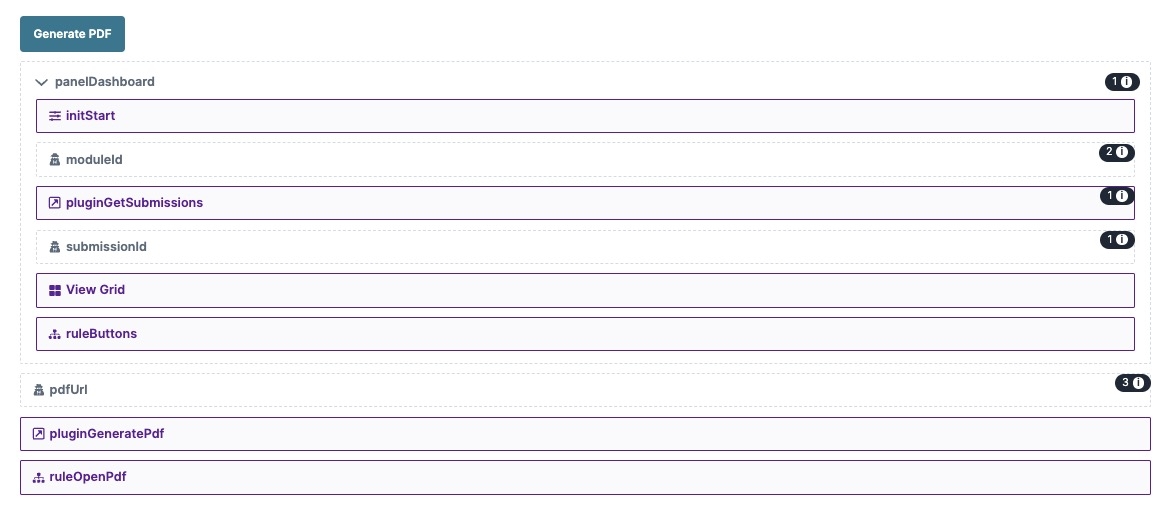
And here’s how your completed dashboard looks in the Module Builder:
Overview
At times, it might be useful to take snapshot of a dashboard, or reference it outside of Unqork. Exporting your dashboard to a PDF file is a simple solution that can be achieved using a transform. Transforms let you format data sent out of Unqork and export it as a specific file type.
In this how-to guide, you'll use a Nunjucks PDF transform. Nunjucks is a JavaScript templating language that you can use to map the dashboard data to a PDF file. Then, you can configure a button to generate and open the PDF file.
In this article, you'll learn how to use a transform to create a PDF version of your dashboard. You'll also learn how to create and configure a button trigger.
Preconfiguration
Configure the Panel Component
This Panel acts as a container for the components that follow.
In the Module Builder, drag and drop a Panel component onto your canvas.
In the Property ID field, enter panelDashboard.
Click Save & Close.
Configure the Initializer Component
This Initializer component triggers the Plug-In components that you set up later.
Drag and drop an Initializer component onto your canvas. Place your Initializer inside the Panel.
In the Property ID and Canvas Label Text fields, enter
initStart.Set the Trigger Type as New Submission.
In the Outputs table, set the following:
Property ID
Type
Value
1
pluginGetSubmissions
trigger
GO
.jpg)
Click Save & Close.
Configure the First Hidden Component
This is the first of two Hidden components in the preconfiguration. It houses the module ID of your source or submission module. You can pull the module ID from the source module’s hyperlink as follows: https://training.unqork.io/#/form/5eb482f3c8368d0210c74cbf/edit.
Drag and drop a Hidden component onto your canvas. Place your Hidden component below the Initializer.
In the Property ID and Canvas Label Text fields, enter
moduleId.In the Default Value field, enter
5eb482f3c8368d0210c74cbf. This is the source module's module ID.Click Save & Close.
Configure the Plug-In Component
This Plug-In connects your module to the outside world. To make this connection, you use an API (application programming interface) call. This Plug-In gets the submissions that display in your dashboard.
Drag and drop a Plug-In component onto your canvas. Place your Plug-In below the moduleId Hidden component.
In the Property ID and Canvas Label Text fields, enter
plugGetSubmissions.From the Internal Services drop-down, select
List Submissions for Dashboard.In the Inputs table, enter the following:
Property ID
Mapping
1
moduleId
moduleId
2
'firstName,middleName,lastName,email,dateOfBirth'
fields
3
'investmentAmount,transferringBank'
fields
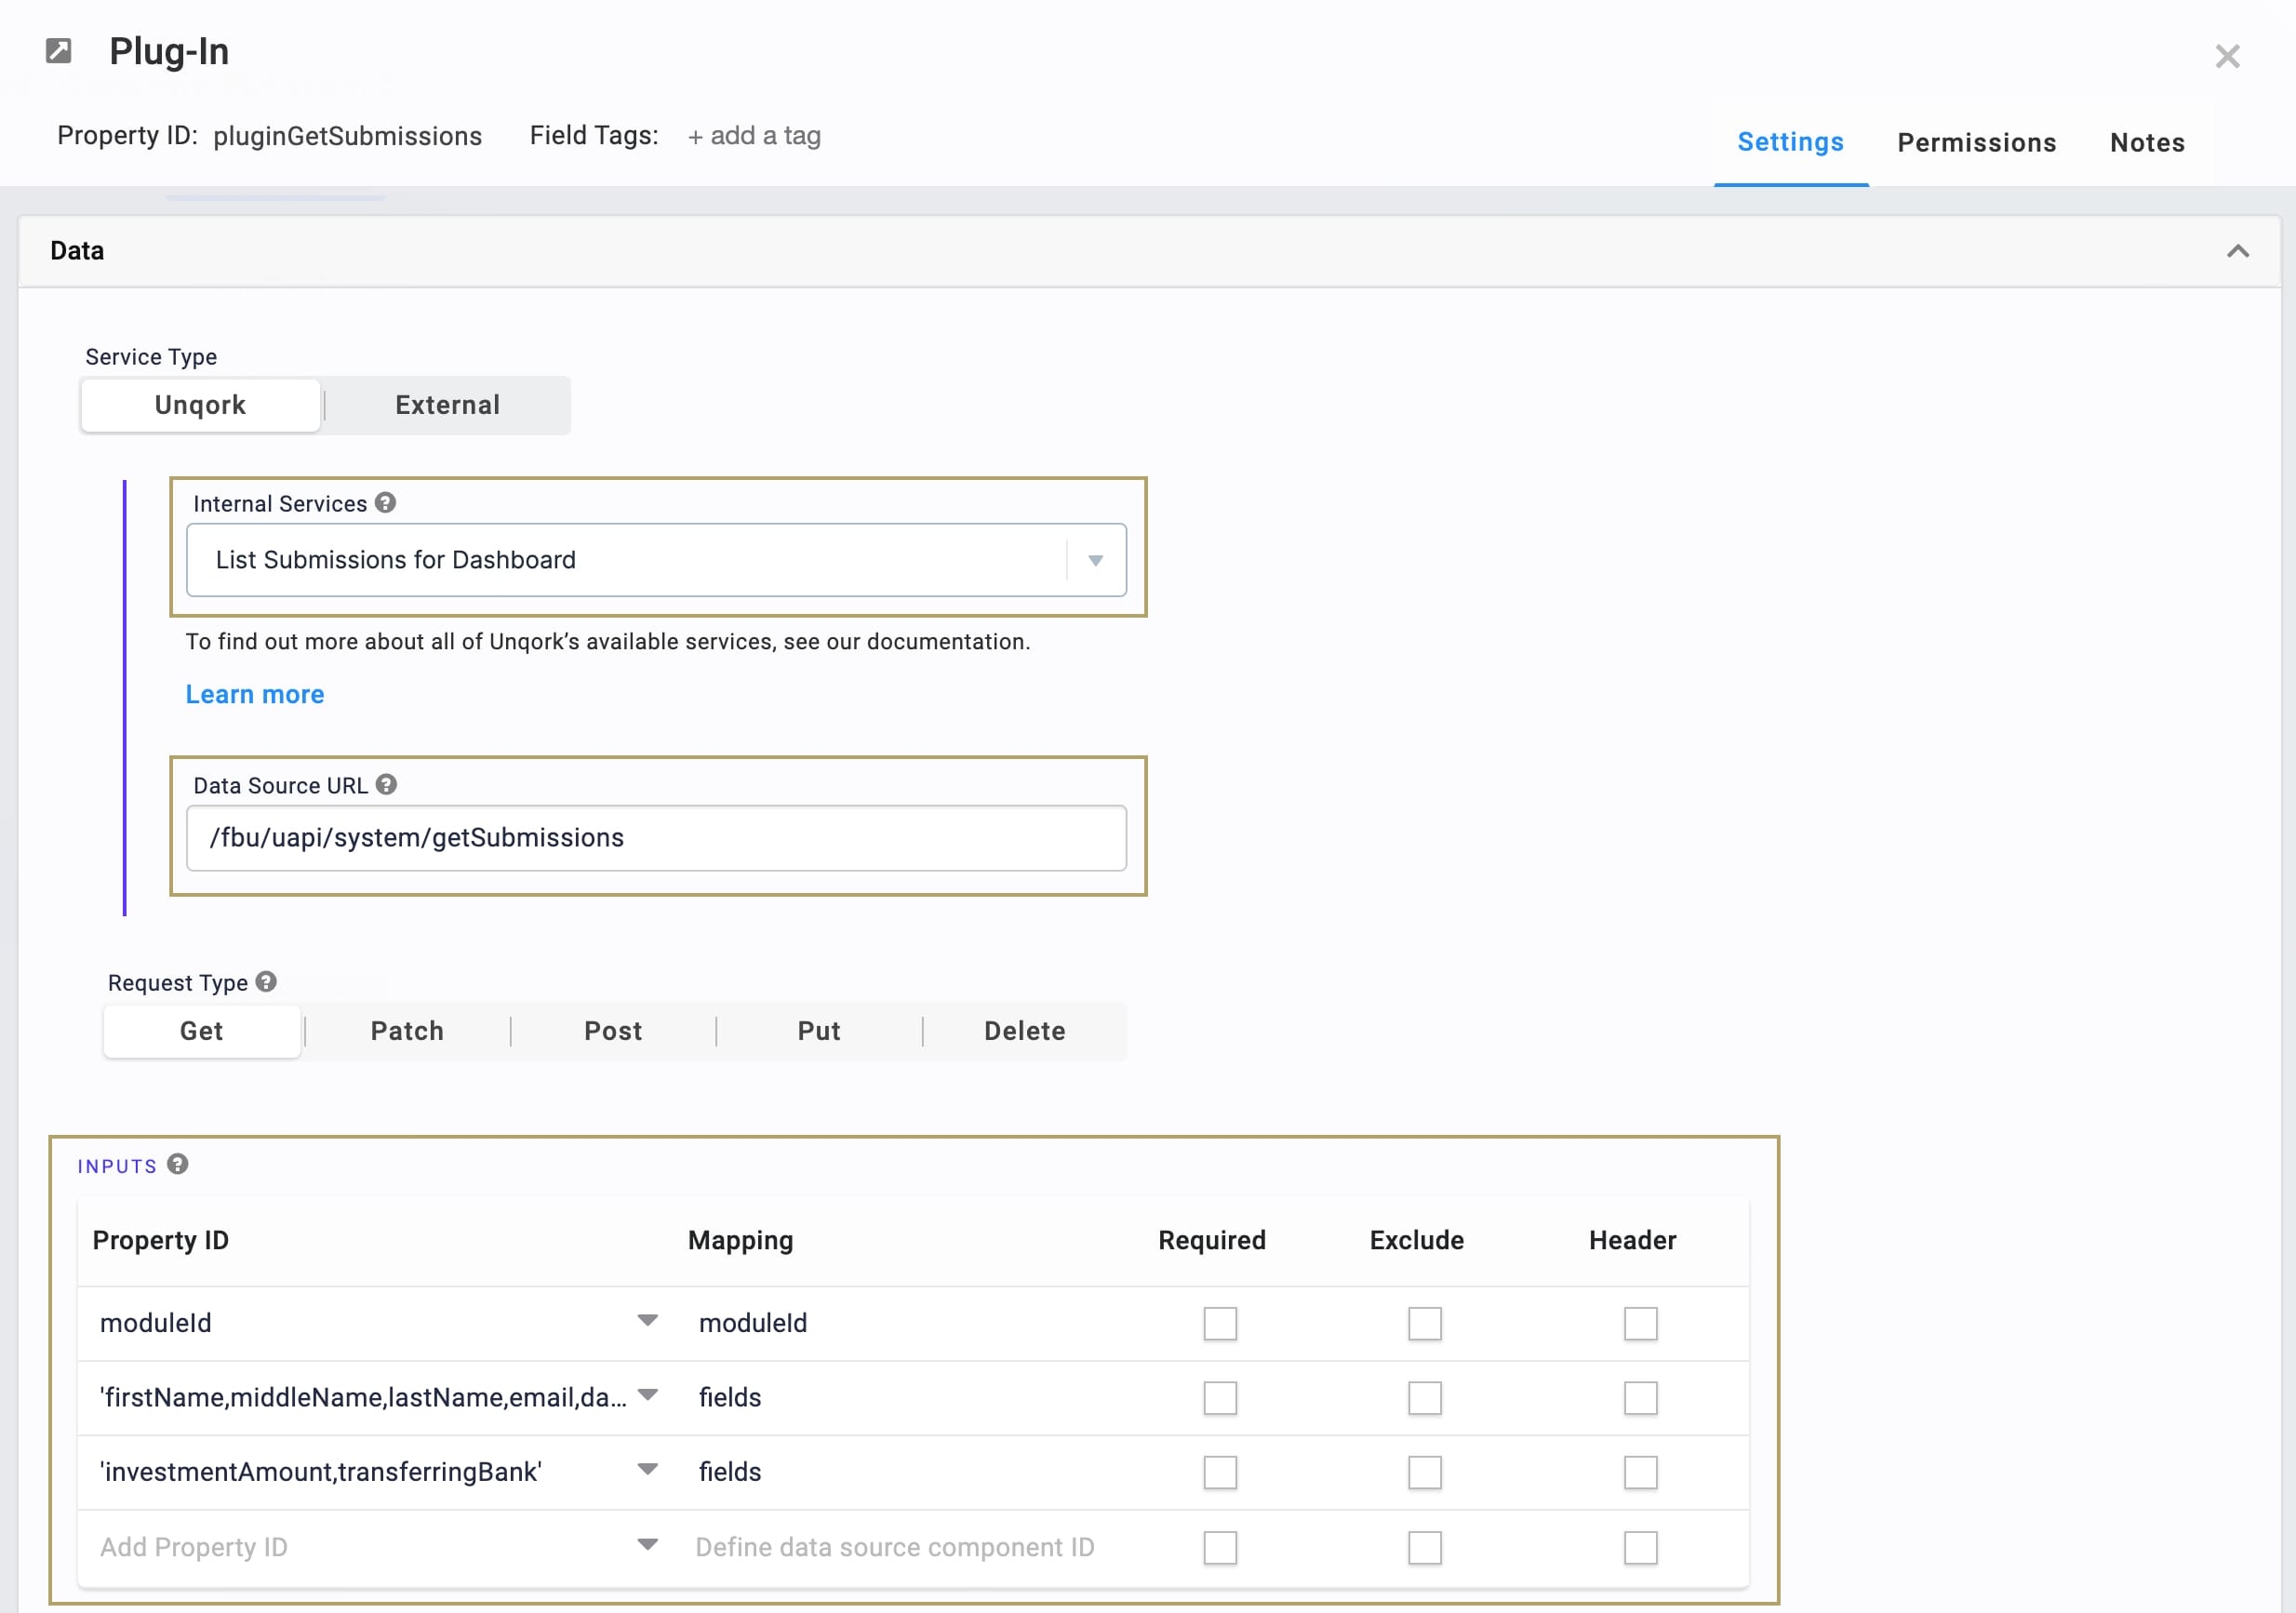
The first row references the module ID stored in the moduleId Hidden component. The second and third rows show which fields you're pulling into the dashboard. Here, you pull the firstName, middleName, lastName, email, dateOfBirth, investmentAmount, and transferringBank fields. The values entered in the Mapping column (moduleId and fields) are native values recognized by the Unqork Designer Platform. Add these as shown.
Click Save.
Configure the Second Hidden Component
This is the last Hidden component in the preconfiguration. This component houses the submission ID.
Drag and drop a Hidden component onto your canvas. Place your Hidden component below your plugGetSubmissions Plug-In.
In the Property ID and Canvas Label Text fields, enter
submissionId.Click Save & Close.
Configure the ViewGrid Component
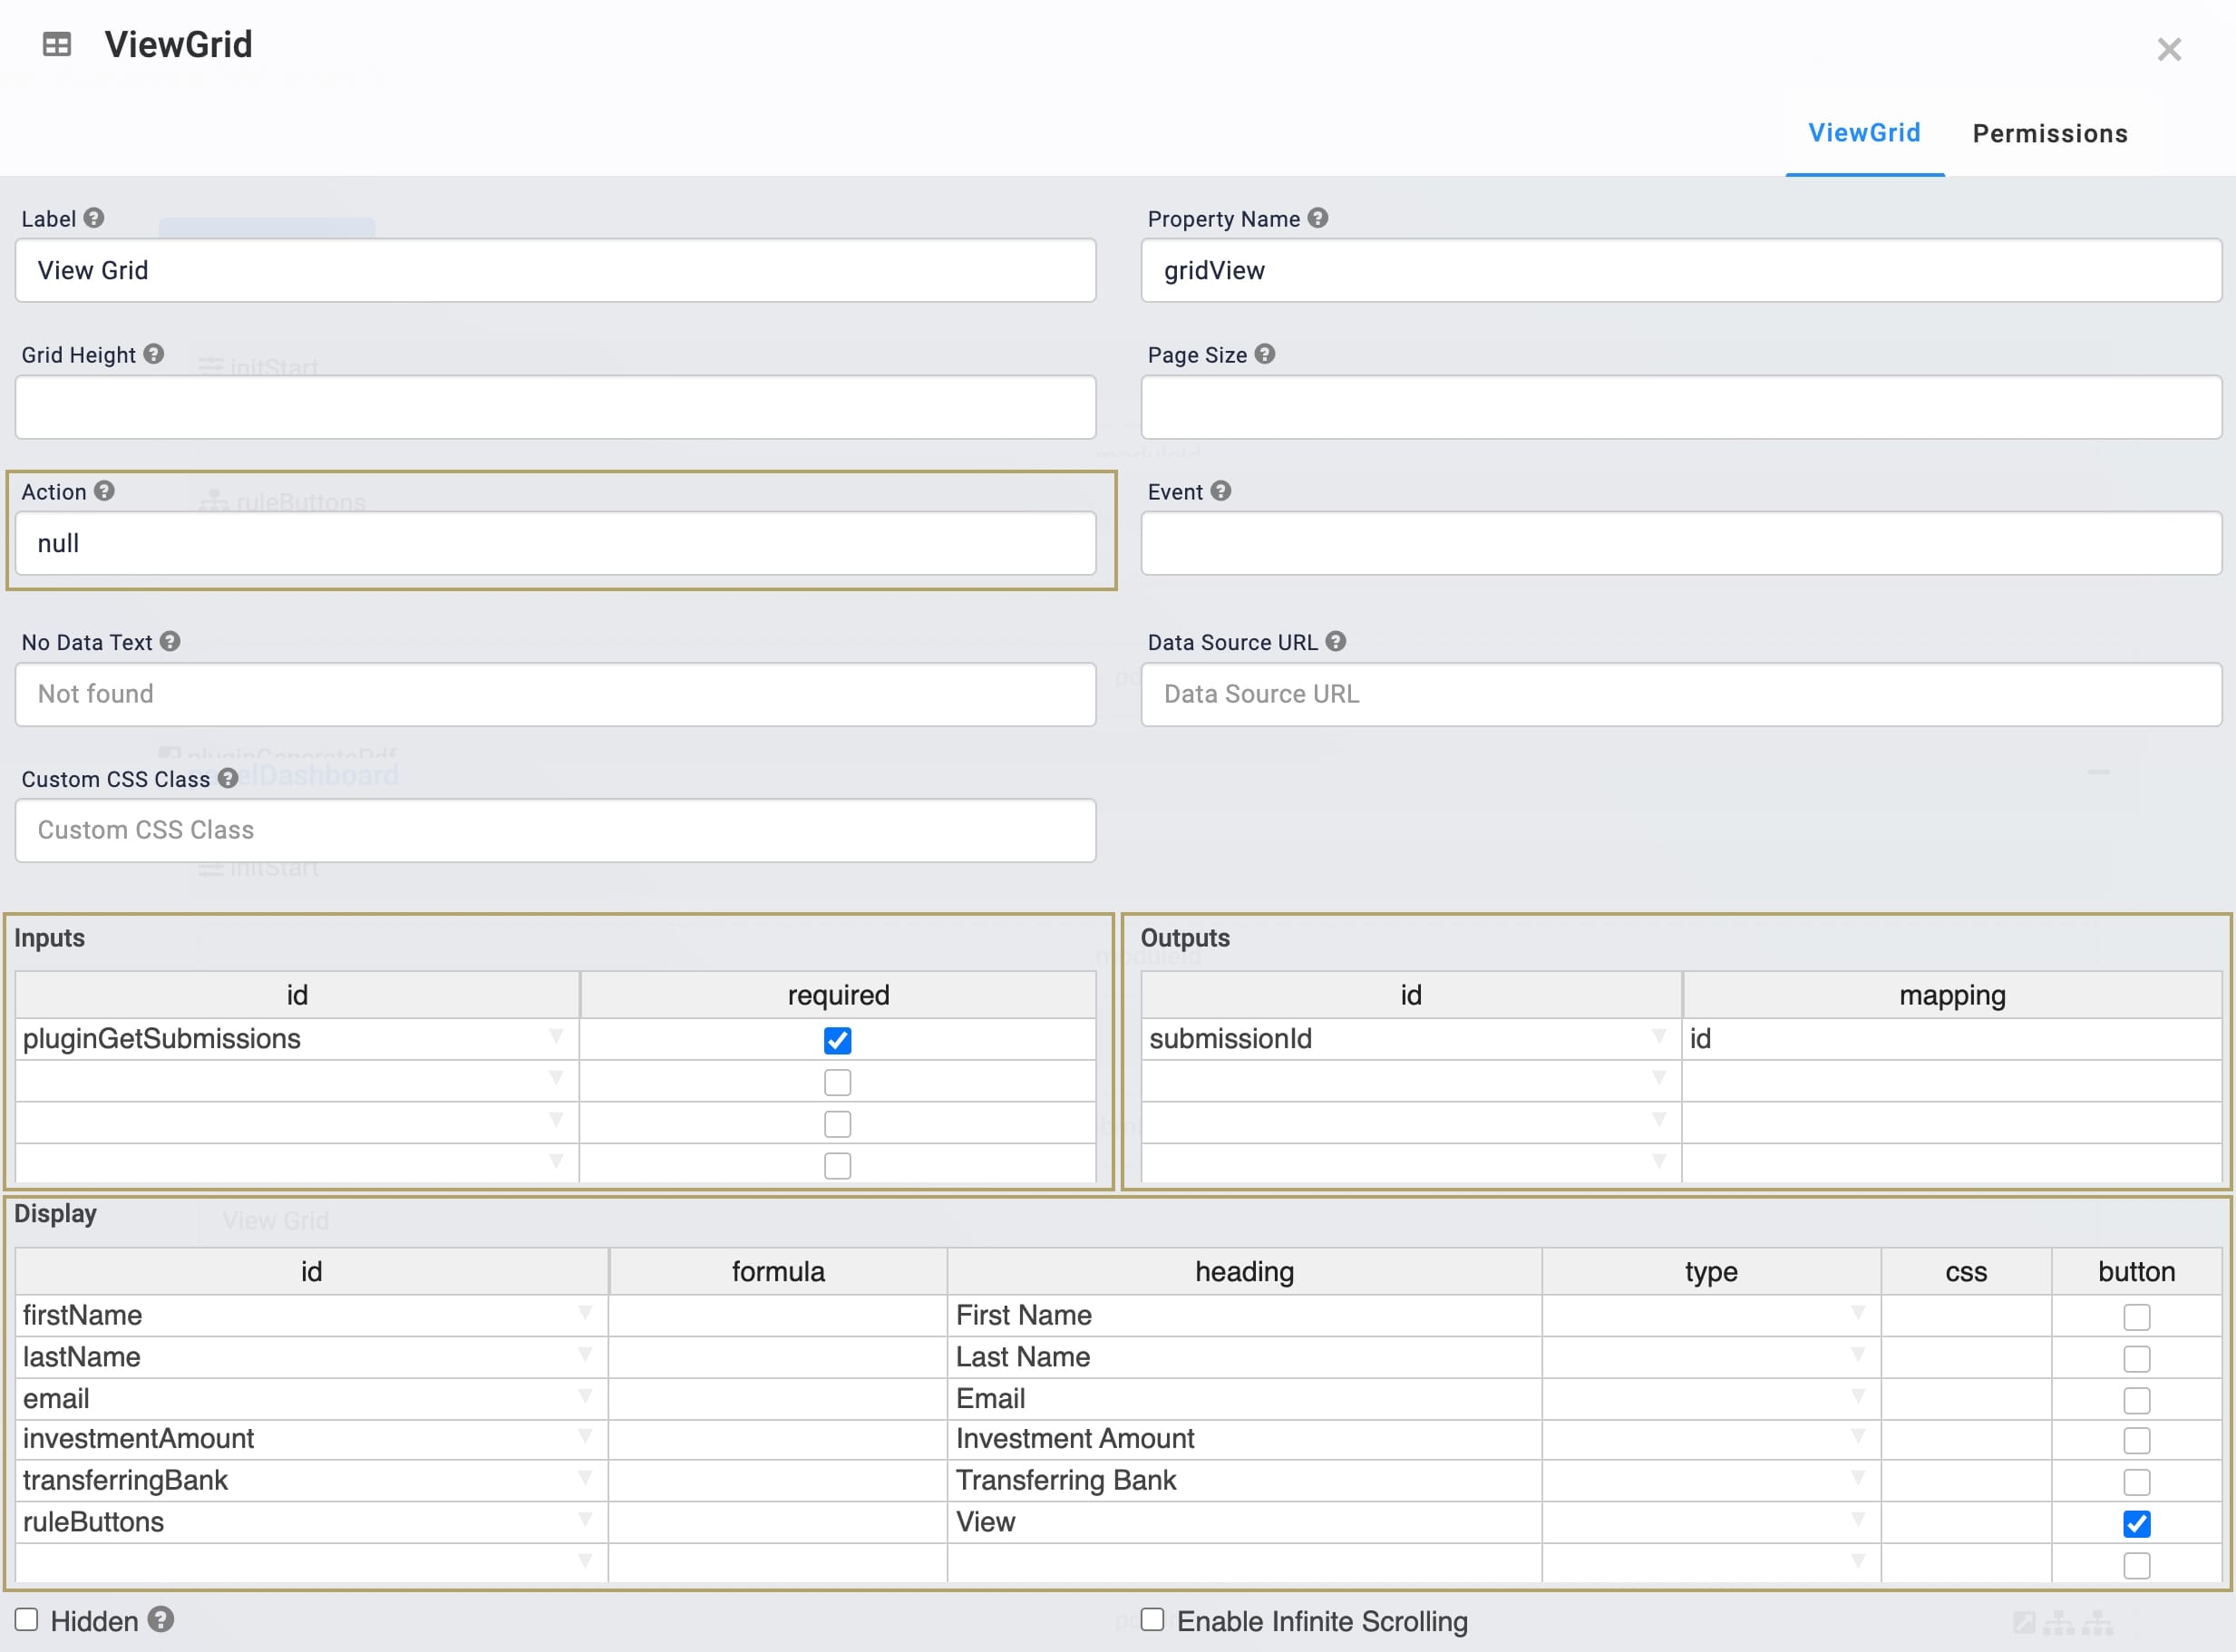
Next, bring in a ViewGrid component to display your dashboard.
Drag and drop a ViewGrid component onto the canvas. Place your ViewGrid below the submissionId Hidden component.
In the Label field, enter
View Grid.In the Property Name field, enter
gridView.In the Action field, enter
null.Configure the Inputs table as follows:
ID
Required
pluginGetSubmissions
Yes (selected)
Configure the Outputs table as follows:
ID
Mapping
submissionId
id
Configure the Display table as follows:
ID
Heading
Button
firstName
First Name
Clear
lastName
Last Name
Clear
email
Email
Clear
investmentAmount
Investment Amount
Clear
transferringBank
Transferring Bank
Clear
ruleButtons
View
Selected
Click Save.
Configure the Decisions Component
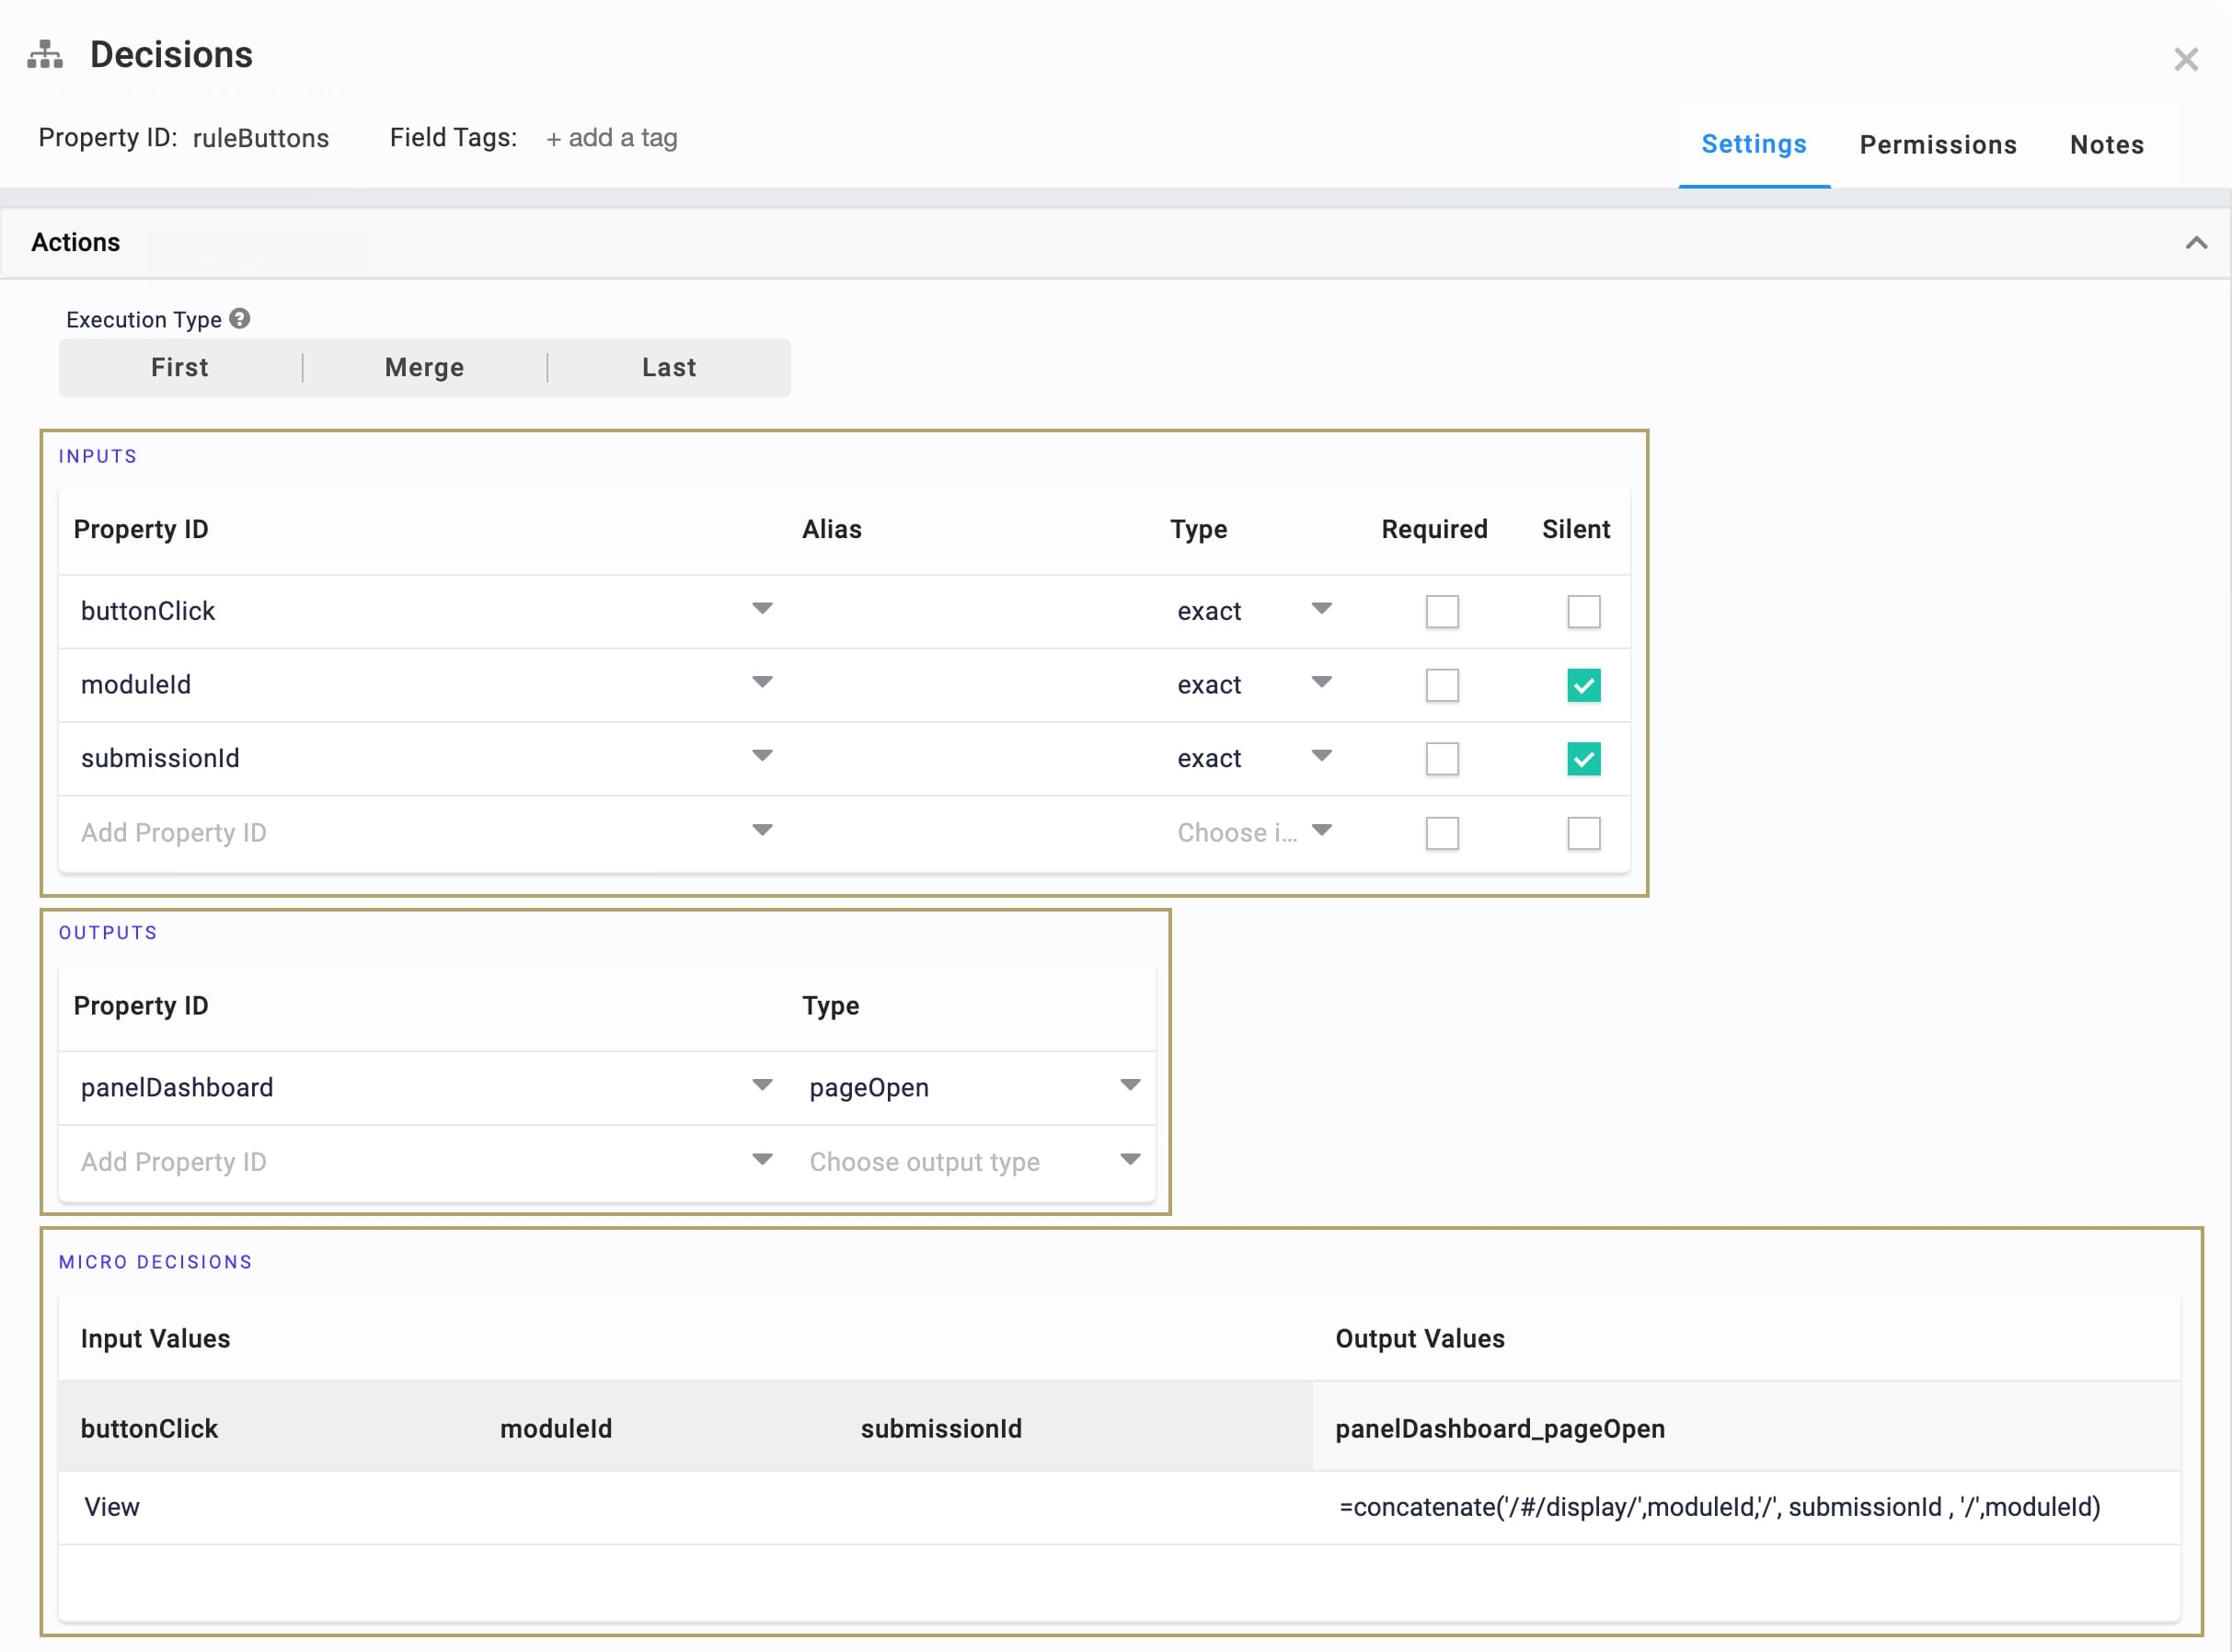
This Decisions component provides the trigger for your dashboard's View button.
Drag and drop a Decisions component onto the canvas. Place it below your submissionId ViewGrid component.
In the Property ID and Canvas Label Text fields, enter
ruleButtons.Configure the Inputs table as follows:
Property ID
Type
Required
Silent
buttonClick
exact
No (clear)
No (clear)
moduleId
exact
No (clear)
Yes (selected)
submissionId
exact
No (clear)
Yes (selected)
Every row in the Inputs table gets an associated column in the Micro Decisions table. If an input doesn't have a value in its Micro Decisions column, Unqork sets it to silent. In the next steps, you won't add values to the moduleId and submissionId columns. You only use these inputs in the panelDashboard_pageOpen micro decision. So, you can mark these values as silent, or let Unqork do it for you.
Configure the Outputs table as follows:
Property ID
Type
panelDashboard
pageOpen
In the Micro Decisions table, enter the following:
buttonClick
moduleId
submissionId
panelDashboard_pageOpen
View
=concatenate('/#/display/',moduleId,'/', submissionId , '/',moduleId)
Click Save & Close.
Configuration
Set Up the Transform
Next, set up the transform that your Plug-In component uses to turn your ViewGrid content into a PDF. Here, you're using a Nunjucks (NJK) PDF transform. The transform script includes custom CSS styling.
Hover over the left sidebar menu of the Module Builder.
Click the
.png) (Transforms) button to open the Transforms page.
(Transforms) button to open the Transforms page.In the Enter Transform Name field, enter PDF.
In the Direction of Transform options, select Output.
In the Type of Transform options, select NJK (PDF) .
In the Create New Transform Below field, copy and paste the following transform:
Comments on the transform are inside {# #} brackets. Text inside these brackets don't affect the transform or display in your PDF. It's there to explain the purpose of each section of the transform.
<!DOCTYPE html>
<html>
    <style>
    {# This style section sets the appearance of your PDF. You can use custom CSSstyling, or use what's shown. #}
        h1 {
            font-family: arial, sans-serif;
            color: #031a3a;
            }
        table {
            font-family: arial, sans-serif;
            border-collapse: collapse;
            width: 100%;
        }
        td {
            border: 1px solid #FFFFFF;
            text-align: left;
            padding: 8px;
        }
        th {
            border: 1px solid #FFFFFF;
            text-align: left;
            color: #FFFFFF;
            padding: 8px;
            background-color: #33768e;
        }
        tr:nth-child(odd) {
            background-color: #f0f3f7;
        }
    </style>
        <head>
        {# The line below is where you'll set the title that appears on your PDF. In this case, ViewGrid PDF. #}
            <h1>ViewGrid PDF</h1>
                <div>
                    <table>
                        <tr>
                            {# The section below is where you'll reference your dashboard's headings. They should correspond to the Headings column of your ViewGrid Display table. You can add new headings using the same format. #}
                            <th >First Name</th>
                            <th >Last Name</th>
                            <th >Investment Amount</th>
                            <th >Transferring Bank</th>
                            <th >Email</th>
                        </tr>
                            {# The line below references the data source of your dashboard. In this case, pluginGetSubmissions. This allows you to reference the properties that pluginGetSubmissions pulls in from your source module. #}
                            {% for item in data.pluginGetSubmissions %}
                        <tr >
                            {# The section below is where you'll reference the Property Names of the data in your dashboard. They should correspond to the ID column of your ViewGrid Display table. You can add new Properties using the same format. #}
                            <td>{{ item.firstName }}</td>
                            <td>{{ item.lastName }}</td>
                            <td>{{ item.investmentAmount }}</td>
                            <td>{{ item.transferringBank }}</td>
                            <td>{{ item.email }}</td>
                        </tr>
                            {% endfor %}
                    </table>
                </div>
</html>
Click Add Transform. Your transform now displays under the Active Transforms list.
Configure the Hidden Component
This is the third Hidden component in the configuration. It houses the URL where Unqork hosts your generated PDF.
Return to the Module Builder.
Drag and drop a Hidden component onto your canvas. Place your Hidden component below the panelDashboard Panel.
In the Property ID and Canvas Label Text fields, enter
pdfUrl.Click Save & Close.
Configure the Plug-In Component
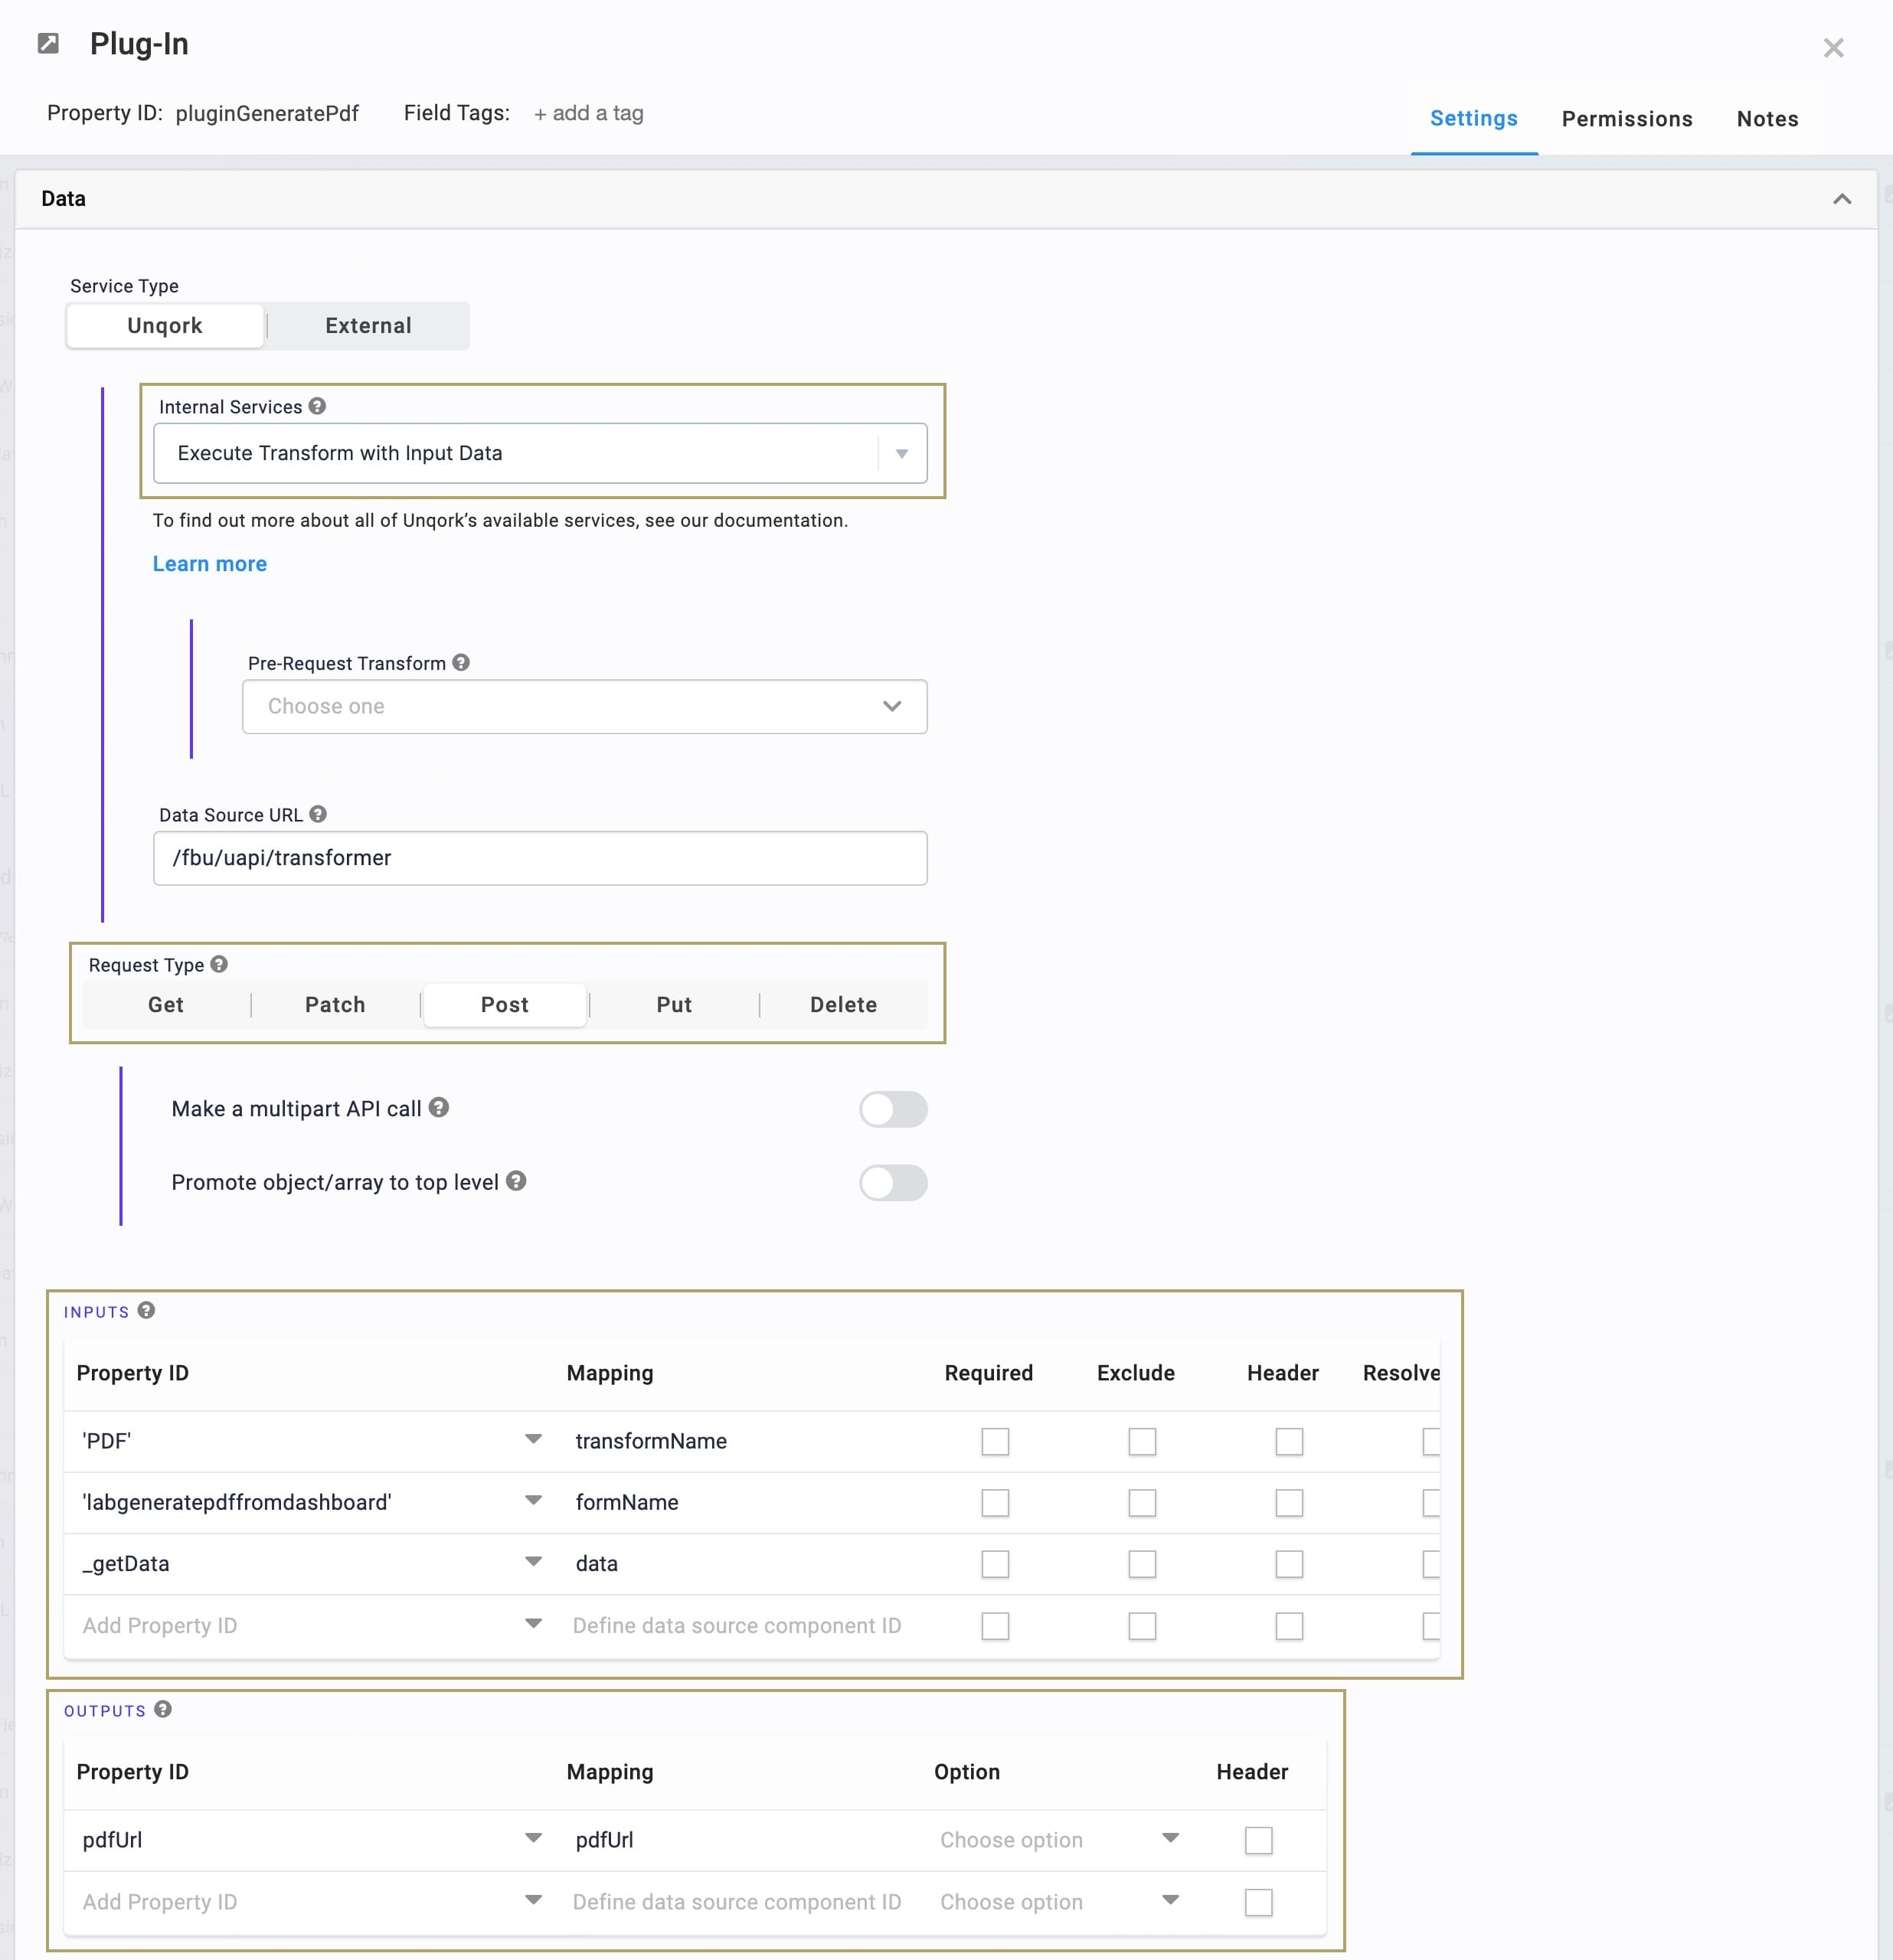
This Plug-In executes your transform and generates your PDF.
Drag and drop a Plug-In component onto your canvas. Place your Plug-In below the pdfUrl Hidden component.
In the Property ID and Canvas Label Text fields, enter
pluginGeneratePdf.From the Internal Services drop-down, select
Execute Transform with Input Data./fbu/uapi/transformerdisplays in the Data Source URL field.Set the Request Type to Post.
Configure the Inputs table, as follows:
ID
Mapping
'PDF'
transformName
'5ebafff17b2213020fc9e897'
moduleId
_getData
data
The first row references the name of your transform. The second row is the Module ID of the module where you added the transform. In this case, the transform is in the module Lab: Generate PDF from Dashboard Using Transform, found here: https://training.unqork.io/#/form/5ebafff17b2213020fc9e897/edit. The third row passes all of your module's data to the transform. Because your transform only references specific values, it only uses that data. Using _getData avoids needing to enter every Property ID that the transform references.
Configure the Outputs table as follows:
Property ID
Mapping
pdfUrl
pdfUrl
This tells the Plug-In to map the URL where Unqork hosts your generated PDF to the Hidden component pdfUrl.
Click Save.
Configure the Button Component
Next, create a Button for your dashboard. When an end-user clicks this Button, it triggers the create PDF process.
Drag and drop a Button component onto your canvas. Place it at the top of your module, above your panelDashboard Panel.
In the Property ID field, enter
btnGeneratePdf.In the Label Text field, enter
Generate PDF.Set the Action Type to Event.
In the On Click field, enter
pluginGeneratePdf.In the Click Event field, enter
btnGeneratePdf.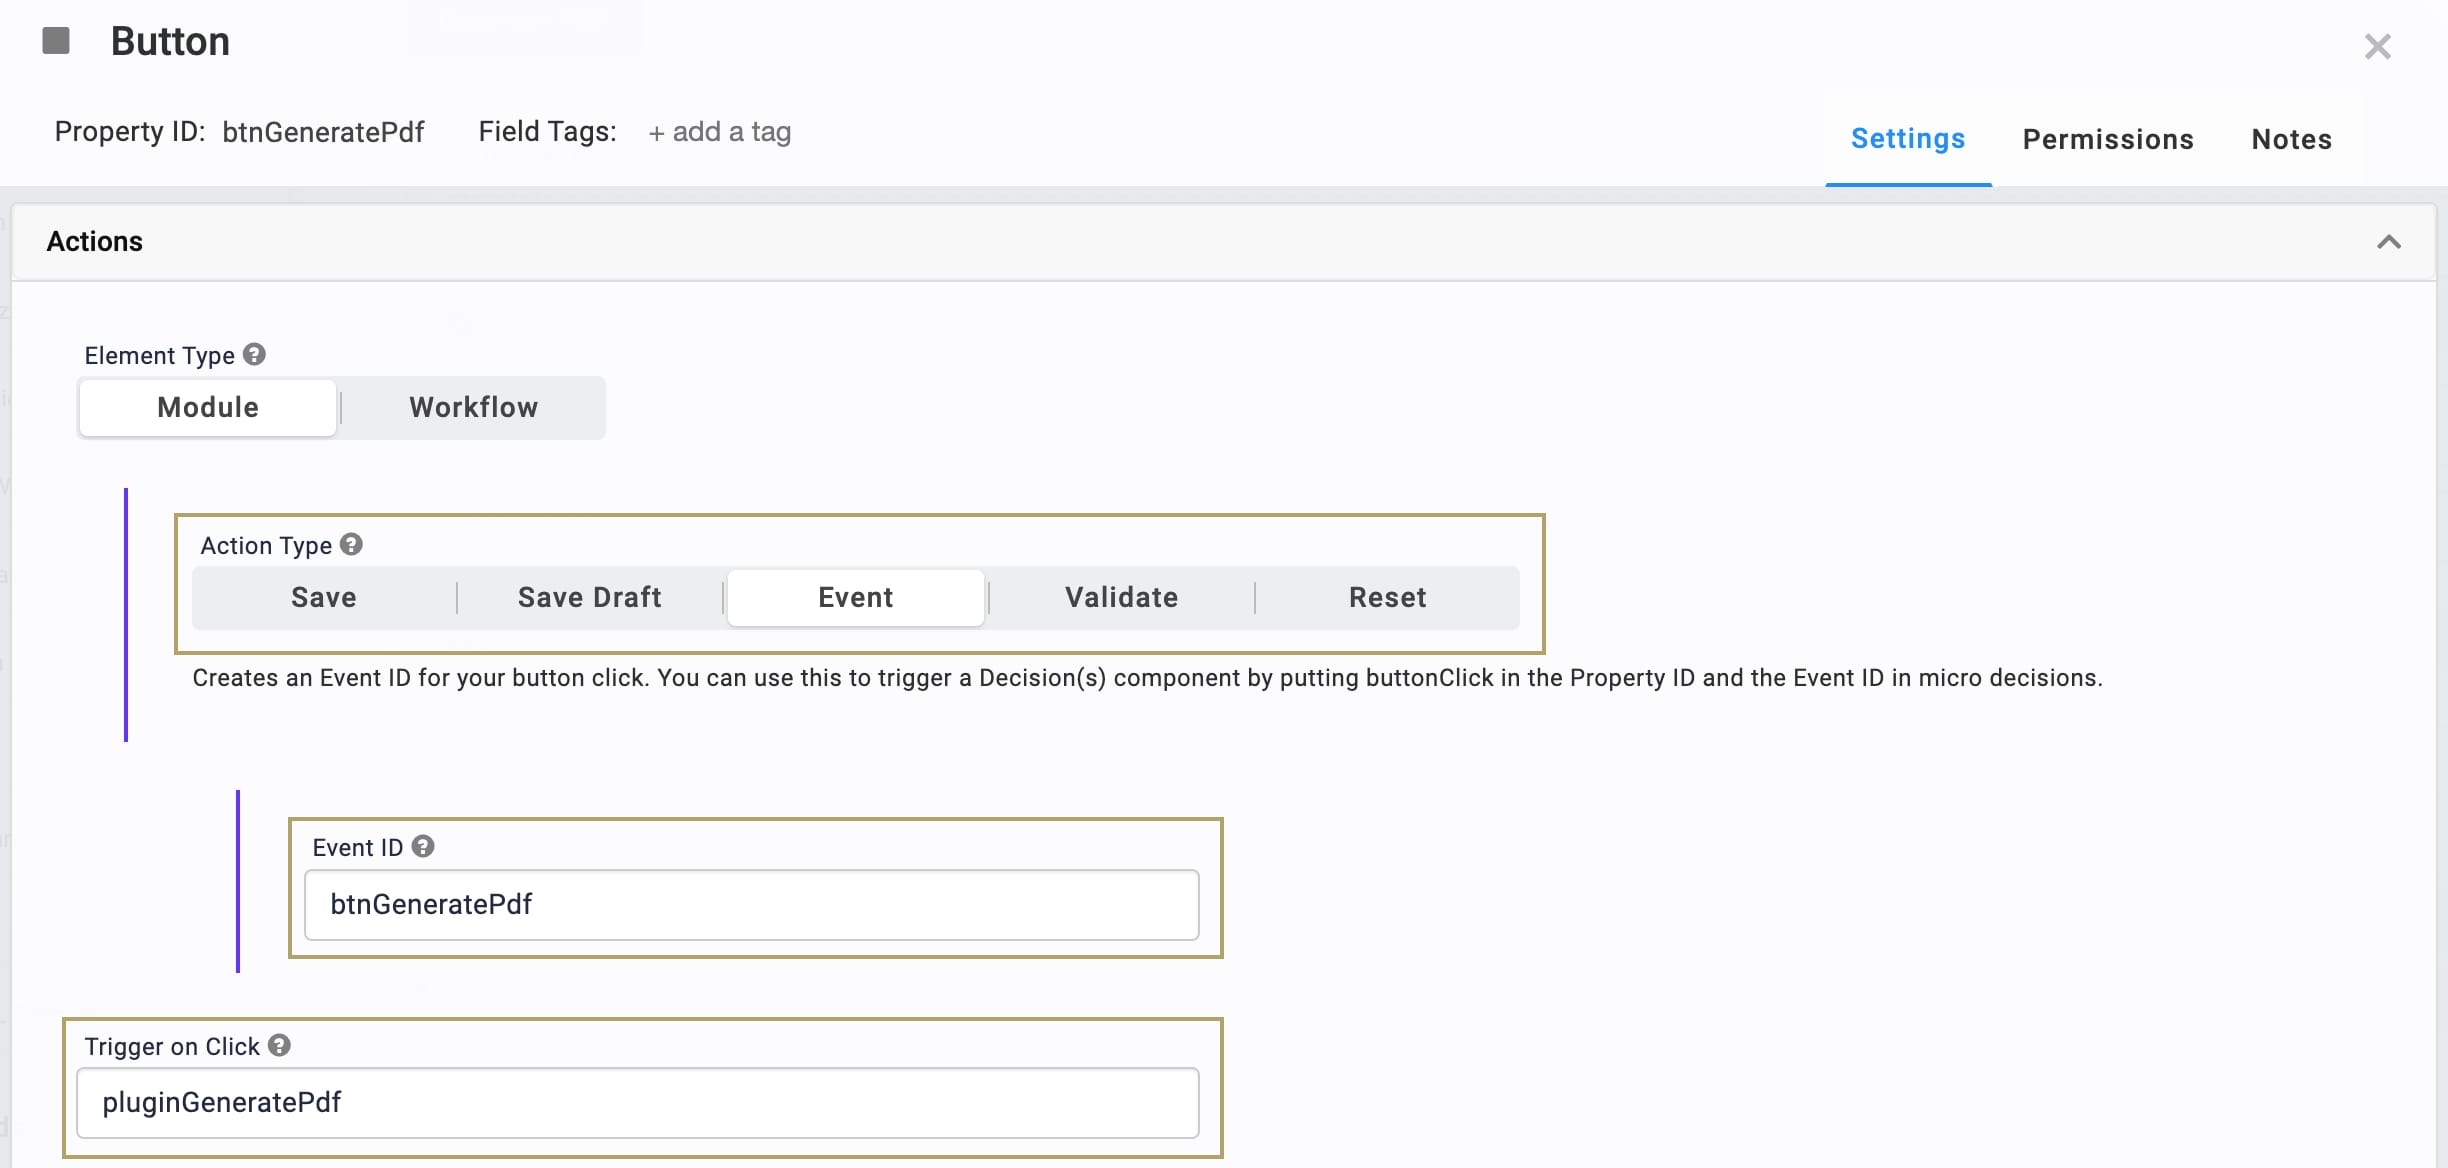
Click Save & Close.
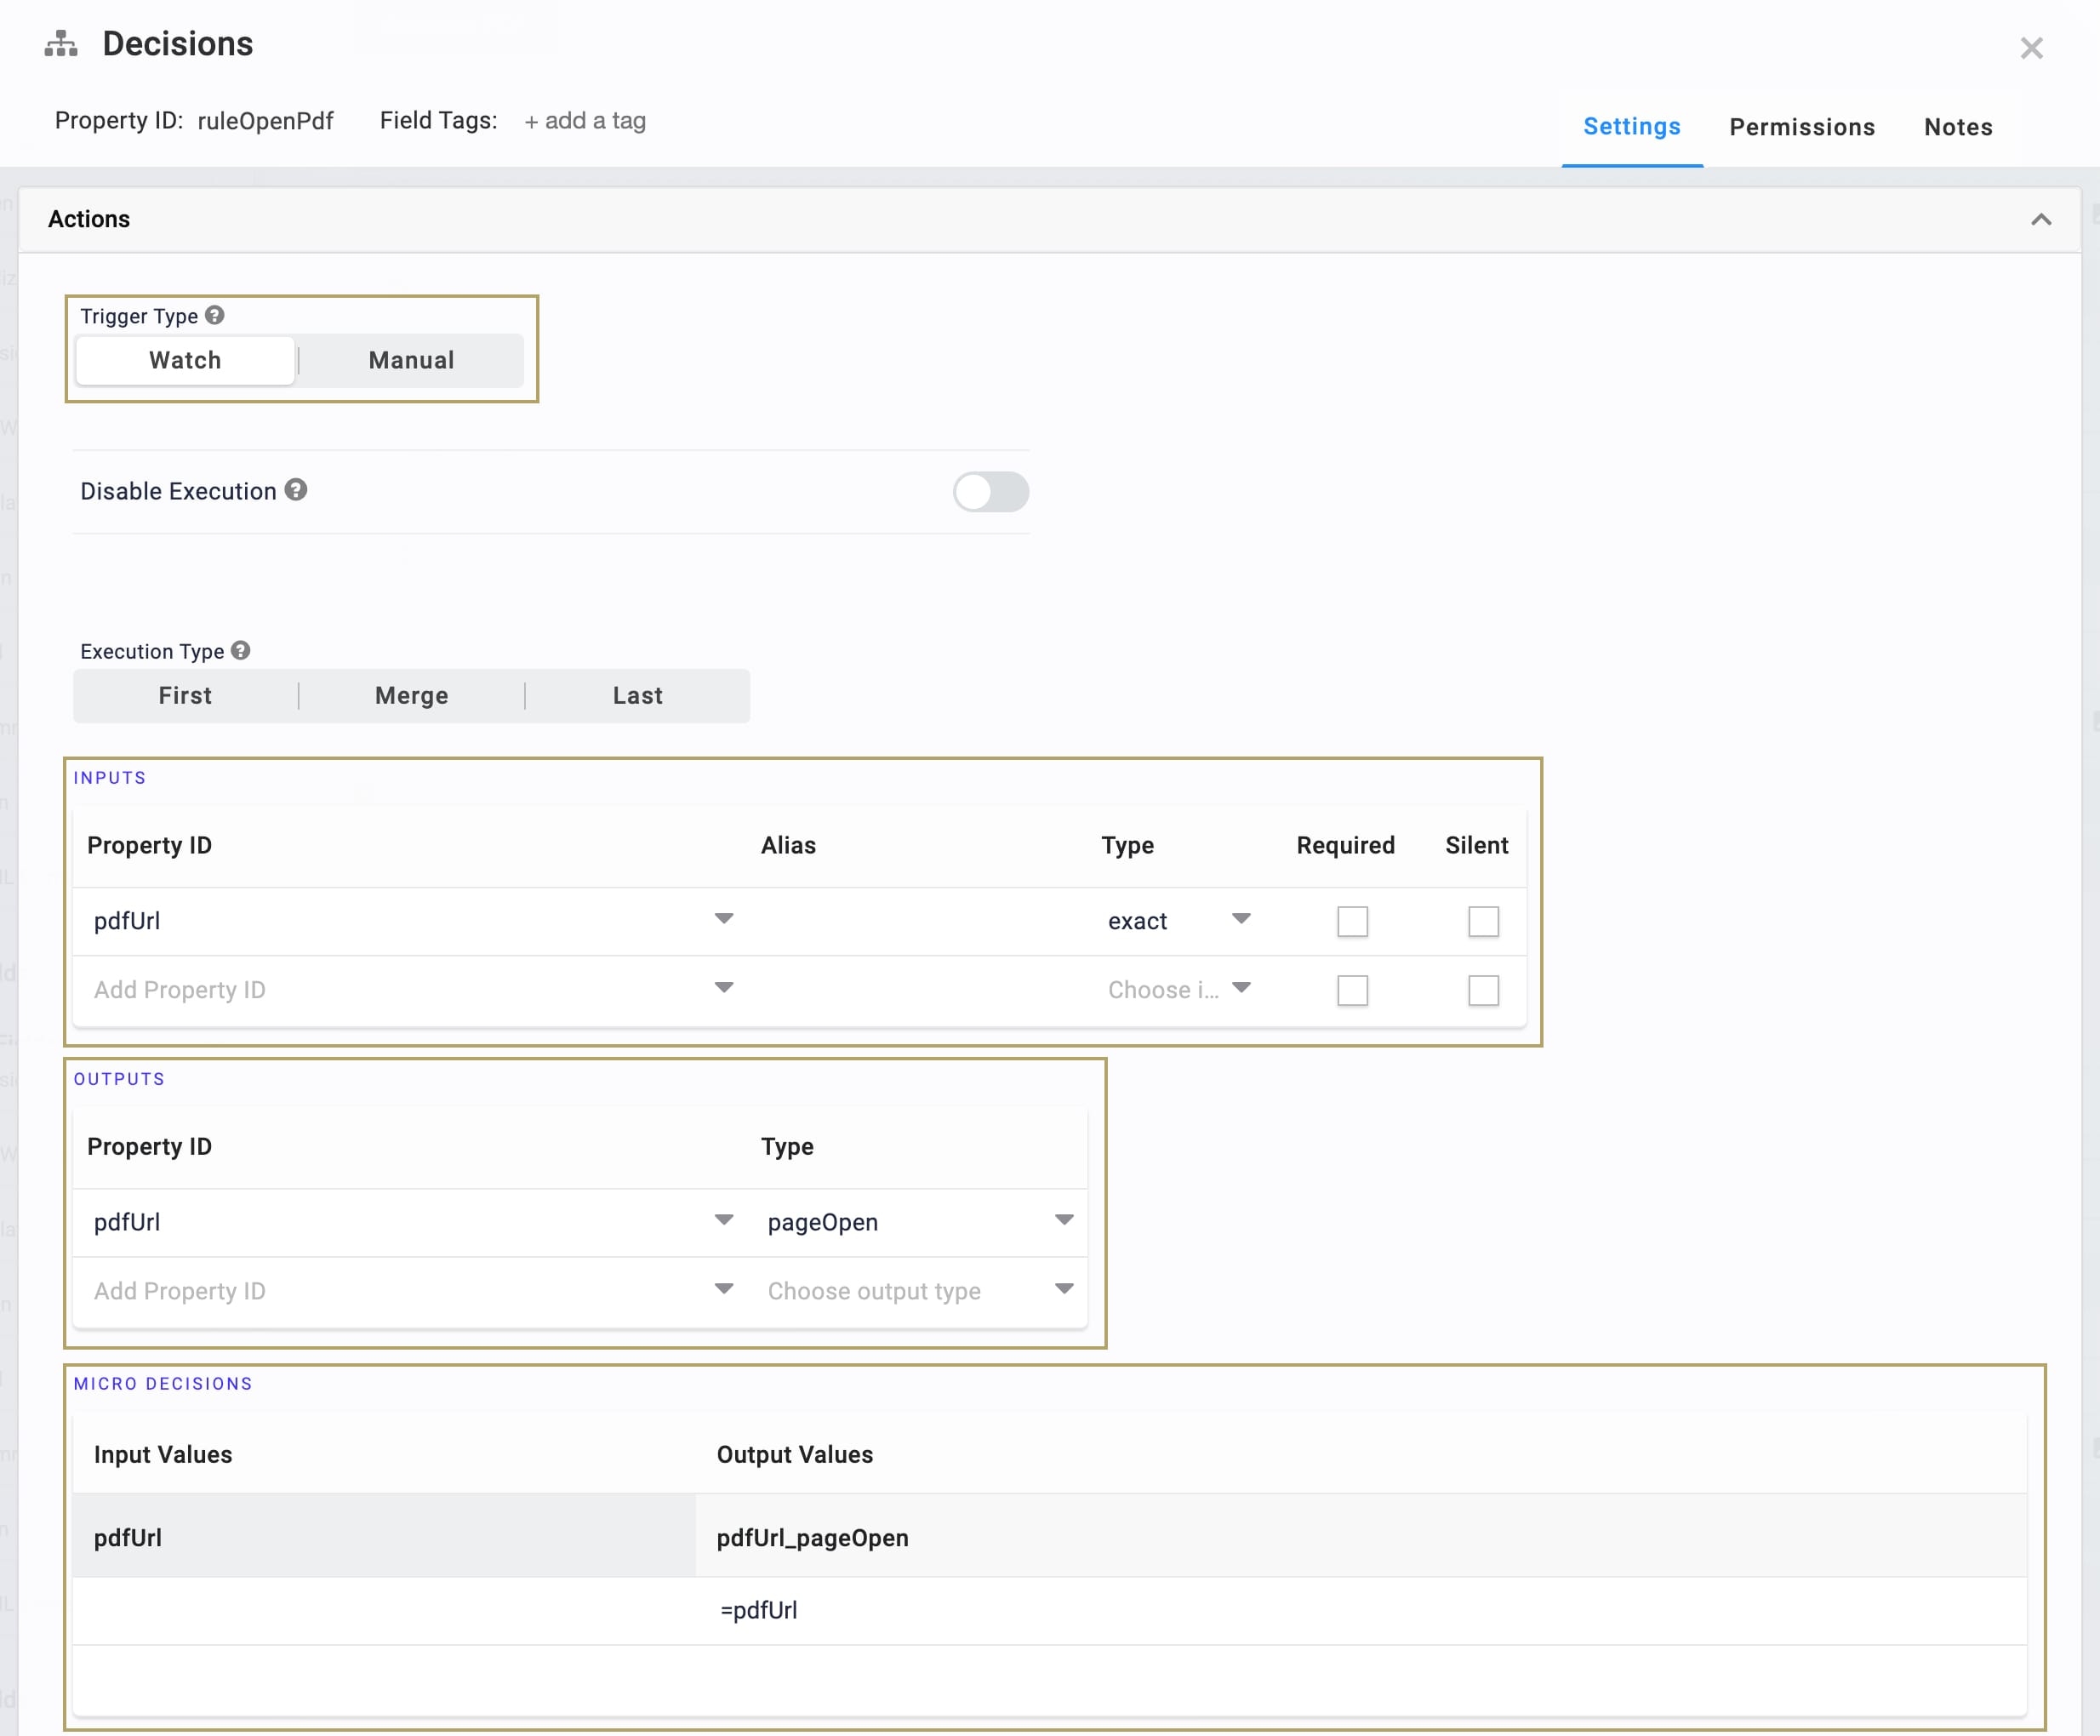
Configure the Decisions Component
Set up the rule that opens your generated PDF in a new tab. Your PDF opens as soon as its URL displays in the pdfUrlHidden component.
Drag and drop a Decisions component onto the canvas. Place it below your pluginGeneratePDF Plug-In component.
In the Property ID and Canvas Label Text, enter
ruleOpenPdf.Set the Trigger Type to Watch.
Configure the Inputs table as follows:
Property ID
Type
pdfURL
exact
Configure the Outputs table as follows:
Property ID
Type
pdfURL
pageOpen
Configure the Micro Decisions table as follows:
pdfURL
pdfURL_pageOpen
=pdfUrl
Click Save.
Save your module.
Here’s how your completed dashboard looks in Express View:
.jpg)
Here's how your PDF looks once created:
.jpg)
And here’s how your completed dashboard looks in the Module Builder:
