Application Performance Monitoring
Overview
Application Performance Monitoring (APM) continuously monitors Unqork application performance and availability by analyzing various metrics. APM lets you continuously detect and resolve issues before they impact an end-user's End-users, also known as Express Users, are the individuals accessing an application through Express View. In most cases, end-users are the customers using the product. or business' processes. That way, you can minimize downtime and optimize performance.
As part of our first release, we are integrating with Datadog and Splunk. They are the leading solutions providers, letting us monitor Unqork servers. Using Datadog or Splunk, Unqork can provide near real-time trace and span telemetry related to module, workflow, and component executions. You can use this telemetry to give you insight into an application’s performance.
Enabling APM in Your Environment
Unqork trace and span data is intended to integrate with your provider account so you can aggregate all observability data in one place.
| 1. | Reach out to your provider to set up an account. |
| 2. | The account must be under your ownership and not Unqork's ownership. |
| 3. | Submit a request ticket at support.unqork.com to enable APM in your environment. |
Depending on the amount of data, number of users and applications, frequency of use, and application complexity, additional costs might be required.
This article is intended to be a quick reference guide to help you set up Datadog or Splunk integration. Click the relevant tab below to view that specific documentation.
Datadog APM Integration
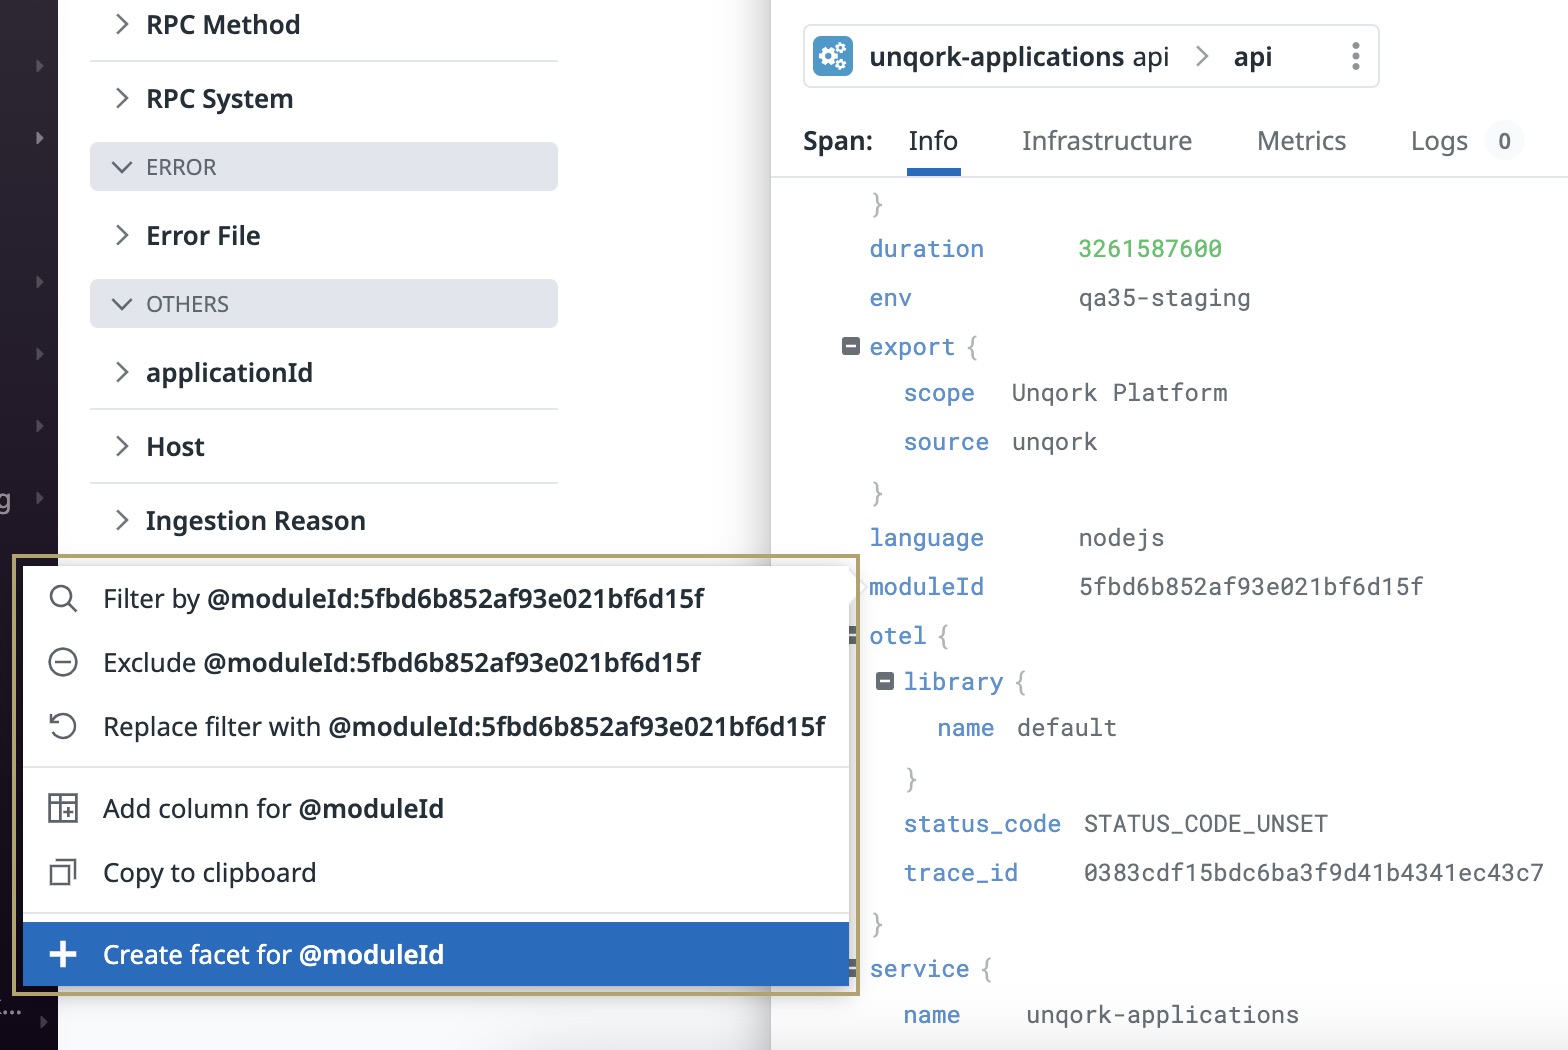
With Datadog APM integration, you can use telemetry to create metrics, alerts, and dashboards about an application’s performance. You can also use custom facets to create filters where application context is available—for example, moduleId. The images below are a typical example of creating a facet for a specified module ID(s).
DataDog must have a Pro or Enterprise Plan account plan. Free Datadog plans are not supported.
Creating a Facet:
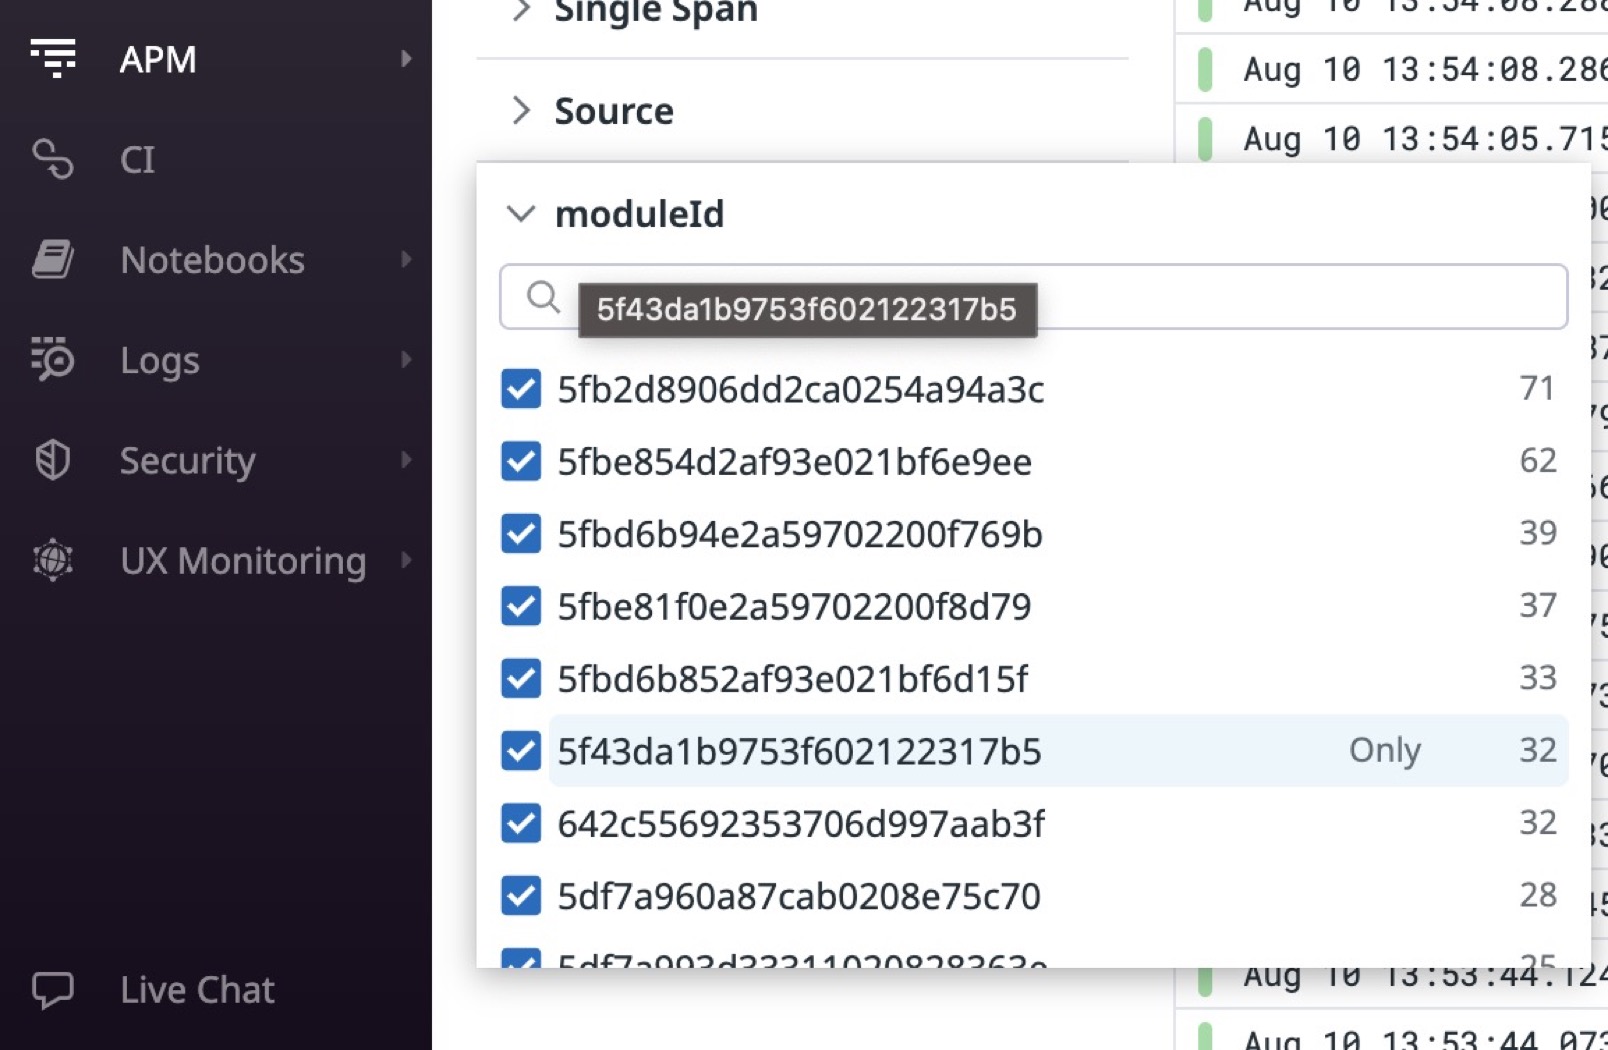
Module ID Facet:
Viewing a Trace
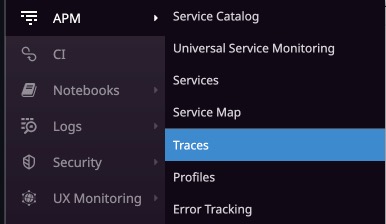
Traces are a collection of correlated spans or structured logs that provide a high-level view of what occurs when an application request is made. You can access traces from the APM drop-down in the side menu of your Datadog account.
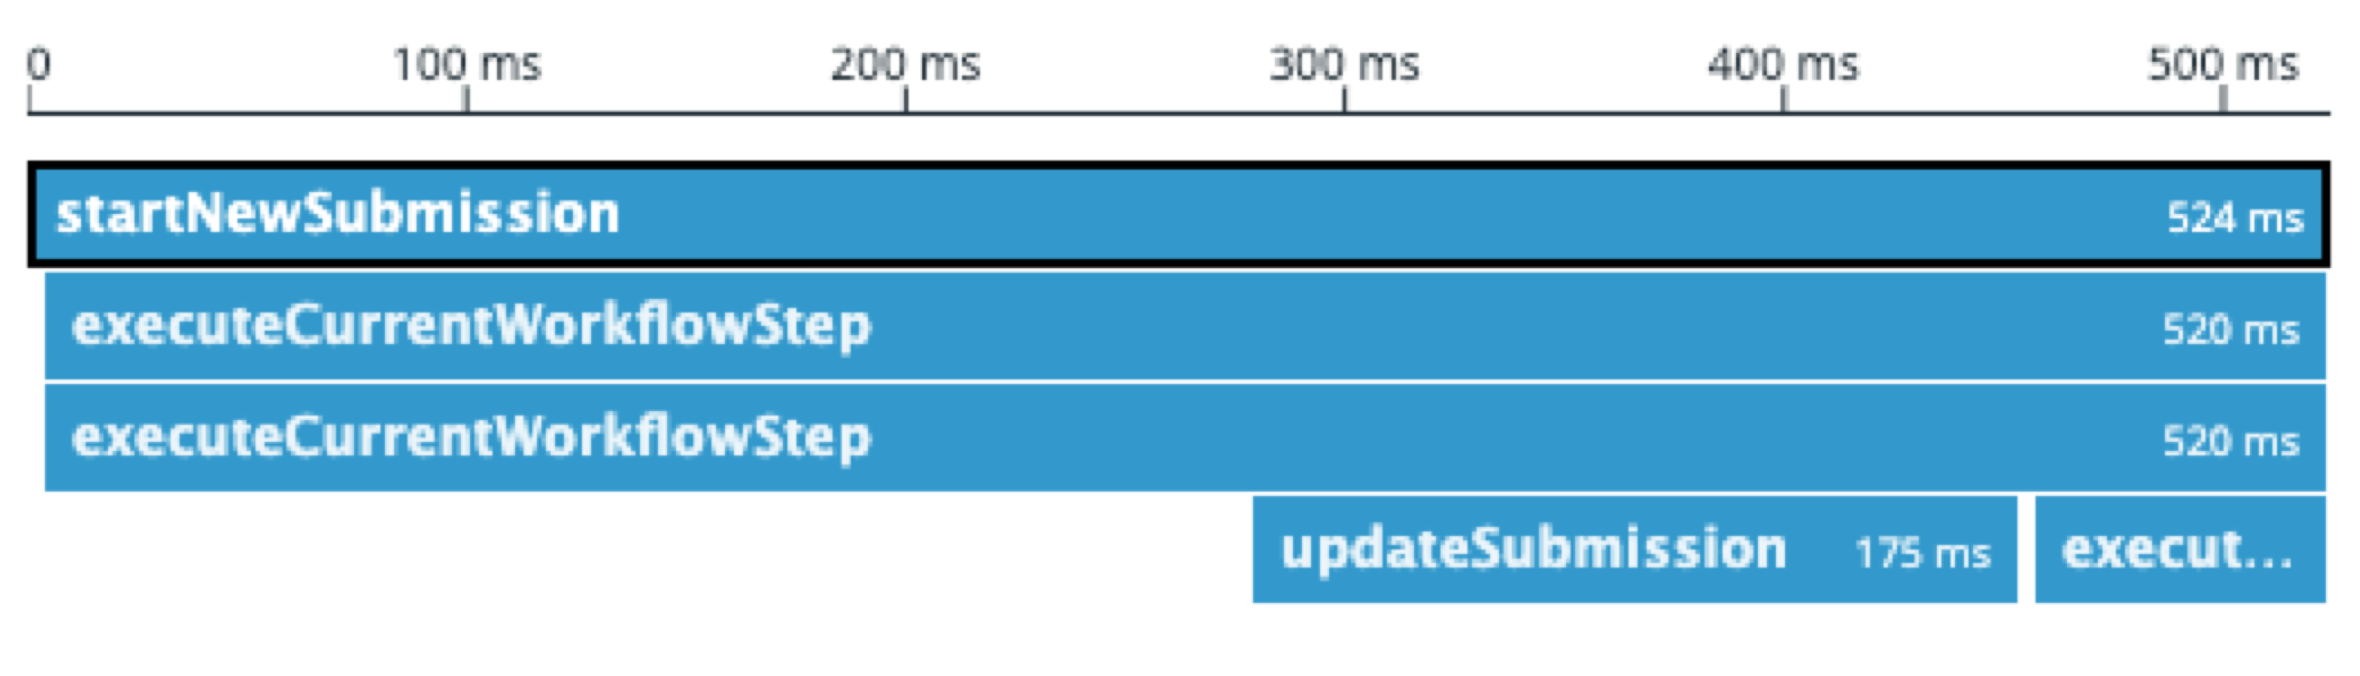
Let's use the image below as an example to better explain a Datadog trace. In this image, you can see the spans that describe a workflow execution in an Unqork application. The image displays the child processes that occur as part of the parent process. The execution starts with the startNewSubmission parent operation. As part of the parent, the executeCurrentWorkflowStep child operations run. Then, the parent process ends.
Viewing a Span
|
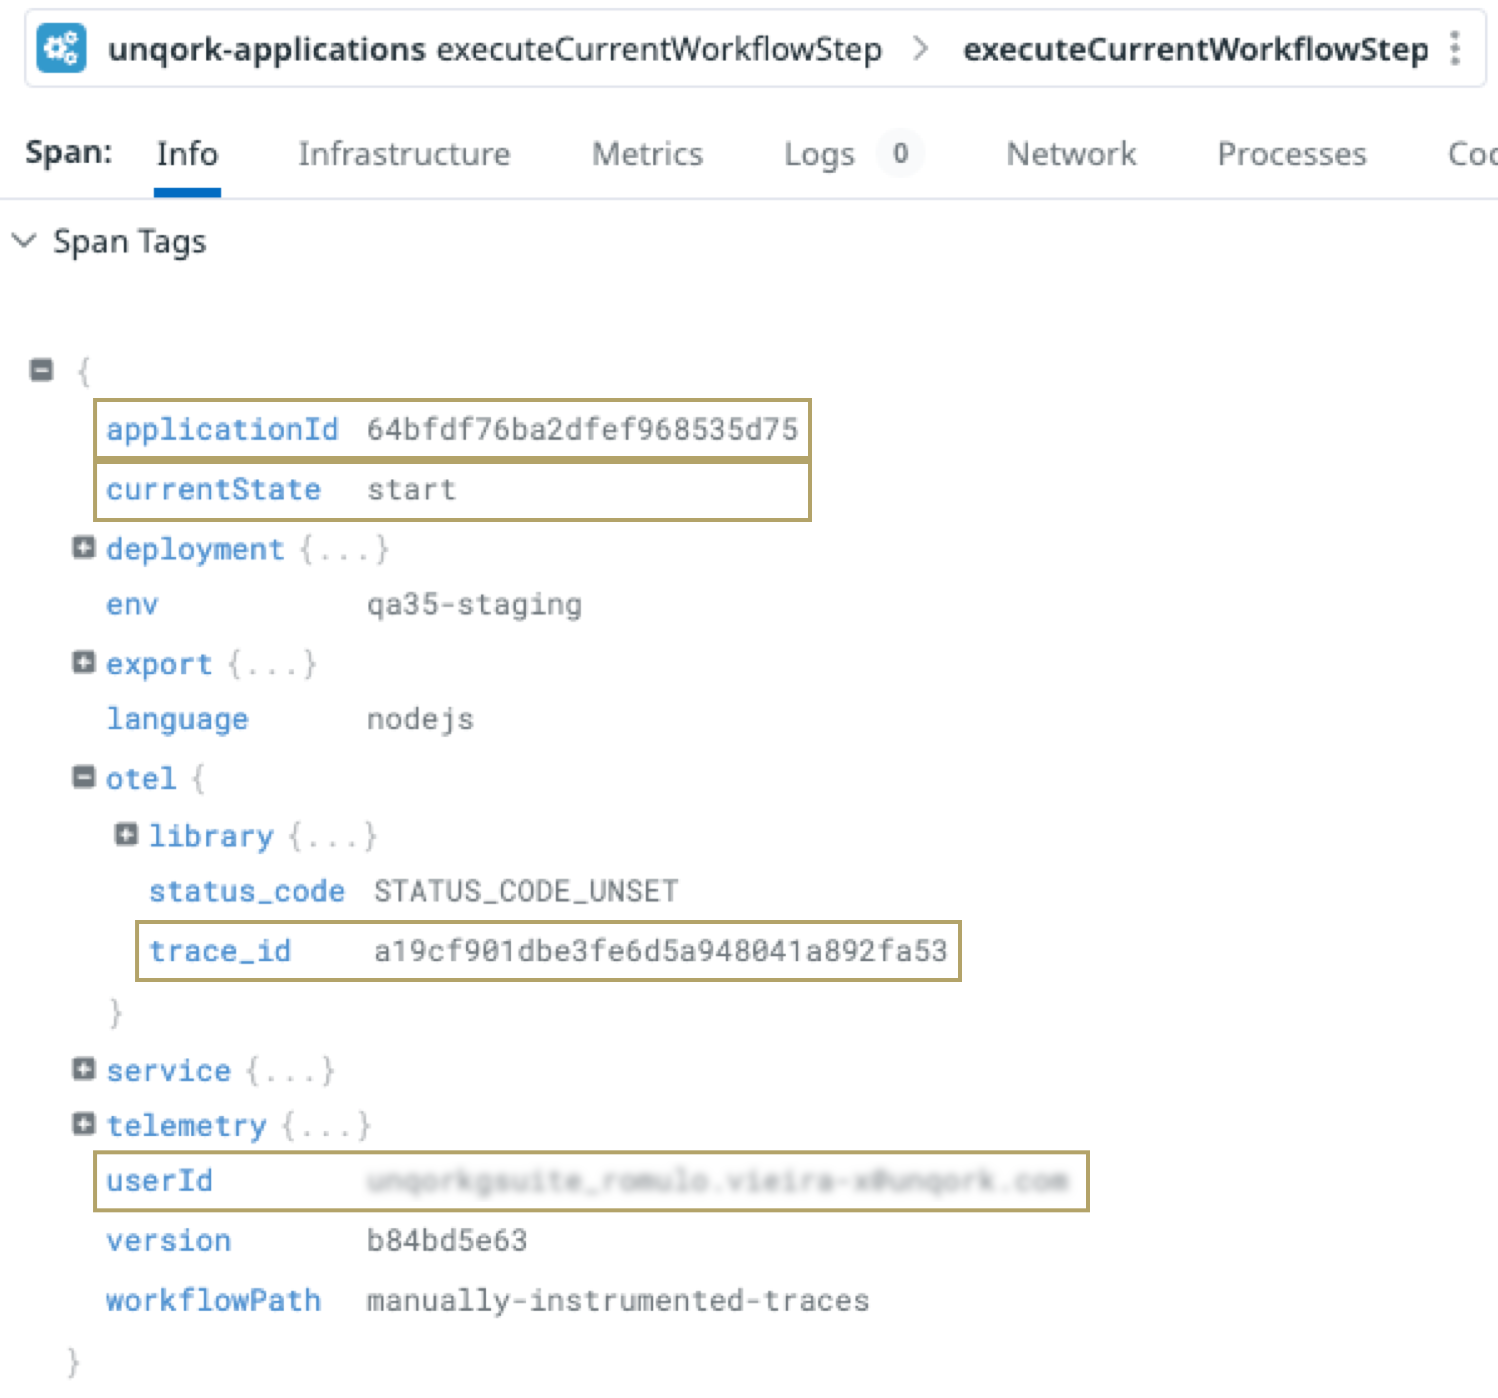
Let's look deeper into one of the executeCurrentWorkflowStep spans to understand what happened during the workflow execution. In the image to the right, we can see detailed information about the execution step. From the Datadog tags, we get insight about the application that was executed and where the data exists in Datadog. The following table highlights some of the most important information:
|
|
Building Custom Metrics
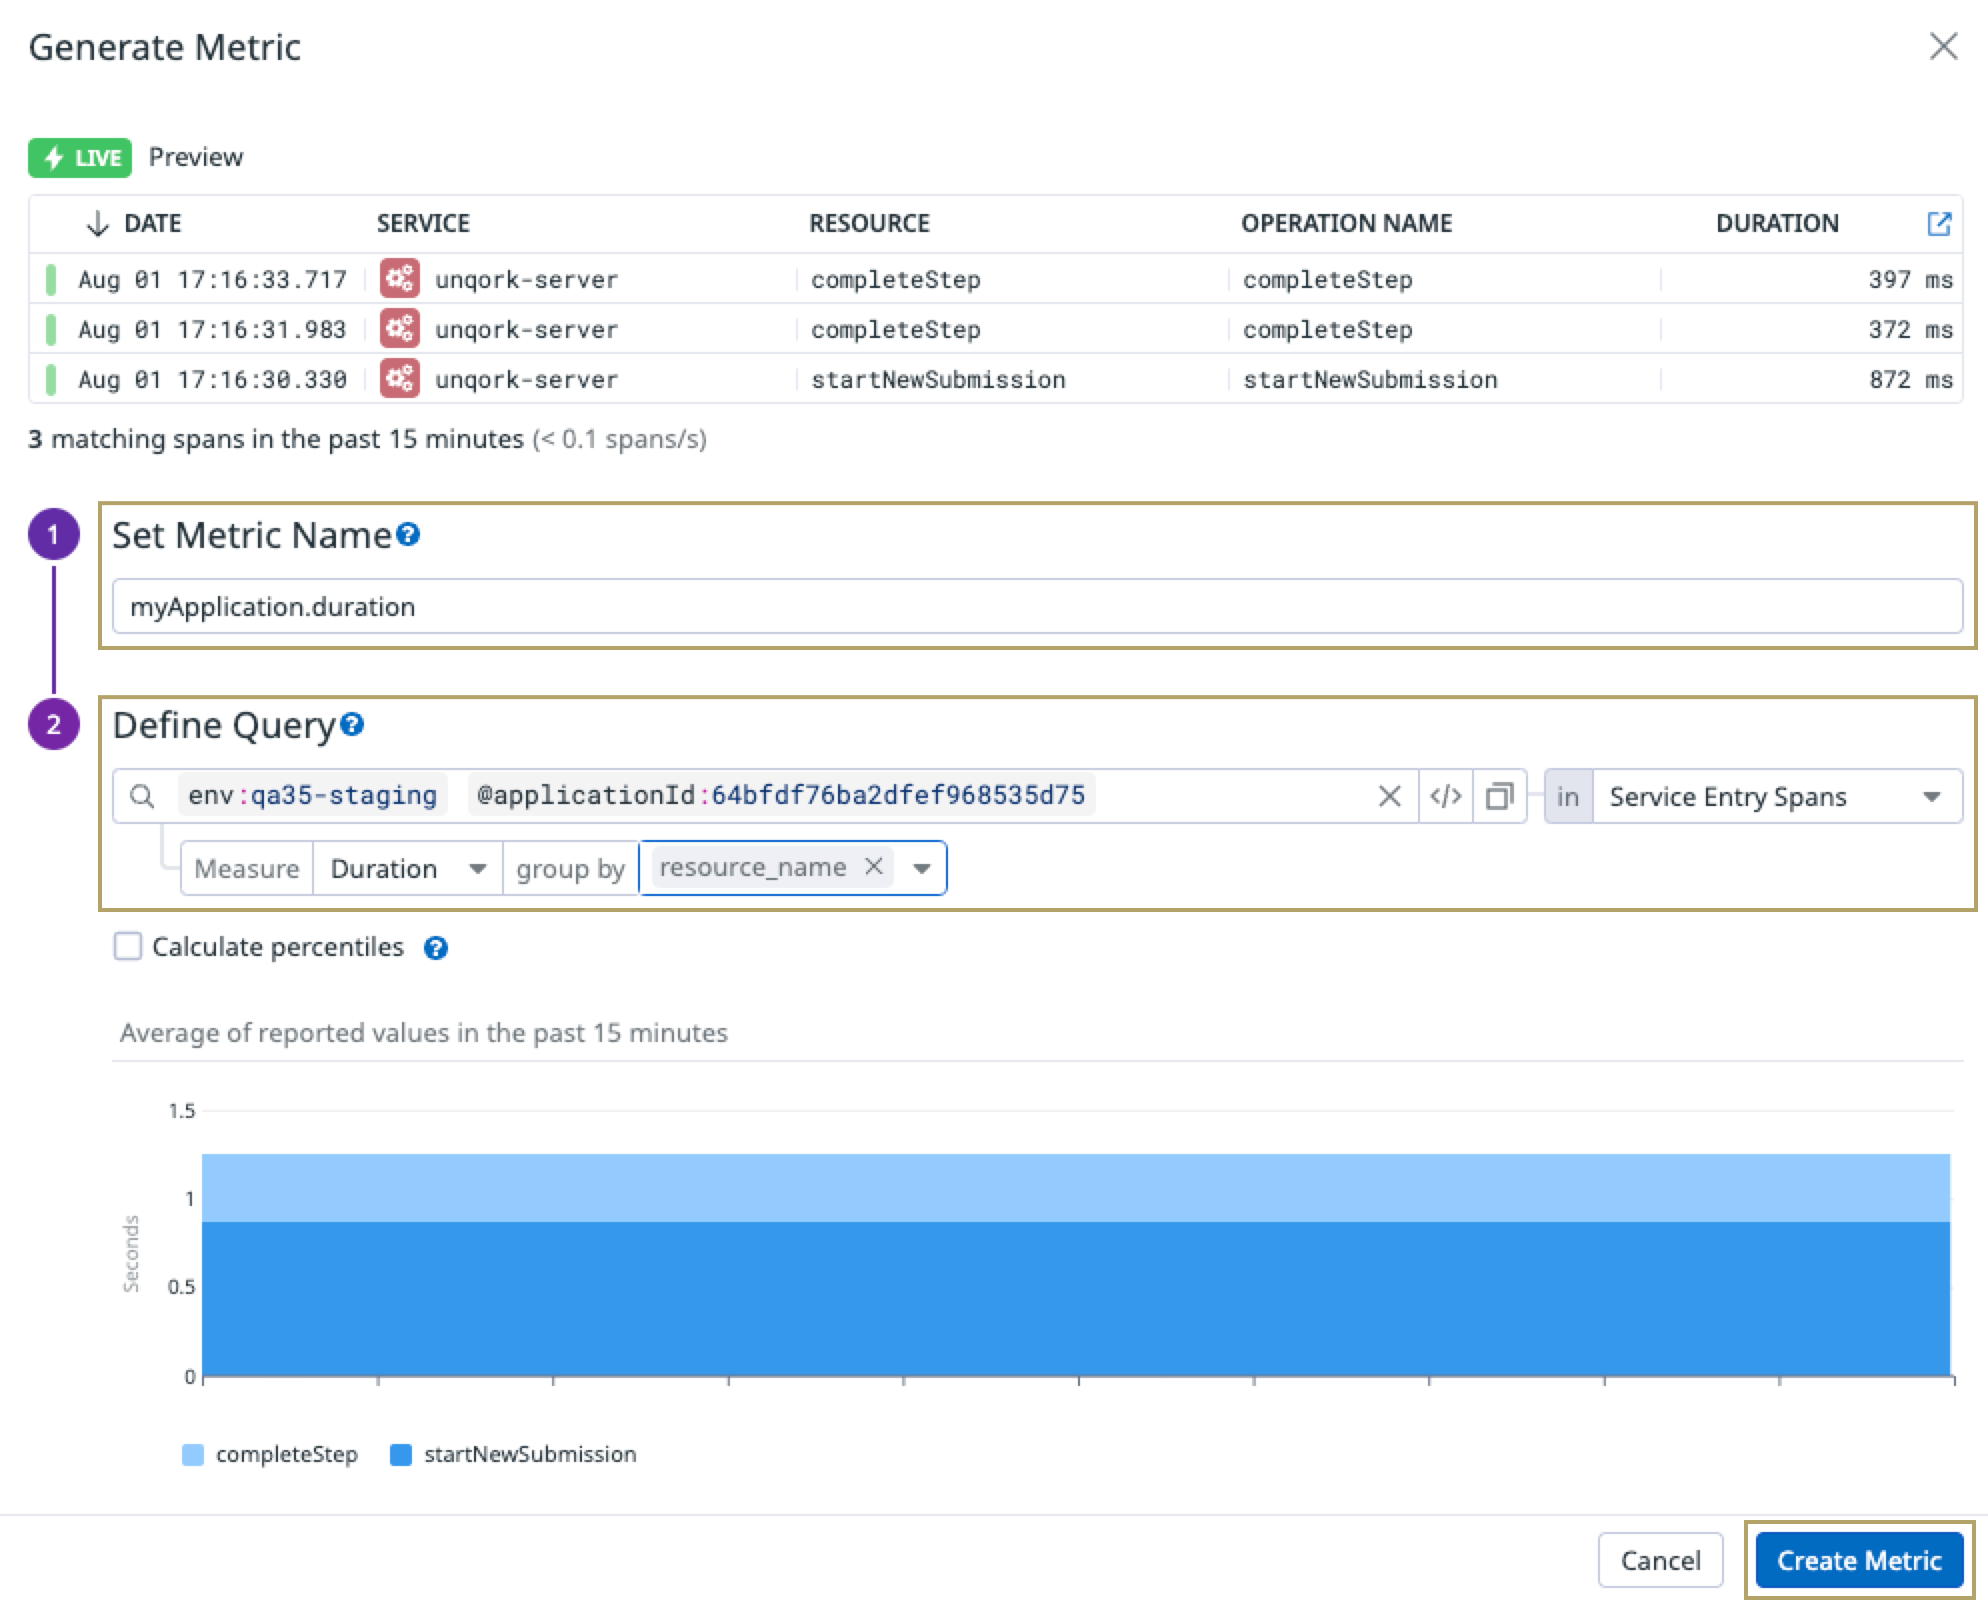
Now that you have your trace, you can build a custom metric to filter by a specified query. In this example, we'll query based on a specific Unqork environment and application ID. The following example returns information for an application ID in the specified Unqork environment.
|
To create a custom metric:
Once created, you can use this metric to configure dynamic charts in a dashboard to visualize the performance of your applications. |
|
Splunk APM Integration
With Splunk APM integration, you can use powerful visualization tools to display your span attributes.
Splunk clients must have the Observability Cloud package for Unqork to support the integration.
Viewing a Trace
|
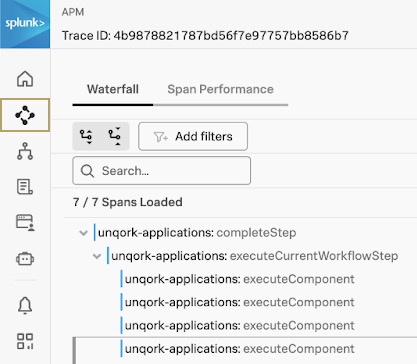
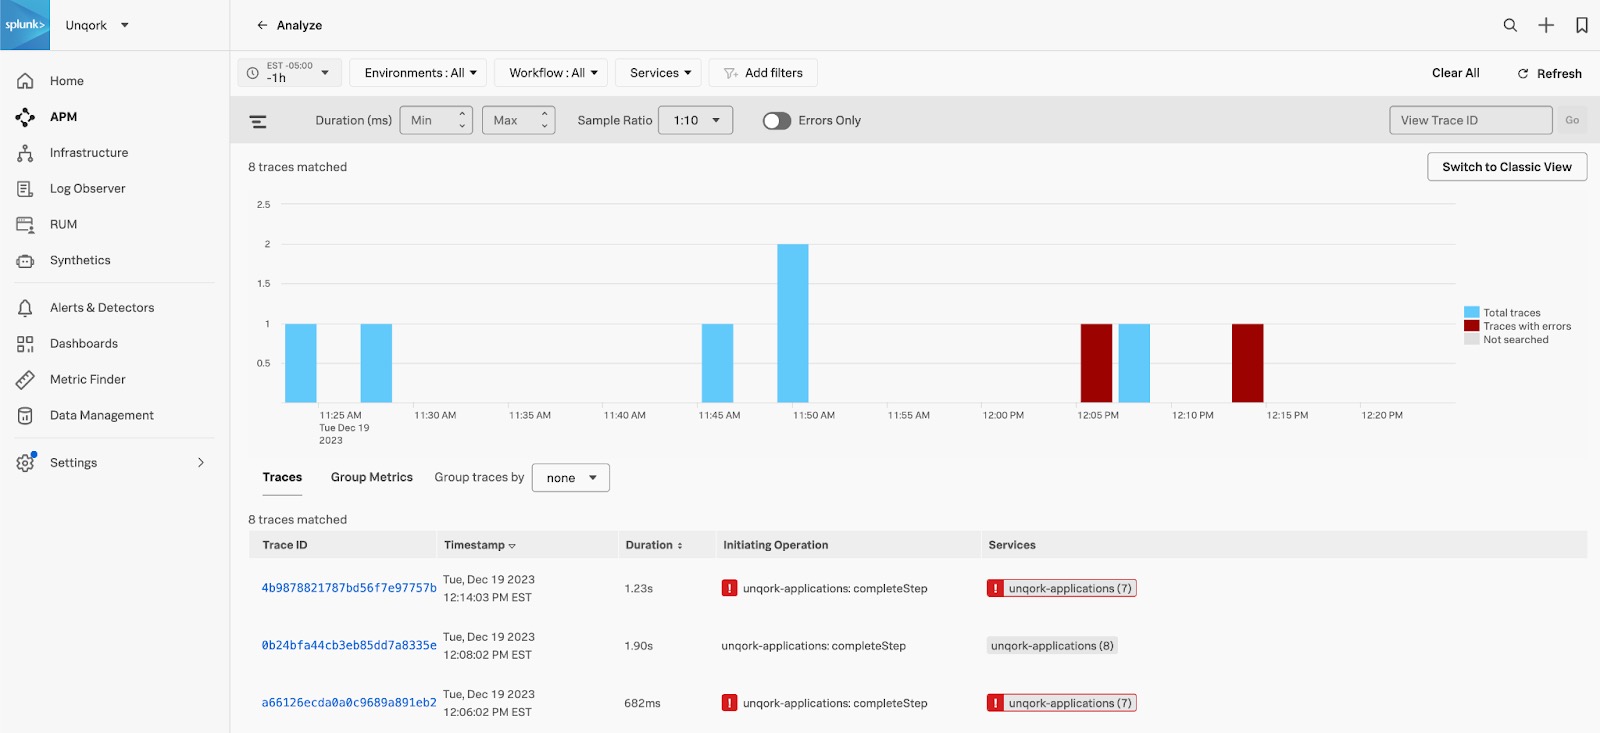
Traces are a collection of correlated spans that provide a high-level view of what occurs when an application request is made. The Splunk APM integration collects and analyzes spans and traces from each of the services that you have connected. You can access spans from the menu to the left of your Splunk account. Let's use the image to the right as an example to better explain a Splunk trace. In this image, you can see the spans that describe a workflow execution in an Unqork application. In the image below, you can see the spans that describe a workflow execution in an Unqork application. The image displays the child processes that occur as part of the parent process. The execution starts with the unqork-applications:completeStep parent operation. As part of the parent process, the unqork-applications:executeCurrentWorkflowStep child operations run. After executing the components as part of the workflow step, the parent process ends. |
|
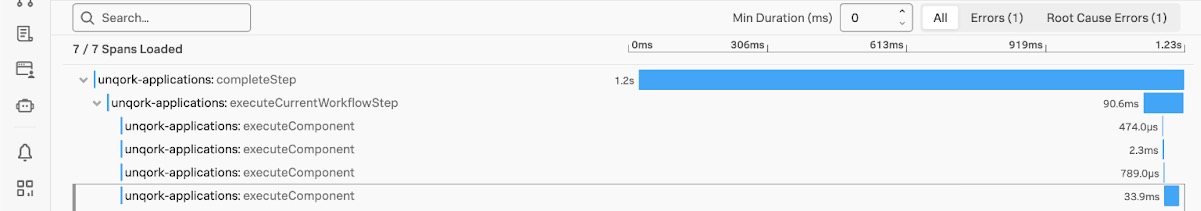
You can also filter for specific traces to analyze errors that occurred. In the example image below, you can filter a trace to identify its trace IDs, the execution step, how long a execution took, and if there were errors.
Viewing a Span
|
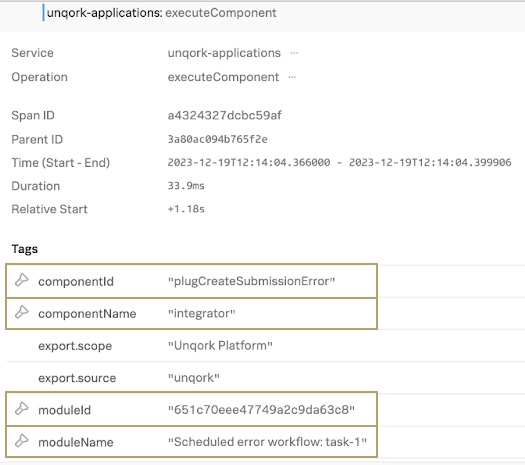
Let's look deeper into the final child span of the unqork-applications:executeCurrentWorkflowStep process to understand what happened during the workflow execution. In the image to the right, we can see detailed information about the execution step. From the Splunk tags, we get insight that the executed component was an integrator (or Unqork Plug-In component) with a Property ID of plugCreateSubmissionError. The tags also display the module name and ID where the component exists. The following table highlights some of the most important information:
|
|
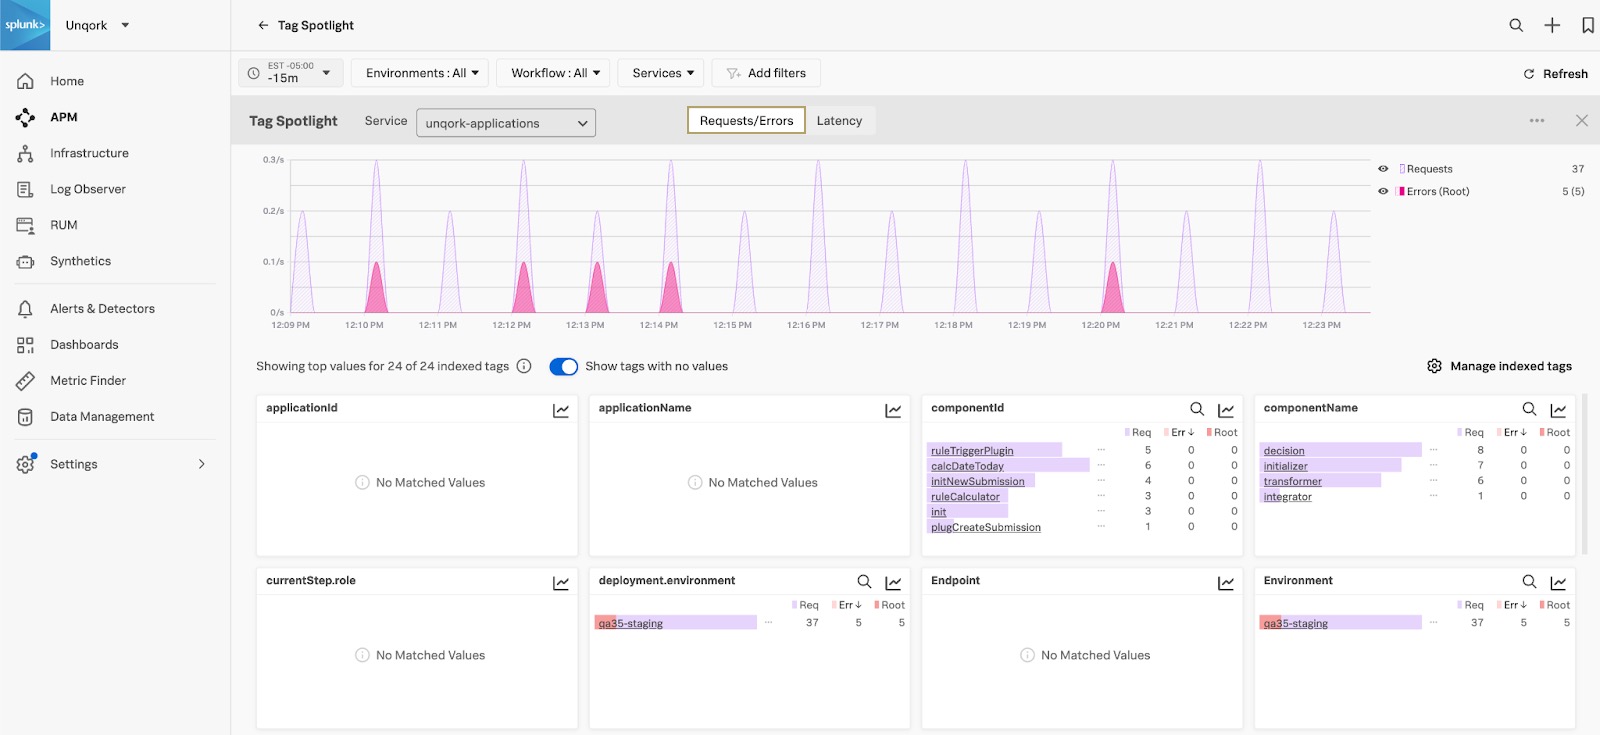
Error and Latency Visualizations
Splunk also generates powerful visualizations based on your span data. That way, you can monitor your executions and determine if there are request errors or latency. The images below are examples of the insights you can gather from the performance of your environment, applications, and components.
Requests and Errors:
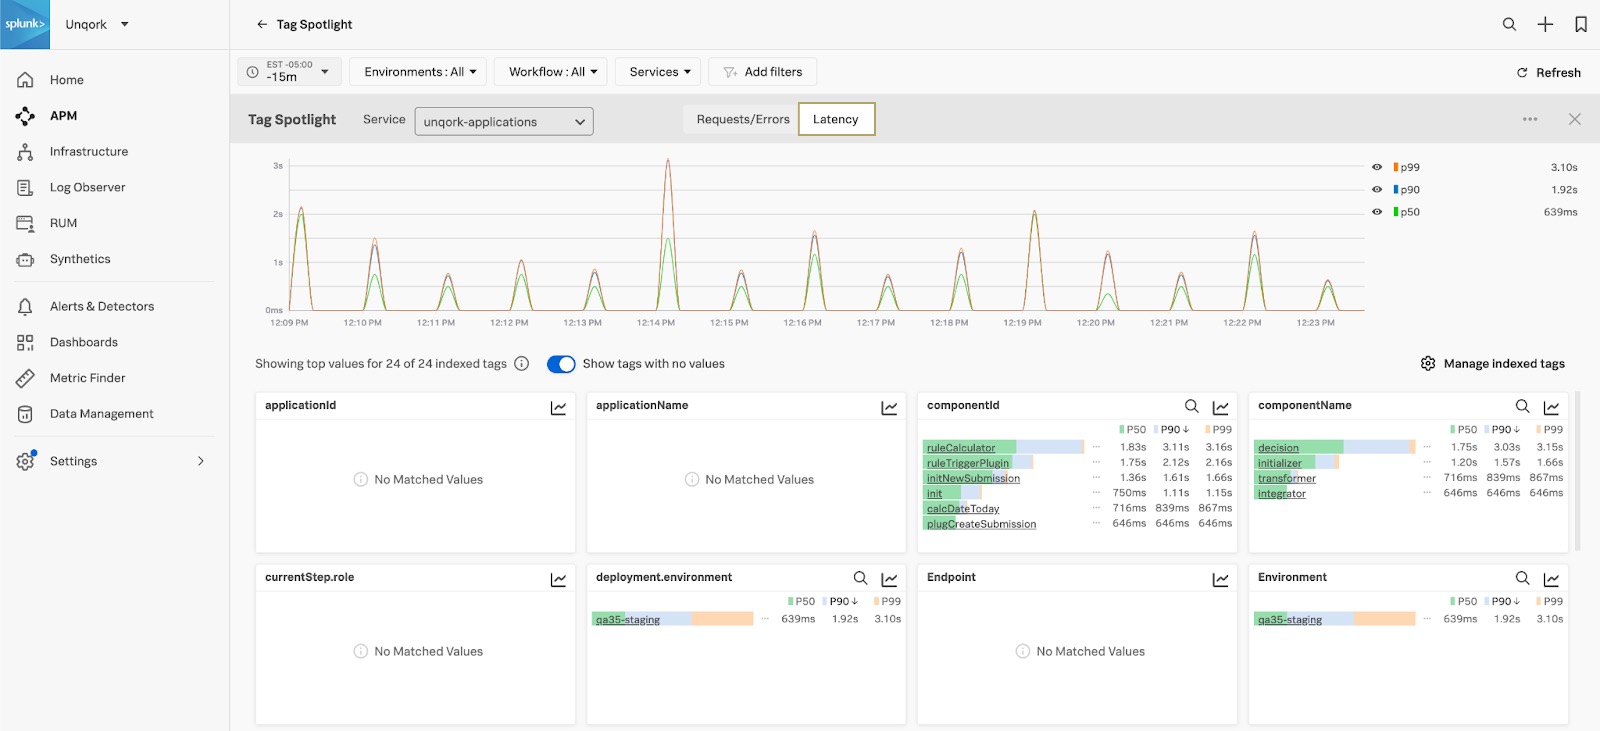
Latency:
To customize your metrics and take advantage of these analytics, your administrator must add Monitoring MetricSets. You can use Monitoring MetricSets to monitor request and error rates, durations, and so on based on your traces and spans. Your administrator can customize Monitoring MetricSets from the Splunk APM settings.
The image below is an example of the types of MetricSets you can customize:
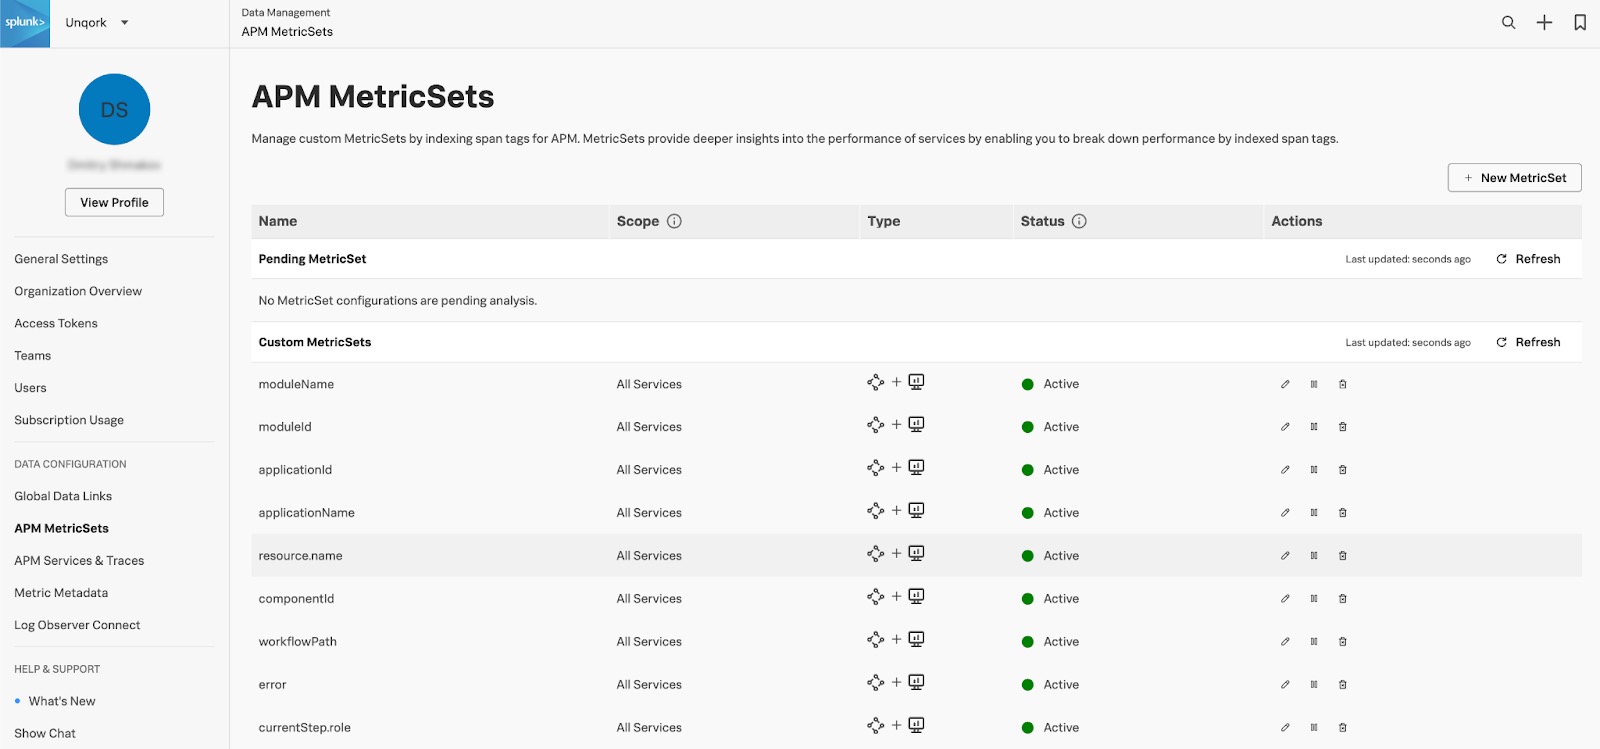
To learn more about Monitoring MetricSets, view Splunk's APM documentation: https://docs.splunk.com/observability/en/apm/span-tags/metricsets.html.
