Unqork's APM (Application Performance Monitoring) uses Datadog or Splunk observability platforms to continuously monitor your Unqork application's performance, availability, and overall health by analyzing server-side executions of modules, workflows, and components.
APM provides the following features and telemetry details:
Traces and Spans: Provides near-real-time trace and span telemetry for in-depth performance analysis.
Server-Side Telemetry: All telemetry data is focused exclusively on server-side executions, including module, workflow, and component executions.
Service Name: All Unqork telemetry appears under the consistent service name
unqork-applicationsin your Datadog or Splunk APM tool.
By using APM, you can continuously detect and resolve performance issues before they impact end-users or critical business processes, thereby minimizing downtime and optimizing application performance.
Unsupported Features
While Unqork APM supports traces and span telemetry, it does not support the following features:
No Metrics or Logs: The telemetry feed does not include metrics or logs. However, you can use the trace data Unqork supplies to build your own custom metrics and dashboards using your APM provider.
No Front-End Telemetry: Telemetry data is not captured for front-end or client-side activity. Captured data is exclusively server-side.
No Self-Service Setup: APM setup is currently a manual, self-service process. Enabling APM requires submitting a support ticket to Unqork’s support team.
Requirements to Use APM
To enable APM in an environment, verify that the following requirements are met:
# | Requirement | Description |
|---|---|---|
1 | Provider Account | You must have an active, paid account with your chosen APM provider. |
2 | Specific Plan | APM requires one of the following observability platform provider plans:
|
3 | Environment Type | This feature is only available for Unqork environments hosted on Kubernetes (K8s). |
Once all three requirements are met, refer to the section below for enabling APM in your environments.
Enabling APM in One or More Environments
Enabling APM is a manual and involved process that requires coordination with Unqork's Support and Technical teams.
To enable APM in your environment:
Submit a Support Ticket: Submit a request ticket at support.unqork.com to enable APM in your environment. In the ticket, please specify the following details:
#
Detail
Description
1
Target Environments
Environment examples include UAT (User Acceptance Testing) or Production.
2
APM Provider
Specify which observability platform you are using: DataDog or Splunk.
3
Provider Instance Link
The origin of the provider. For example,
datadoghq.comordatadoghq.euSecurely Share Credentials: An Unqork TechOps engineer is assigned to your ticket and provides a SendSafely link. Use this secure link to provide the required API credentials:
DataDog: Your DataDog
Secret(API) Key.Splunk: An API key with
INGESTpermissions.
Learn more about how SendSafely works by visiting the SendSafely: How It Works article.
Setup and Configuration: The Unqork team uses the API credentials to configure the APM connection. The typical SLA (Service Level Agreement) for connection setup is 3-5 business days after the credentials have been securely received.
Integrating with Datadog or Splunk
Click the relevant tab below to view Datadog or Splunk integration.
Datadog APM Integration
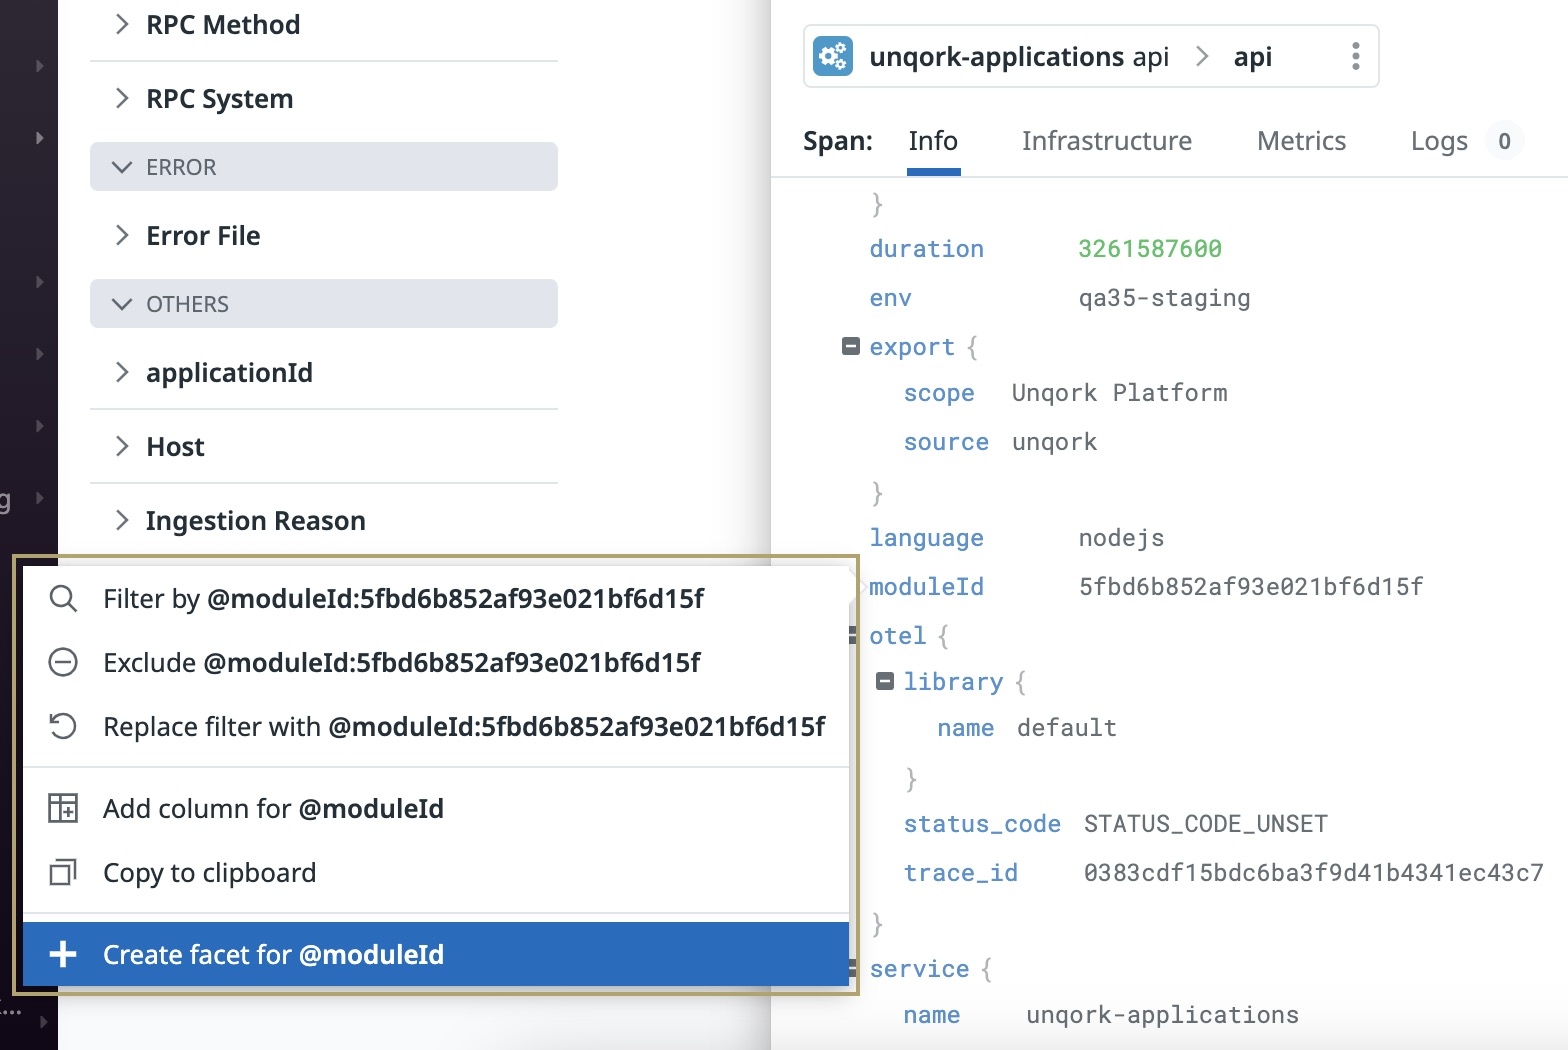
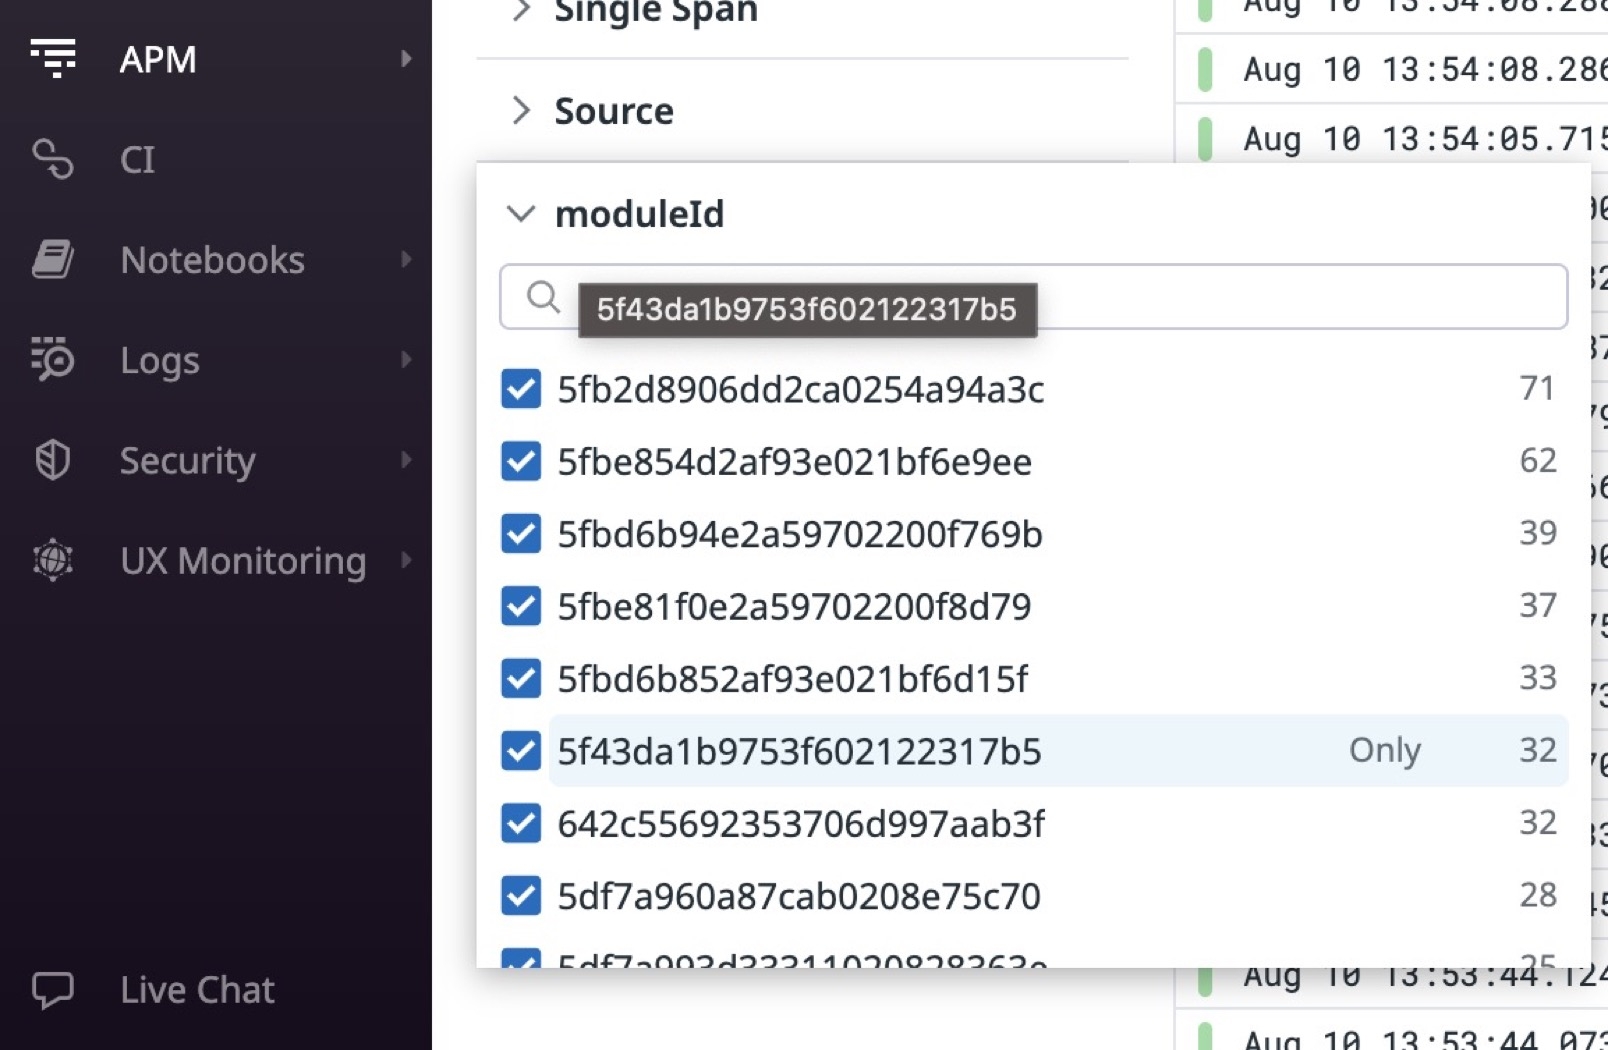
With Datadog APM integration, you can use telemetry to create metrics, alerts, and dashboards about an application’s performance. You can also use custom facets to create filters where application context is available—for example, moduleId. The images below are a typical example of creating a facet for a specified module ID(s).
DataDog must have a Pro or Enterprise Plan account plan. Free Datadog plans are not supported.
Creating a Facet:
Module ID Facet:
Viewing a Trace
Traces are a collection of correlated spans or structured logs that provide a high-level view of what occurs when an application request is made. You can access traces from the APM drop-down in the side menu of your Datadog account.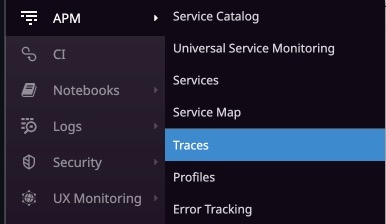
Let's use the image below as an example to better explain a Datadog trace. In this image, you can see the spans that describe a workflow execution in an Unqork application. The image displays the child processes that occur as part of the parent process. The execution starts with the startNewSubmission parent operation. As part of the parent, the executeCurrentWorkflowStep child operations run. Then, the parent process ends.
Viewing a Span
Let's look deeper into one of the executeCurrentWorkflowStep spans to understand what happened during the workflow execution.
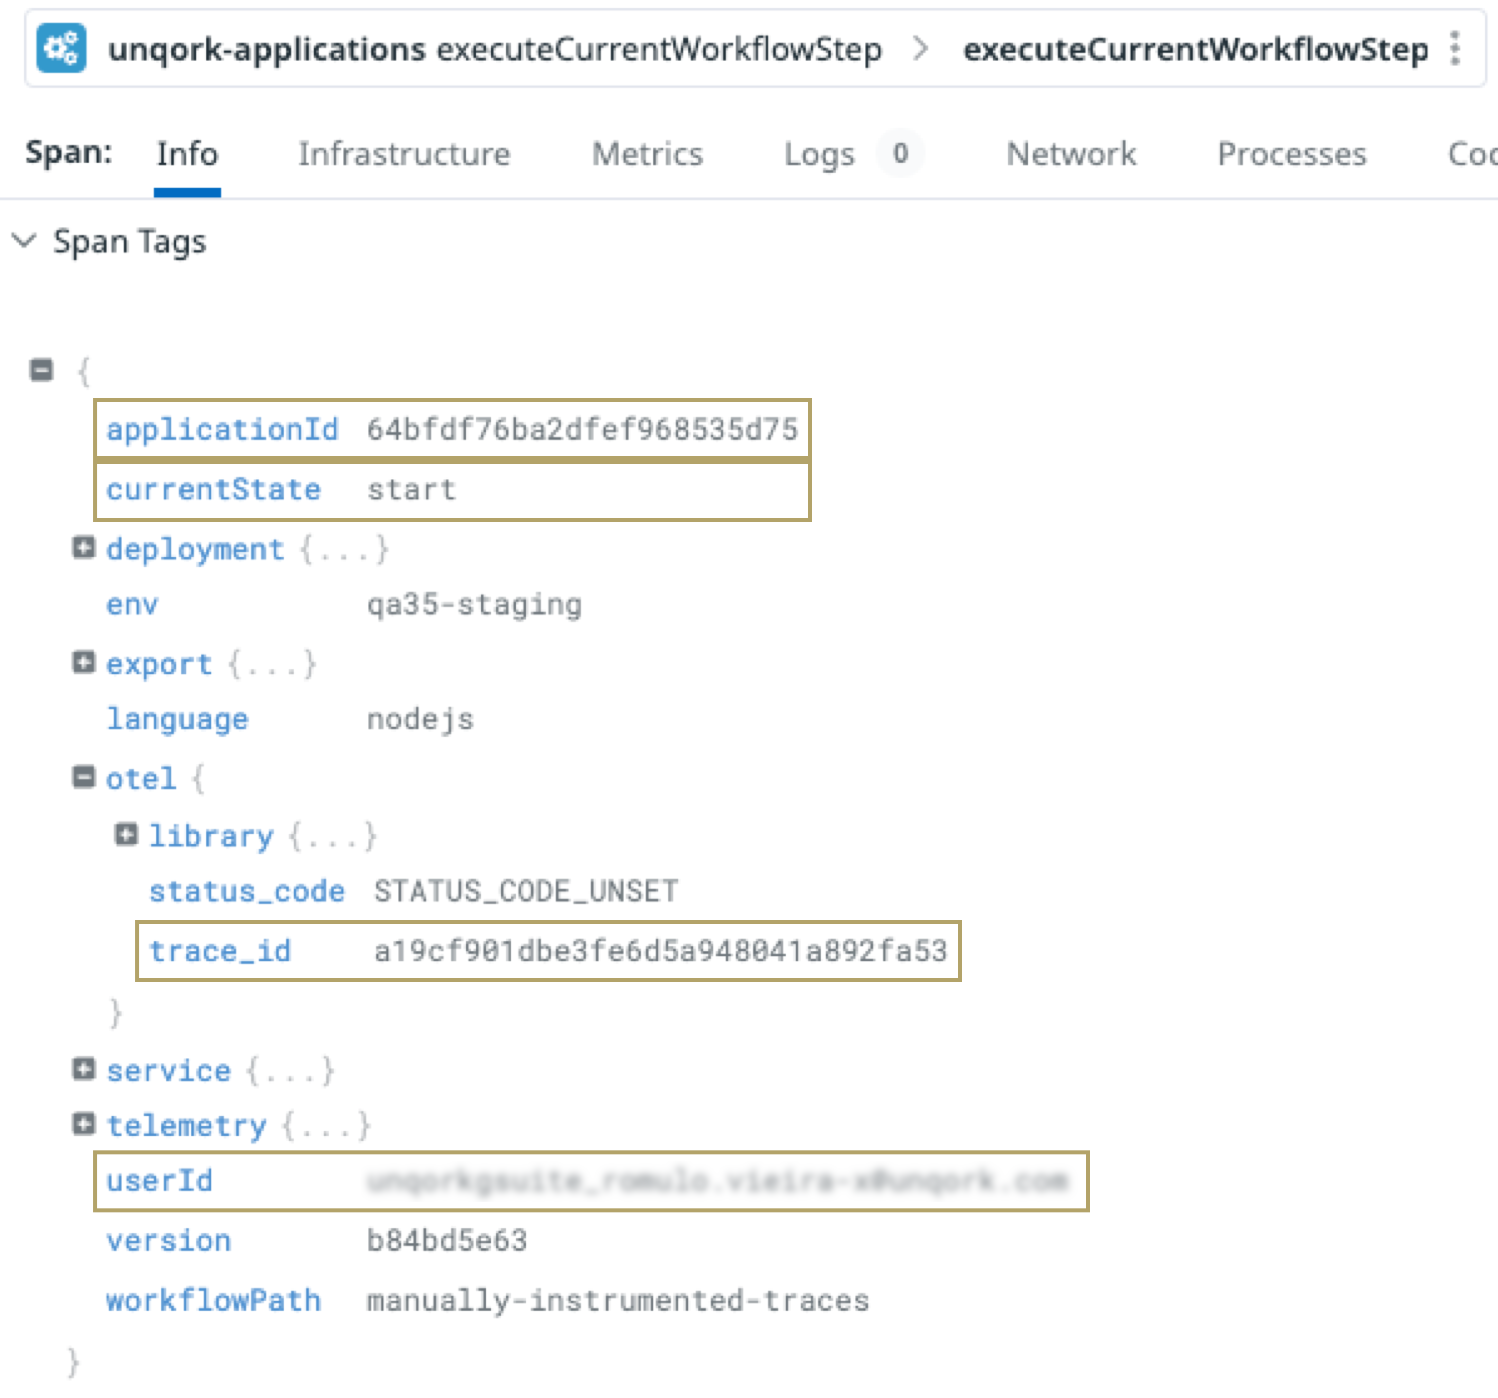
In the image above, we can see detailed information about the execution step. From the Datadog tags, we get insight about the application that was executed and where the data exists in Datadog.
The following table highlights some of the most important information:
Element | Description |
|---|---|
applicationId | The application's unique identifier. |
currentState | The name of the workflow step. |
otel.trace_id | The trace's unique identifier. |
userId | The user who executed the workflow step. |
Building Custom Metrics
Now that you have your trace, you can build a custom metric to filter by a specified query. In this example, we'll query based on a specific Unqork environment and application ID. The following example returns information for an application ID in the specified Unqork environment.
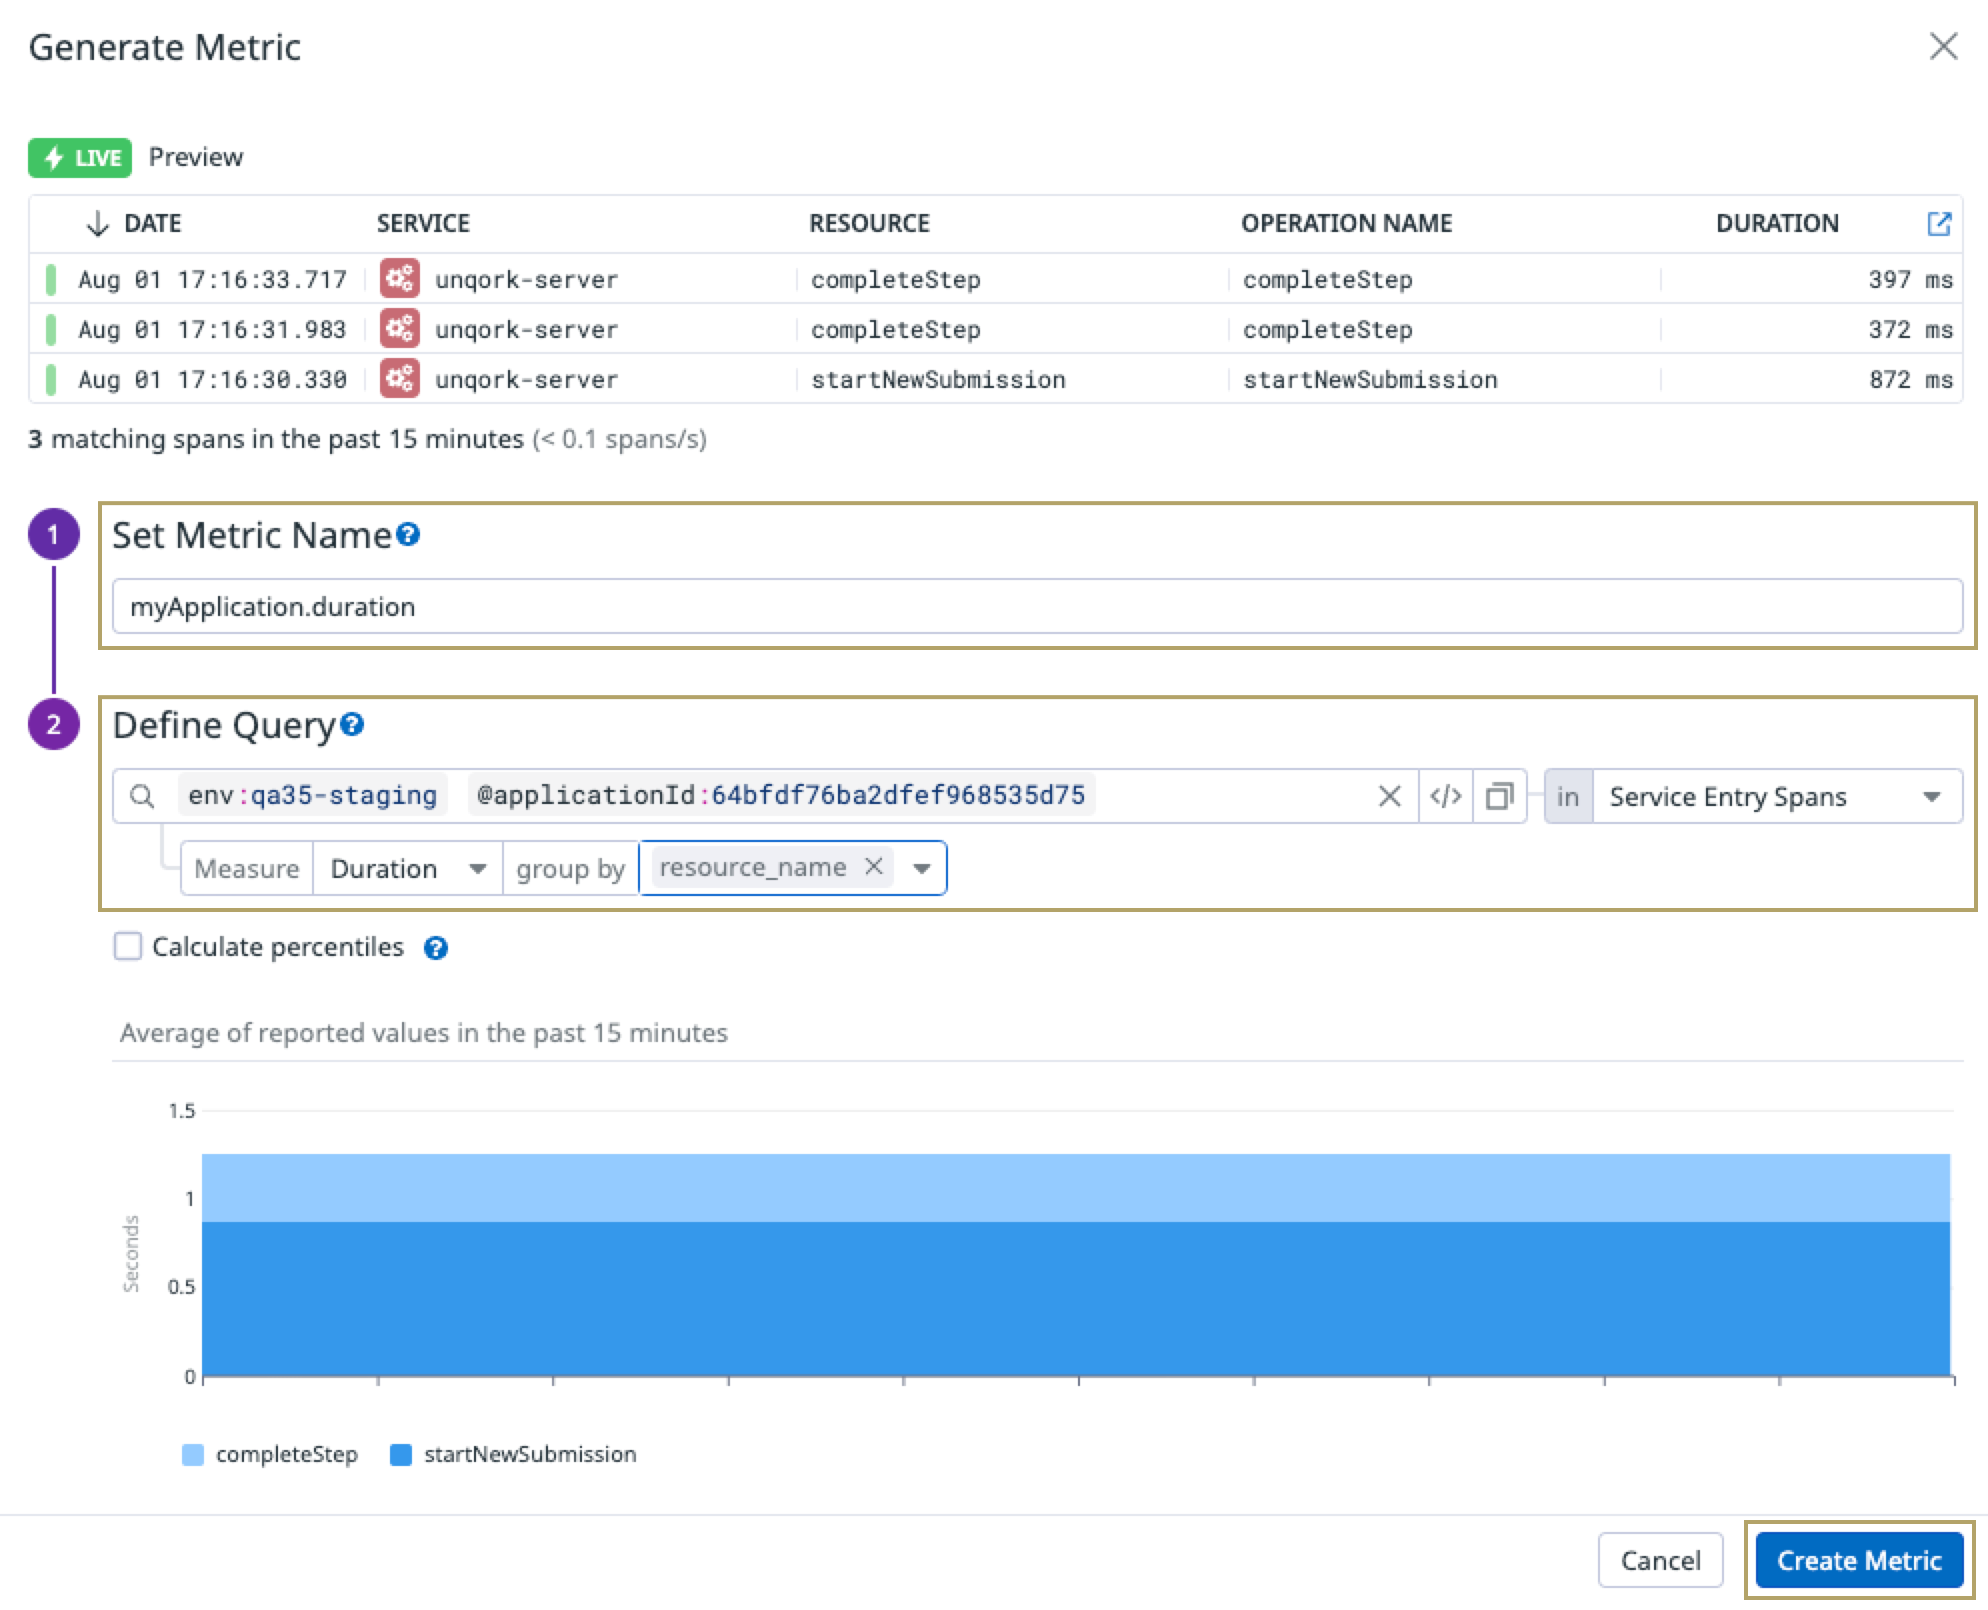
Open your browser and click the following link: https://app.datadoghq.com/apm/traces/generate-metrics.
To log in, enter your Datadog username and password credentials.
Click New Metric.
In the Set Metric Name field, enter a name for your metric. In this example, we entered myApplication.duration.
In the Define Query field, enter one or more queries. For this example, you'll enter
env:qa35-staging and @applicationId:64bfdf76ba2dfef968535d75.Click Create Metric.
Once created, you can use this metric to configure dynamic charts in a dashboard to visualize the performance of your applications.
Splunk APM Integration
With Splunk APM integration, you can use powerful visualization tools to display your span attributes.
Splunk clients must have the Observability Cloud package for Unqork to support the integration.
Viewing a Trace
Traces are a collection of correlated spans that provide a high-level view of what occurs when an application request is made. The Splunk APM integration collects and analyzes spans and traces from each of the services that you have connected. You can access spans from the menu to the left of your Splunk account.
Let's use the image to the right as an example to better explain a Splunk trace. In this image, you can see the spans that describe a workflow execution in an Unqork application.
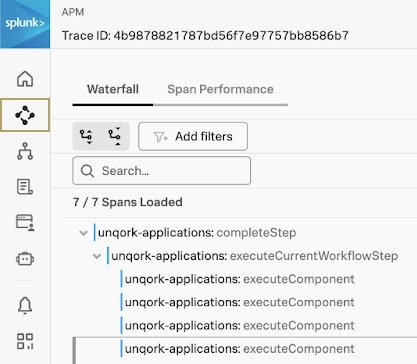
In the image below, you can see the spans that describe a workflow execution in an Unqork application. The image displays the child processes that occur as part of the parent process. The execution starts with the unqork-applications:completeStep parent operation. As part of the parent process, the unqork-applications:executeCurrentWorkflowStep child operations run. After executing the components as part of the workflow step, the parent process ends.

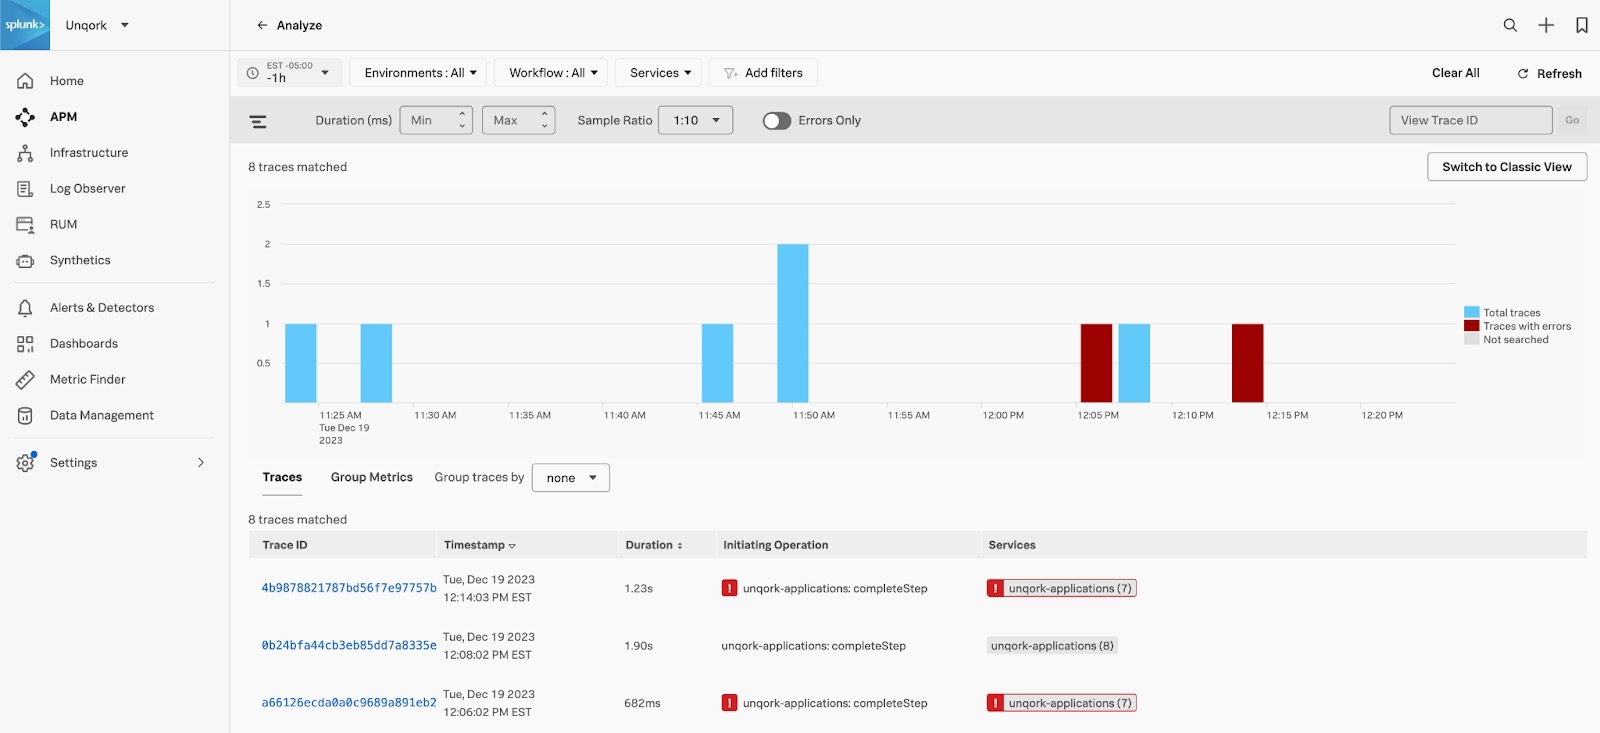
You can also filter for specific traces to analyze errors that occurred. In the example image below, you can filter a trace to identify its trace IDs, the execution step, how long a execution took, and if there were errors.
Viewing a Span
Let's look deeper into the final child span of the unqork-applications:executeCurrentWorkflowStep process to understand what happened during the workflow execution.
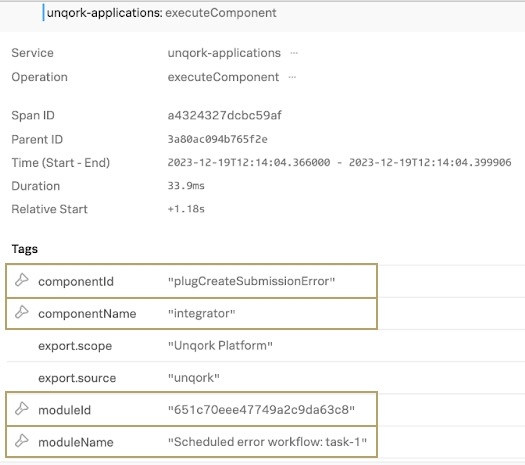
In the image above, we can see detailed information about the execution step. From the Splunk tags, we get insight that the executed component was an integrator (or Unqork Plug-In component) with a Property ID of plugCreateSubmissionError. The tags also display the module name and ID where the component exists.
The following table highlights some of the most important information:
Element | Description |
|---|---|
componentId | The Property ID of the component executed in the workflow step. |
componentName | The type of Unqork component executed in the workflow step. |
moduleId | The unique identifier of the module where the component exists. |
moduleName | The name of the module where the component exists. |
Error and Latency Visualizations
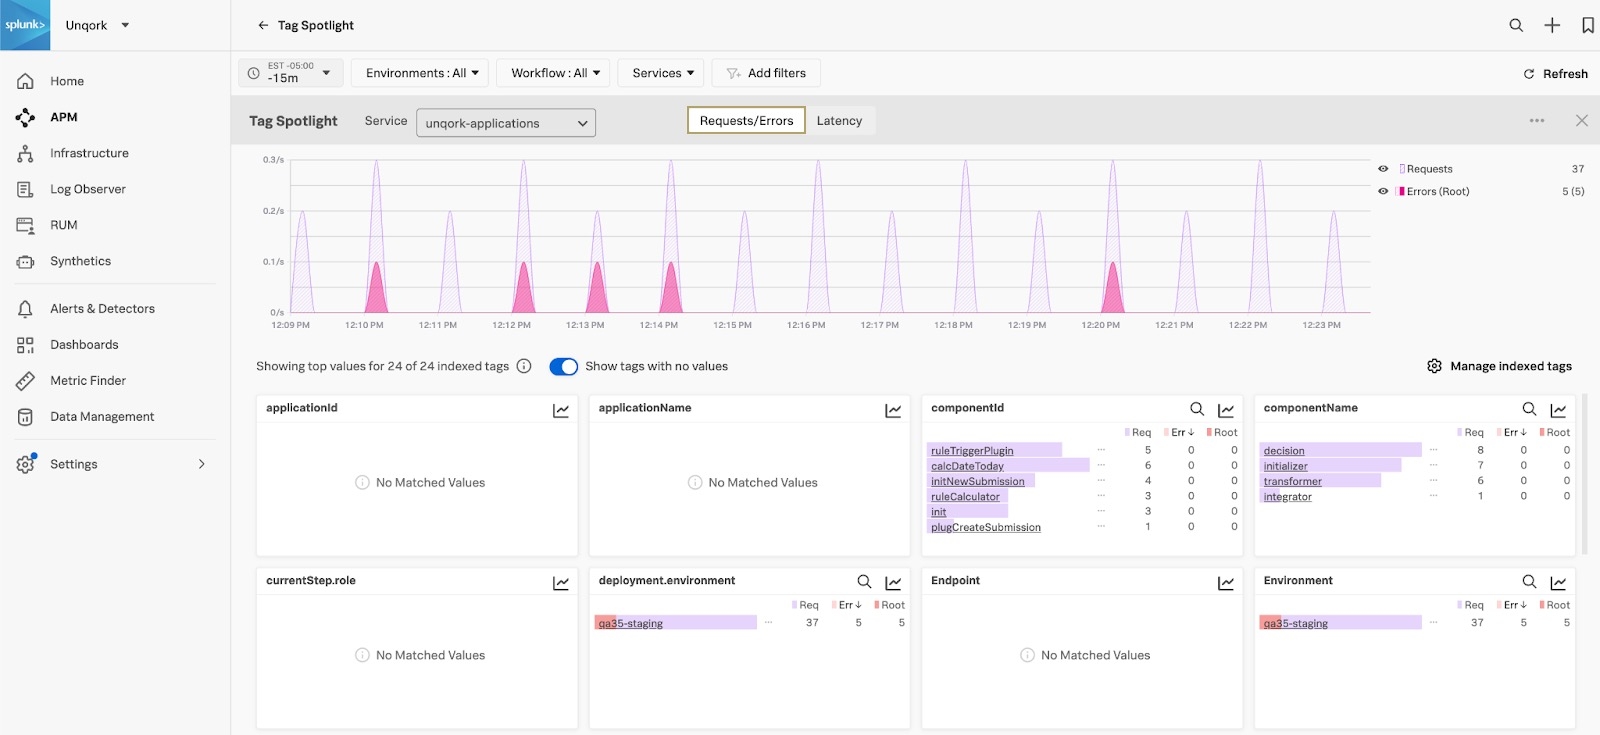
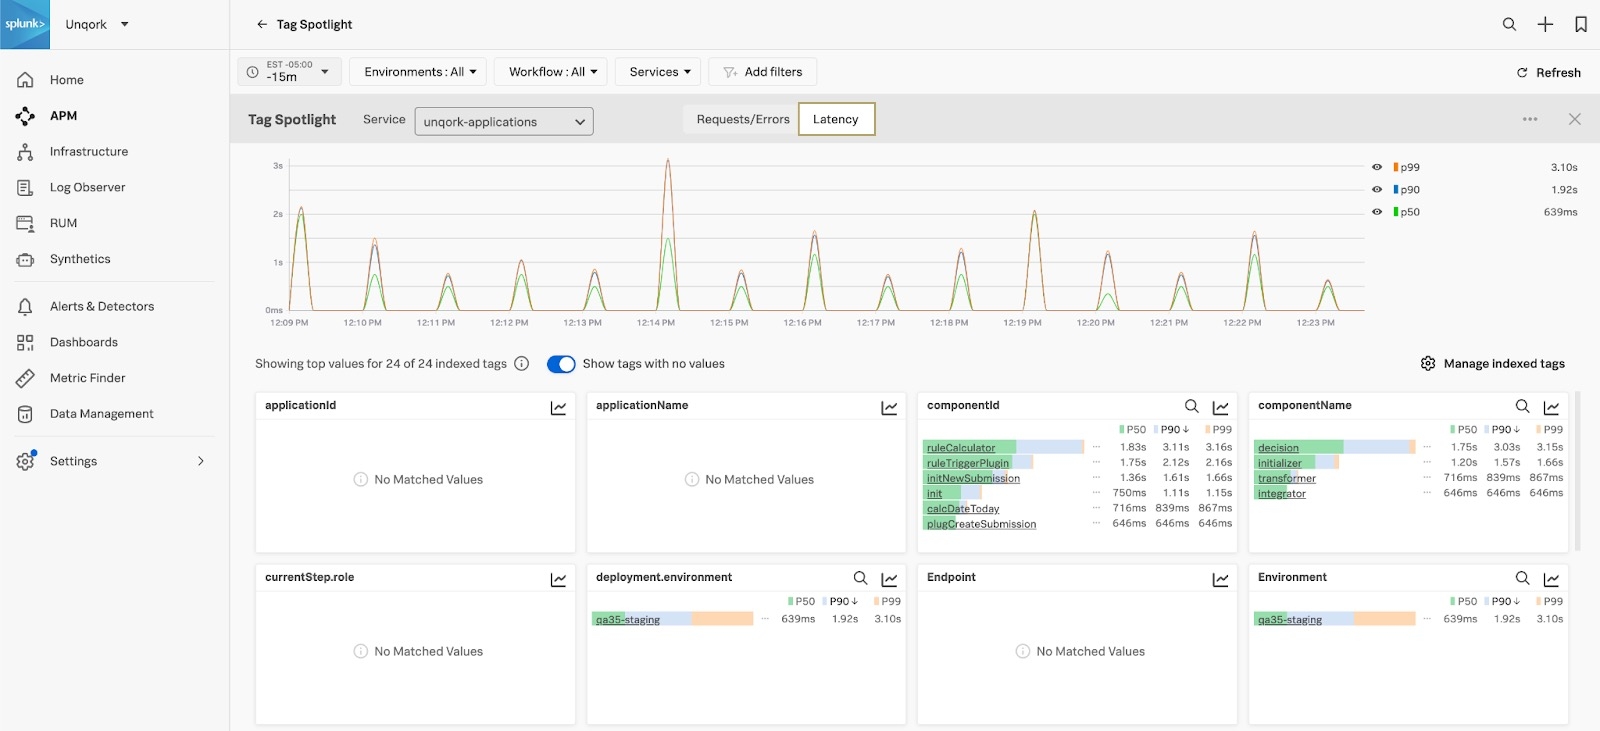
Splunk also generates powerful visualizations based on your span data. That way, you can monitor your executions and determine if there are request errors or latency. The images below are examples of the insights you can gather from the performance of your environment, applications, and components.
Requests and Errors:
Latency:
To customize your metrics and take advantage of these analytics, your administrator must add Monitoring MetricSets. You can use Monitoring MetricSets to monitor request and error rates, durations, and so on based on your traces and spans. Your administrator can customize Monitoring MetricSets from the Splunk APM settings.
The image below is an example of the types of MetricSets you can customize: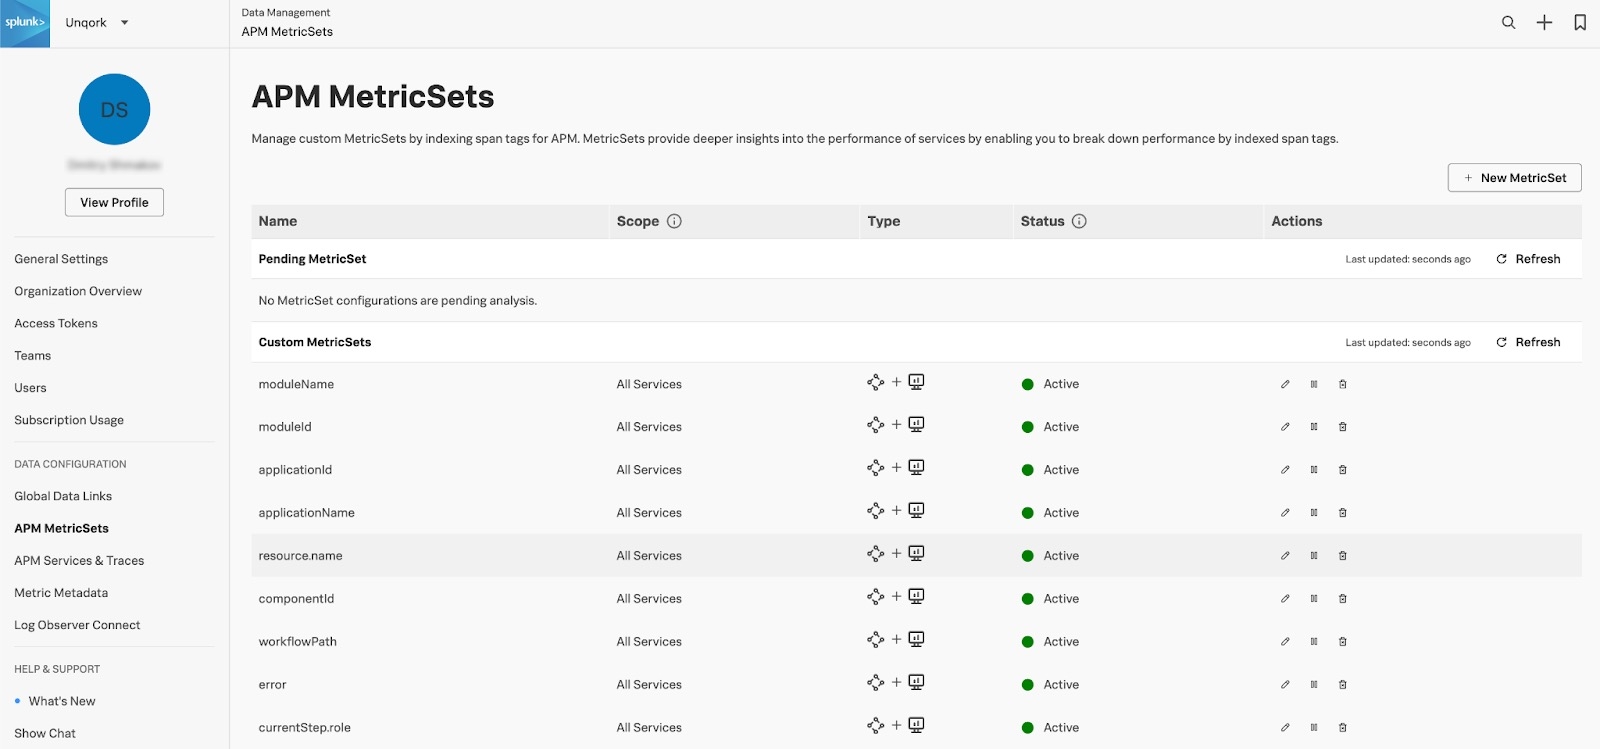
To learn more about Monitoring MetricSets, view Splunk's APM documentation: https://docs.splunk.com/observability/en/apm/span-tags/metricsets.html.
Best Practices
Learn more about APM best practices in the sections below:
Cost Management
Enabling APM can increase costs significantly based on the volume of data generated. Costs are typically influenced by:
The number of end-users interacting with your applications.
The complexity of your application design.
The sampling rate you configure with your APM provider.
Please monitor your APM provider's billing and cost dashboards regularly to manage consumption.
Security
API Key and Secrets should be securely protected. Consider the following:
Do not include your
API Keyor any otherSecretsdirectly in the ZenDesk support ticket.Do share
Secretsonly with the assigned Unqork engineer via the secure SendSafely link provided.
Environment Strategy
We strongly recommend the following approach to APM deployment:
Start with a lower environment, like UAT or Staging, for initial testing and validation.
This strategy allows you to fully understand the data volume and cost implications before you enable APM in your mission-critical Production environment.