The KPI component is a Centauri v1.0 component that lets Creators display KPIs (key performance indicators) to measure and present a key metric in an application. For example, you can display the number of submissions or a net sales dollar value on your dashboard.
You can find the KPI component under the Charts & Graphs group to the left of the Module Builder.
About the Configuration Window
To learn more about general component settings, view our General Component Settings article.
Display Panel
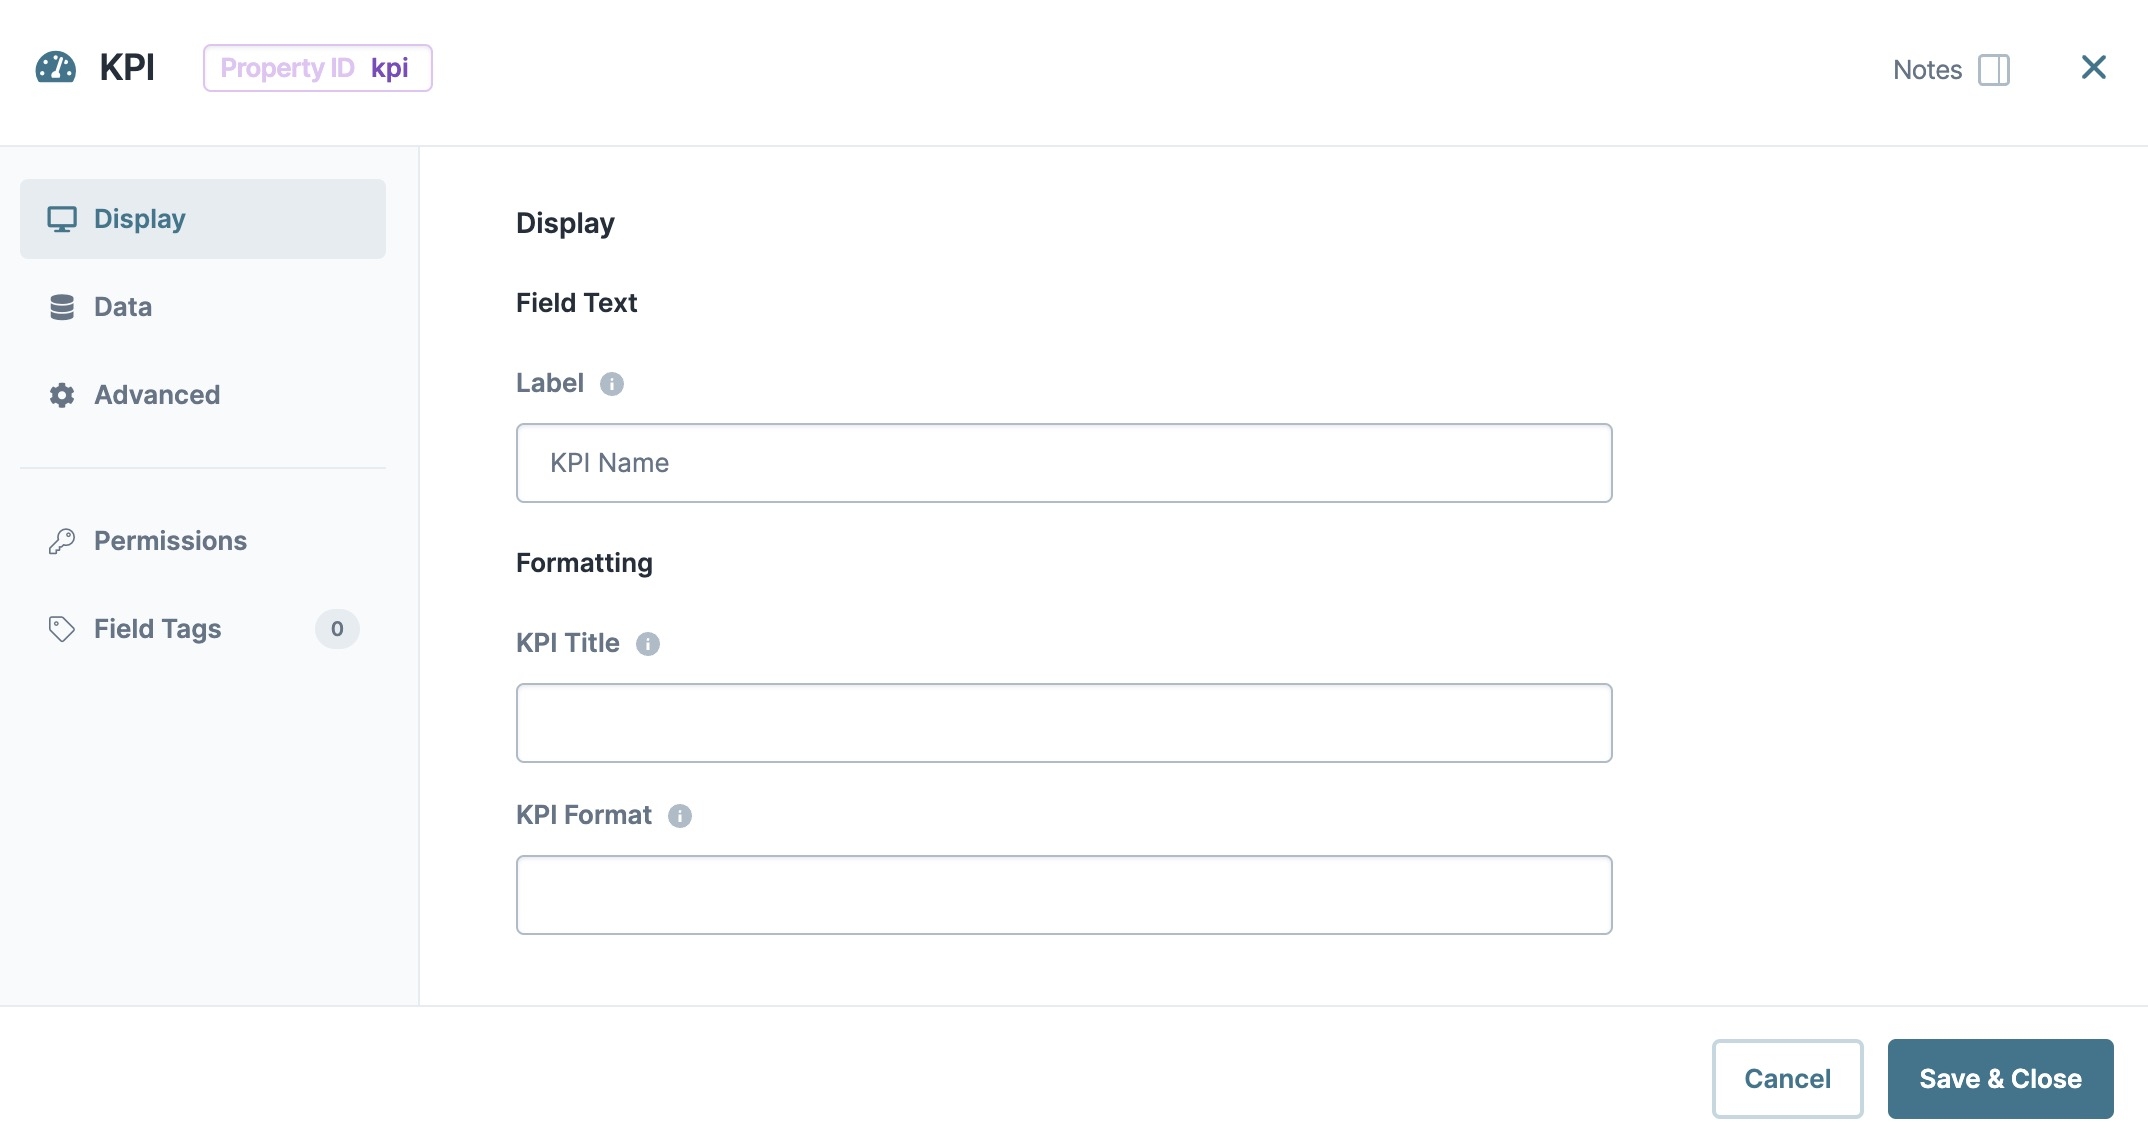
Field Text
Setting | Description |
|---|---|
Label | The Label conveys what the input component is and what information it displays. Enter the purpose of the corresponding component or field. User-friendly labels make your module more accessible. Keep labels short and descriptive (a word or two) using title case. For longer entries, use sentence case. |
Formatting
Setting | Description |
|---|---|
KPI Title | The title that displays above the KPI widget in Express View. |
KPI Format | Adds a prefix or suffix to your KPI widget. To set the KPI format, enter {Prefix}X{Suffix}. |
Data Panel
Inputs
Setting | Description |
|---|---|
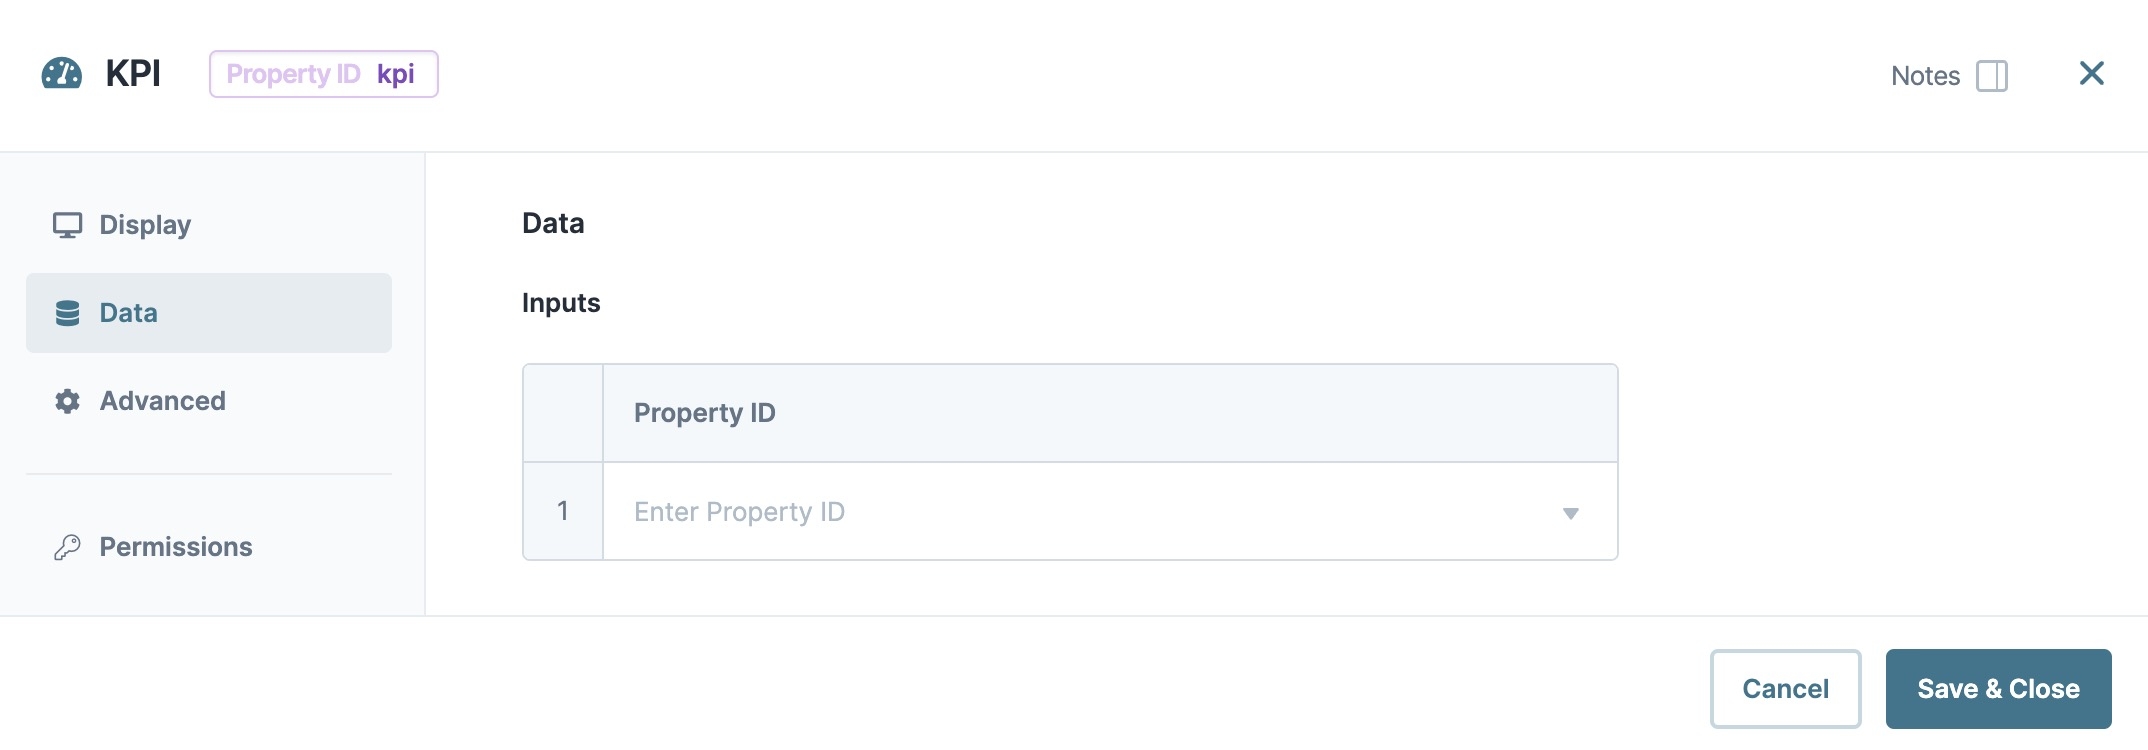
Inputs | Enter the Property ID where you stored your value. Your KPI widget displays the value you enter into the Inputs table.
|
Advanced Panel
Additional Styling
Setting | Description |
|---|---|
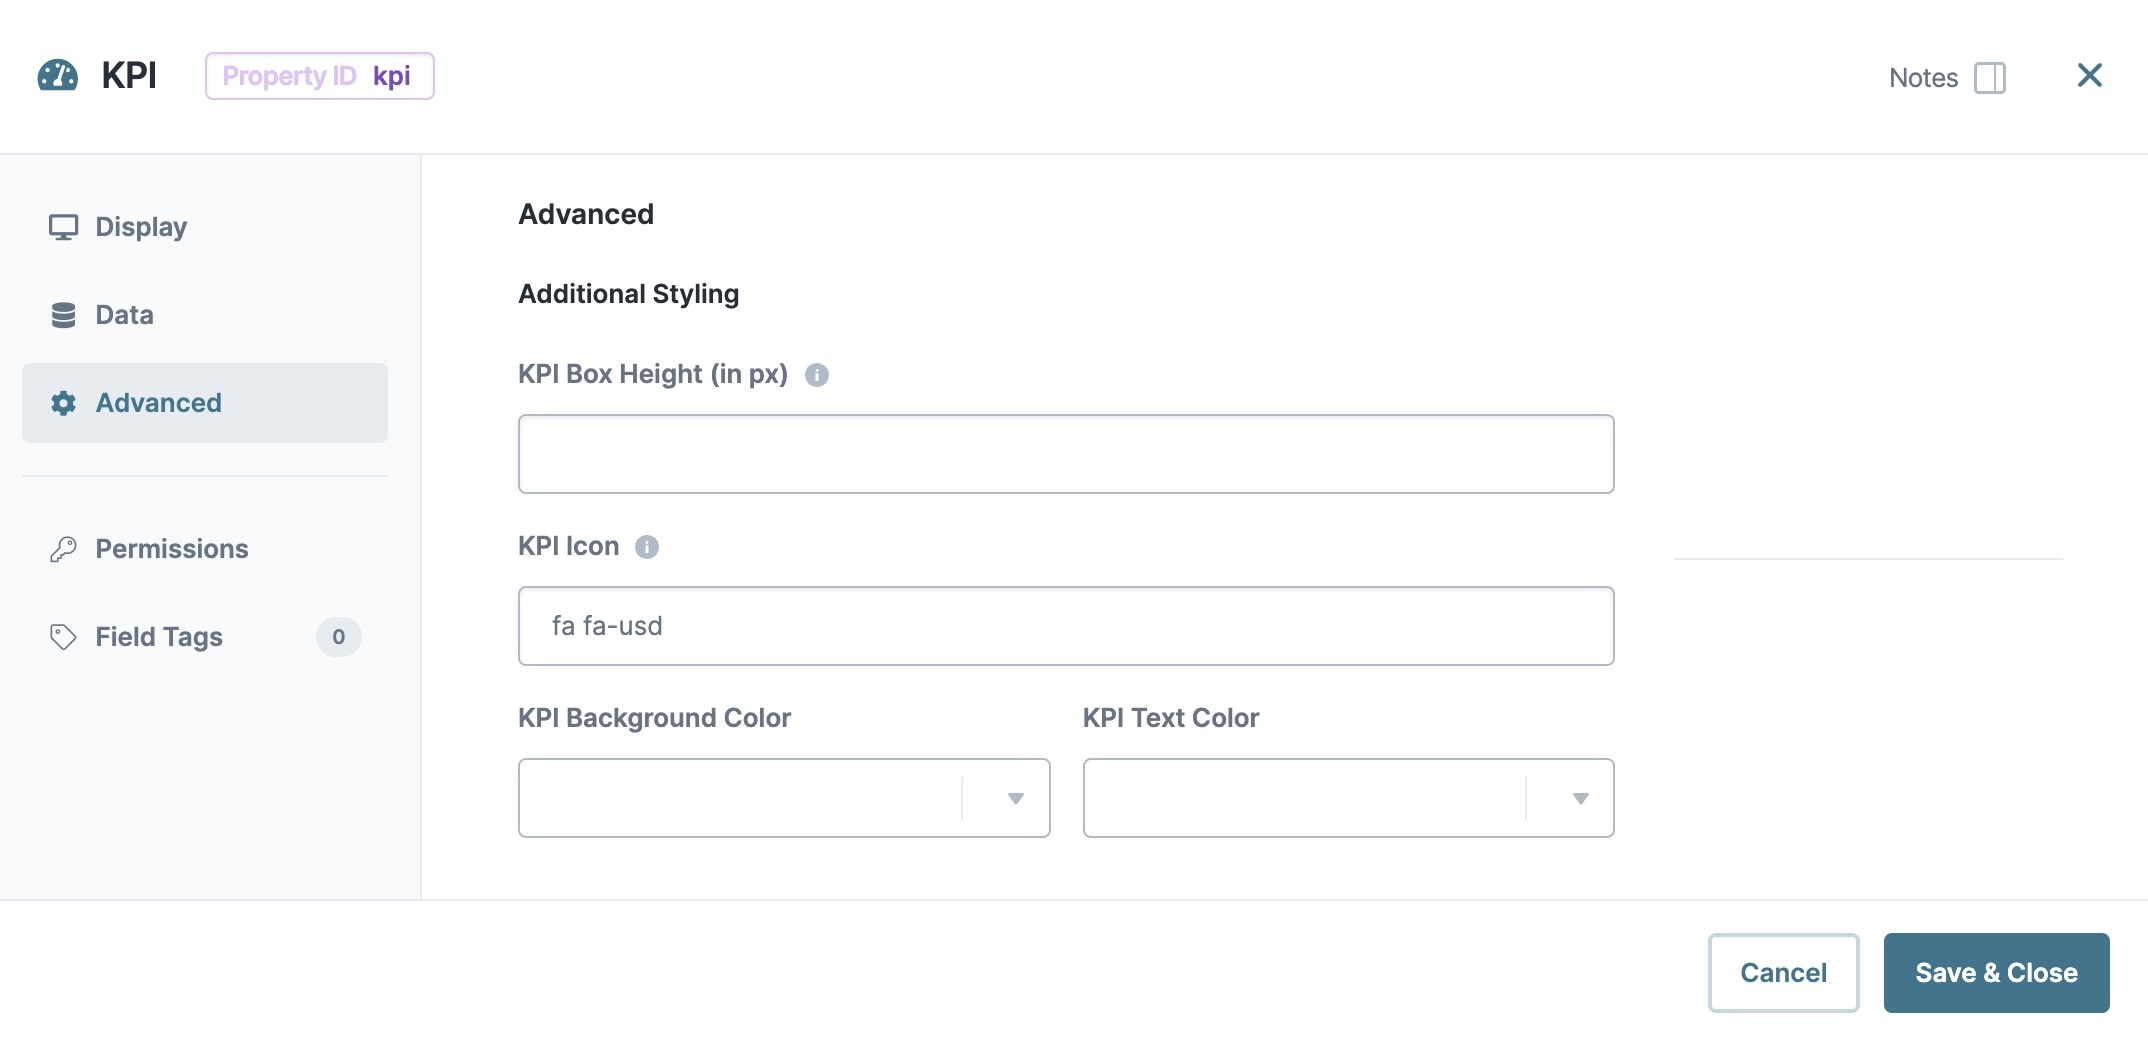
KPI Box Height (in px) | Enter a value (in pixels) to set the box height of your KPI widget. |
KPI Icon | Add an icon for your KPI widget by entering the icon class string. For example, to use Font Awesome US dollar icon, enter
|
KPI Background Color | Use this drop-down to set a background color for your KPI widget. Your local style sheet determines the color options available in your KPI Background Color Options menu.
|
KPI Text Color | Select the text color you want to display in your KPI widget. |
Adding a KPI Component
For this example, create an application that displays the total customer submissions to the end-user. Use a Data Workflow component to sum the number of submissions in a submission data set. Then, display that number on your application using a KPI widget.
These instructions assume that you have an open module saved with a title.
Configure the Data Table Component
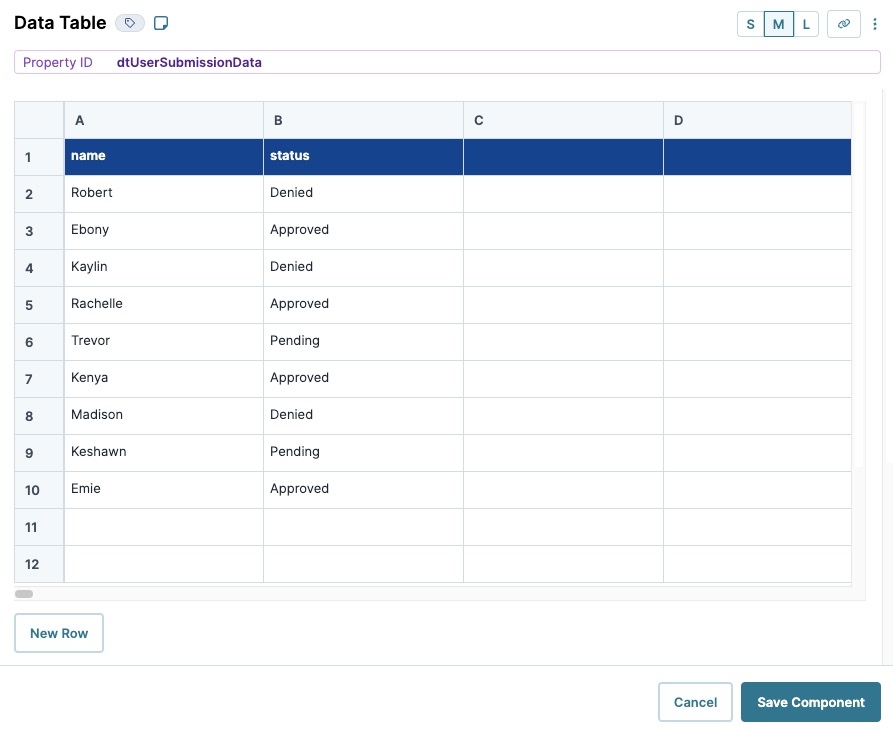
Begin by adding the example submission data to a Data Table component.
In the Module Builder, drag and drop a Data Table component onto your canvas.
In the Property ID field, enter dtUserSubmissionData.
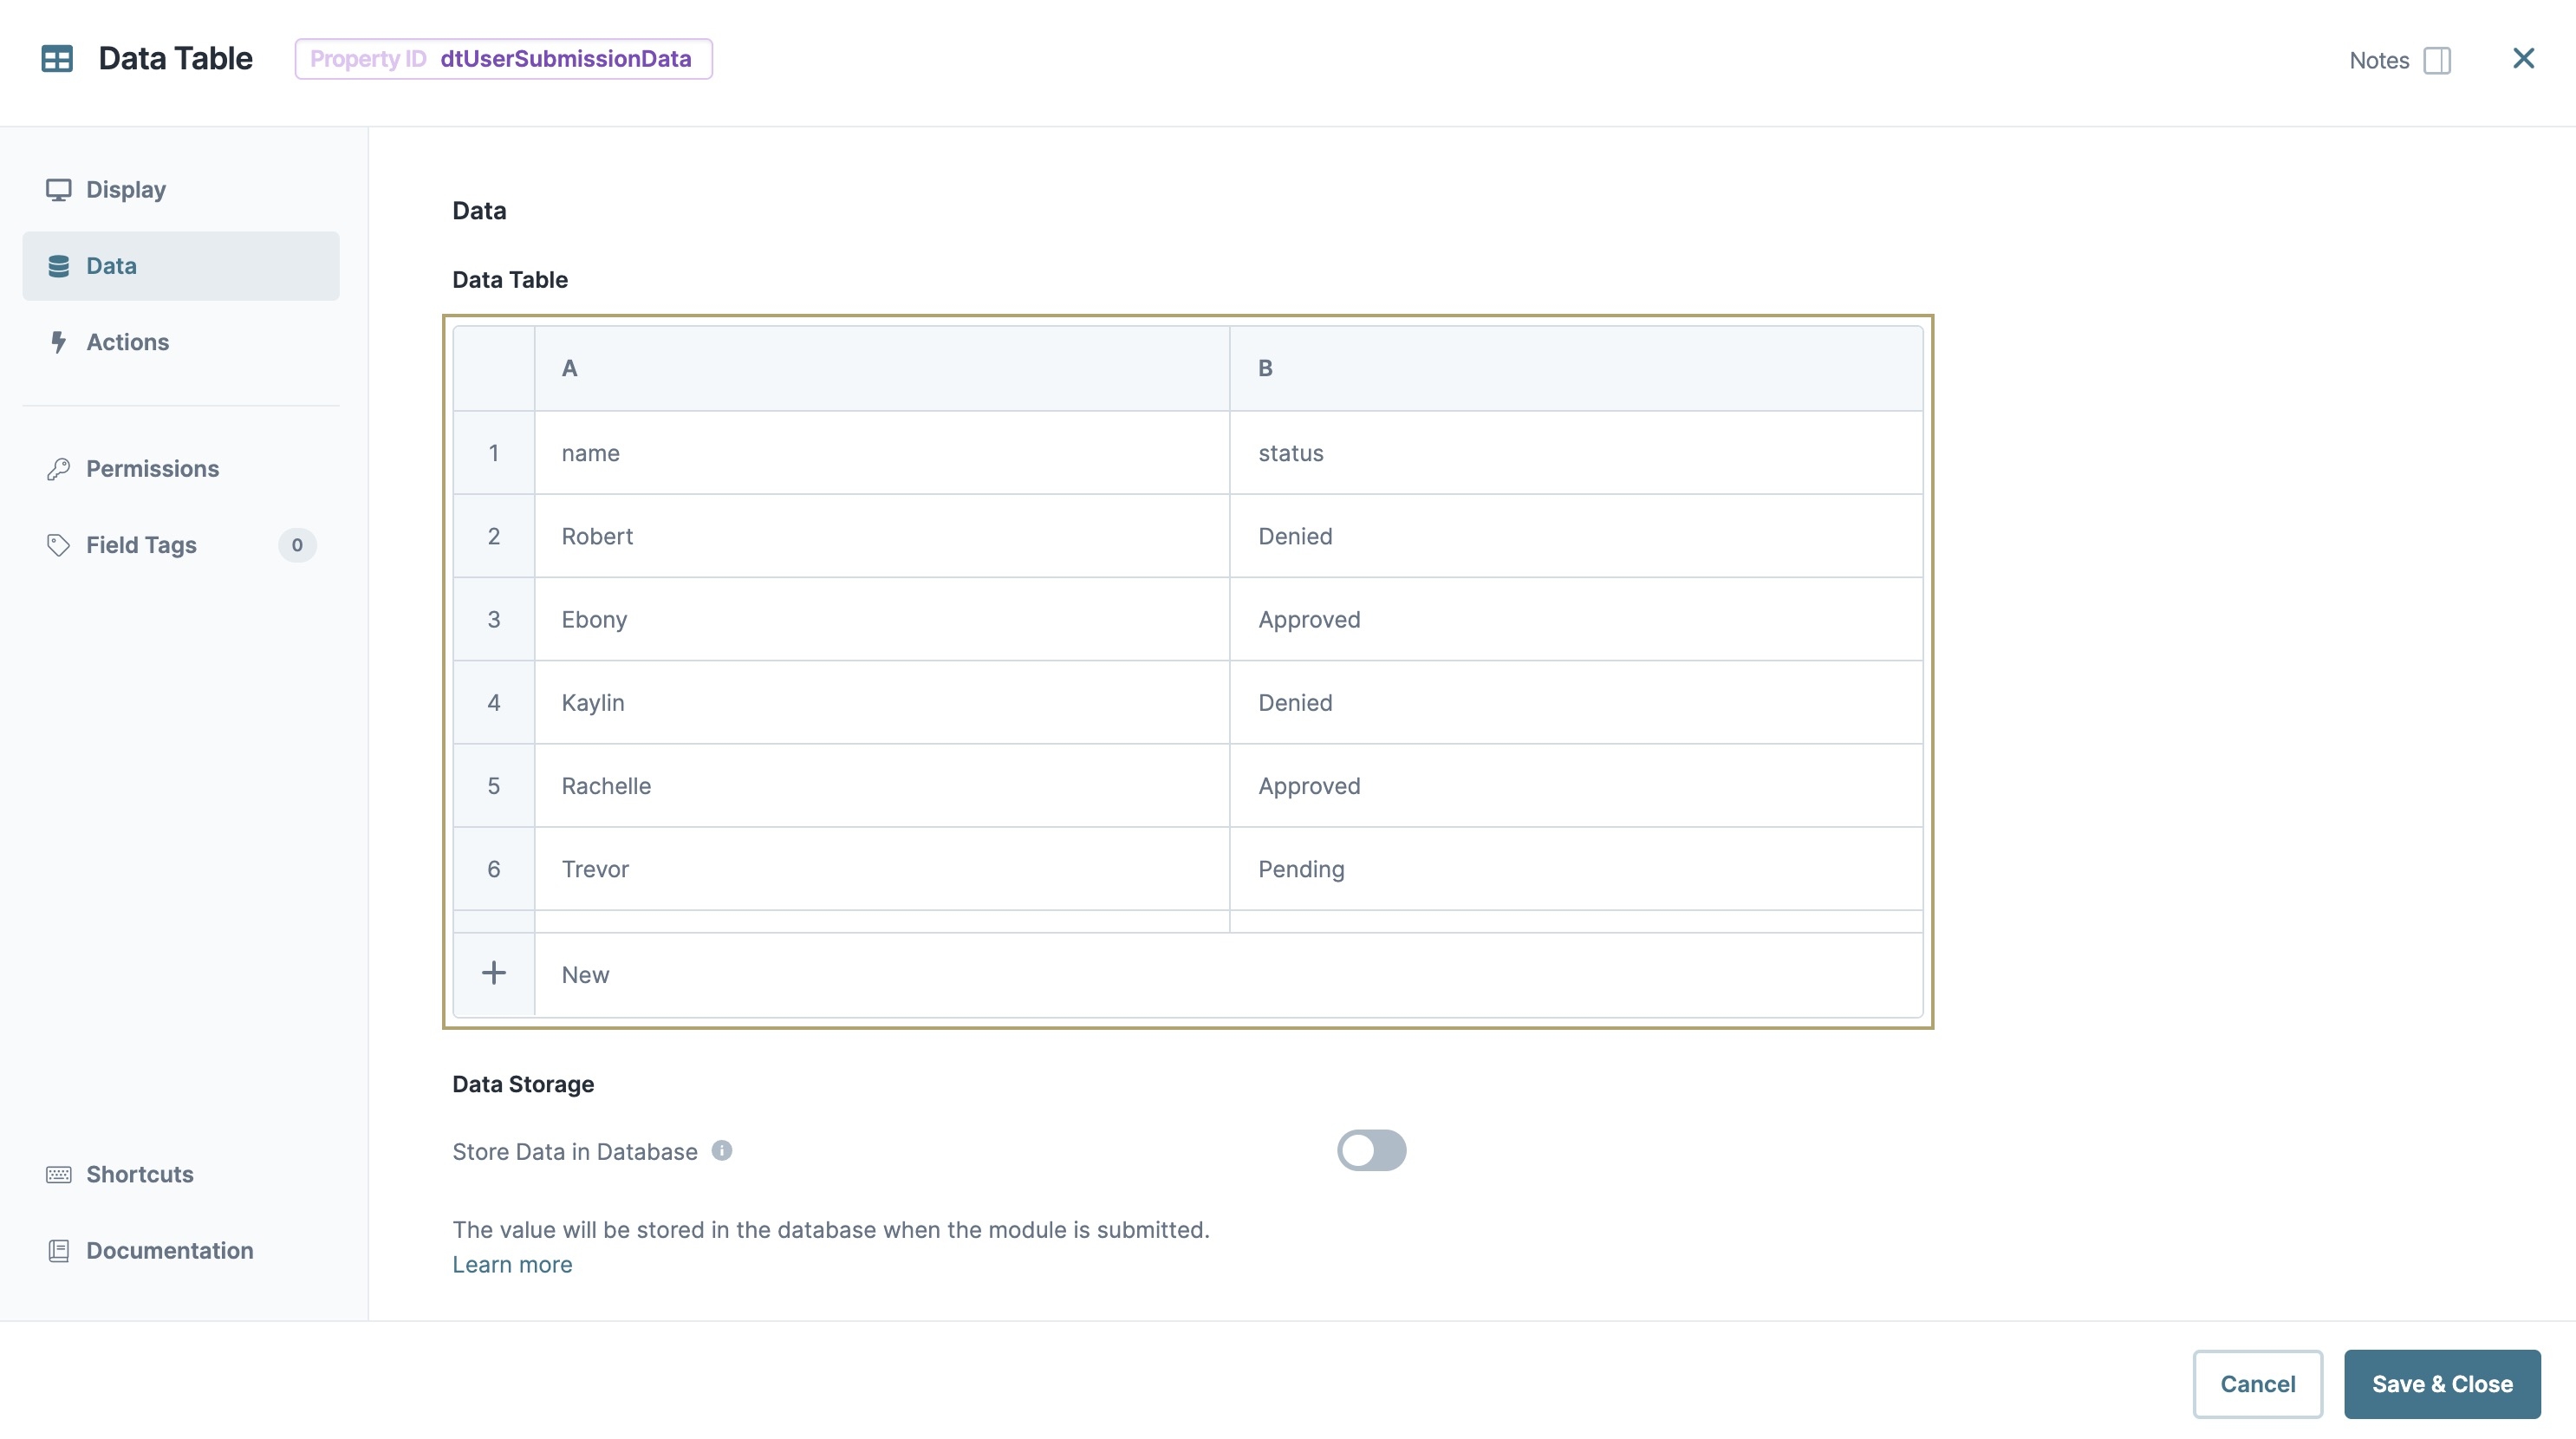
In the data table, enter the following:
A
B
1
name
status
2
Robert
Denied
3
Ebony
Approved
4
Kaylin
Denied
5
Rachelle
Approved
6
Trevor
Pending
7
Kenya
Approved
8
Madison
Denied
9
Keshawn
Pending
10
Emie
Approved
Click Save Component.
Configure the Hidden Component
This Hidden component stores the number of submissions. Your KPI component references this data to display to the end-user.
Drag and drop a Hidden component onto the canvas, placing it below your dtUserSubmissionData Data Table component.
In the Property ID and Label Text fields, enter
kpiData.Click Save Component.
Configure the Data Workflow Component
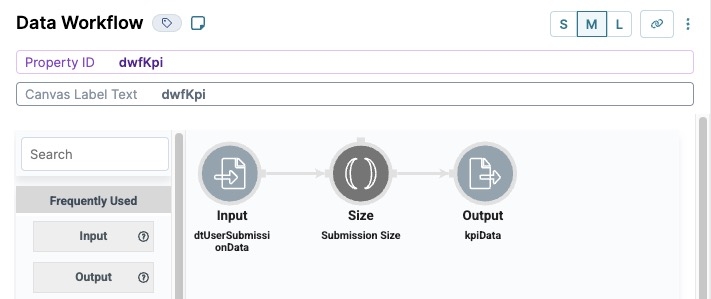
Use a Data Workflow component to output the number of submissions from the Data Table component. Once your Data Workflow factors the number of submissions, it stores it in your Hidden component.
Drag and drop a Data Workflow component onto the canvas, placing it between the dtUserSubmissionData Data Table and kpiData Hidden components.
In the Property ID field, enter dwfKpi.
In theCanvas Label Text, enter
dwfKpi.Navigate to the Actions settings
Set the Trigger Type to
.png) Watch.
Watch.
Configure the Input Operator
Drag and drop an Input operator onto your Data Workflow canvas.
Configure the operator's Info window as follows:
Info
Category
Input
Component
dtUserSubmissionData
Required
Yes
Source
Default
Configure the Size Operator
Drag and drop a Size operator onto your Data Workflow canvas.
Configure the operator's Info window as follows:
Info
Category
Size
Label
Submission Size
Preserve Argument Type
☐ (unchecked)
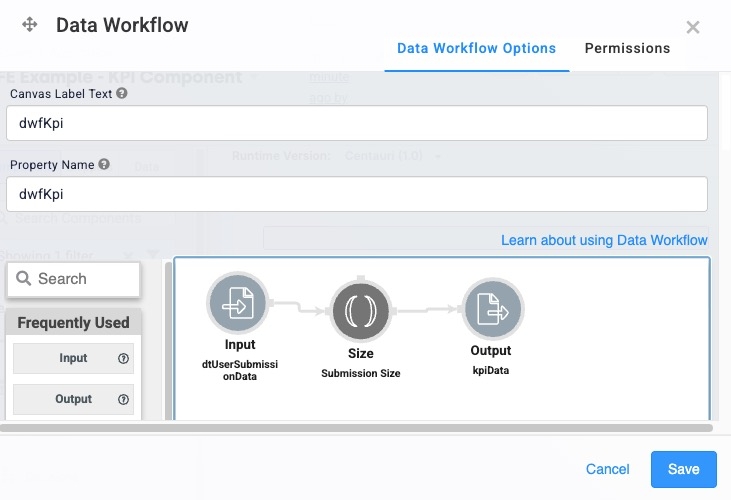
Connect the output port (right) of the dtUserSubmissionData Input operator to the input port (left) of the Submission Size Size operator.
Configure the Output Operator
Drag and drop an Output operator onto the Data Workflow canvas.
Configure the operator's Info window as follows:
Info
Category
Output
Component
kpiData
Action
value
Connect the output port (right) of the Submission Size Size operator to the input port (left) of the kpiData Output operator.
Click Save Component.
Here's how the completed Data Workflow canvas looks:
Configure the KPI Component
Lastly, use a KPI component to display the total number of submissions.
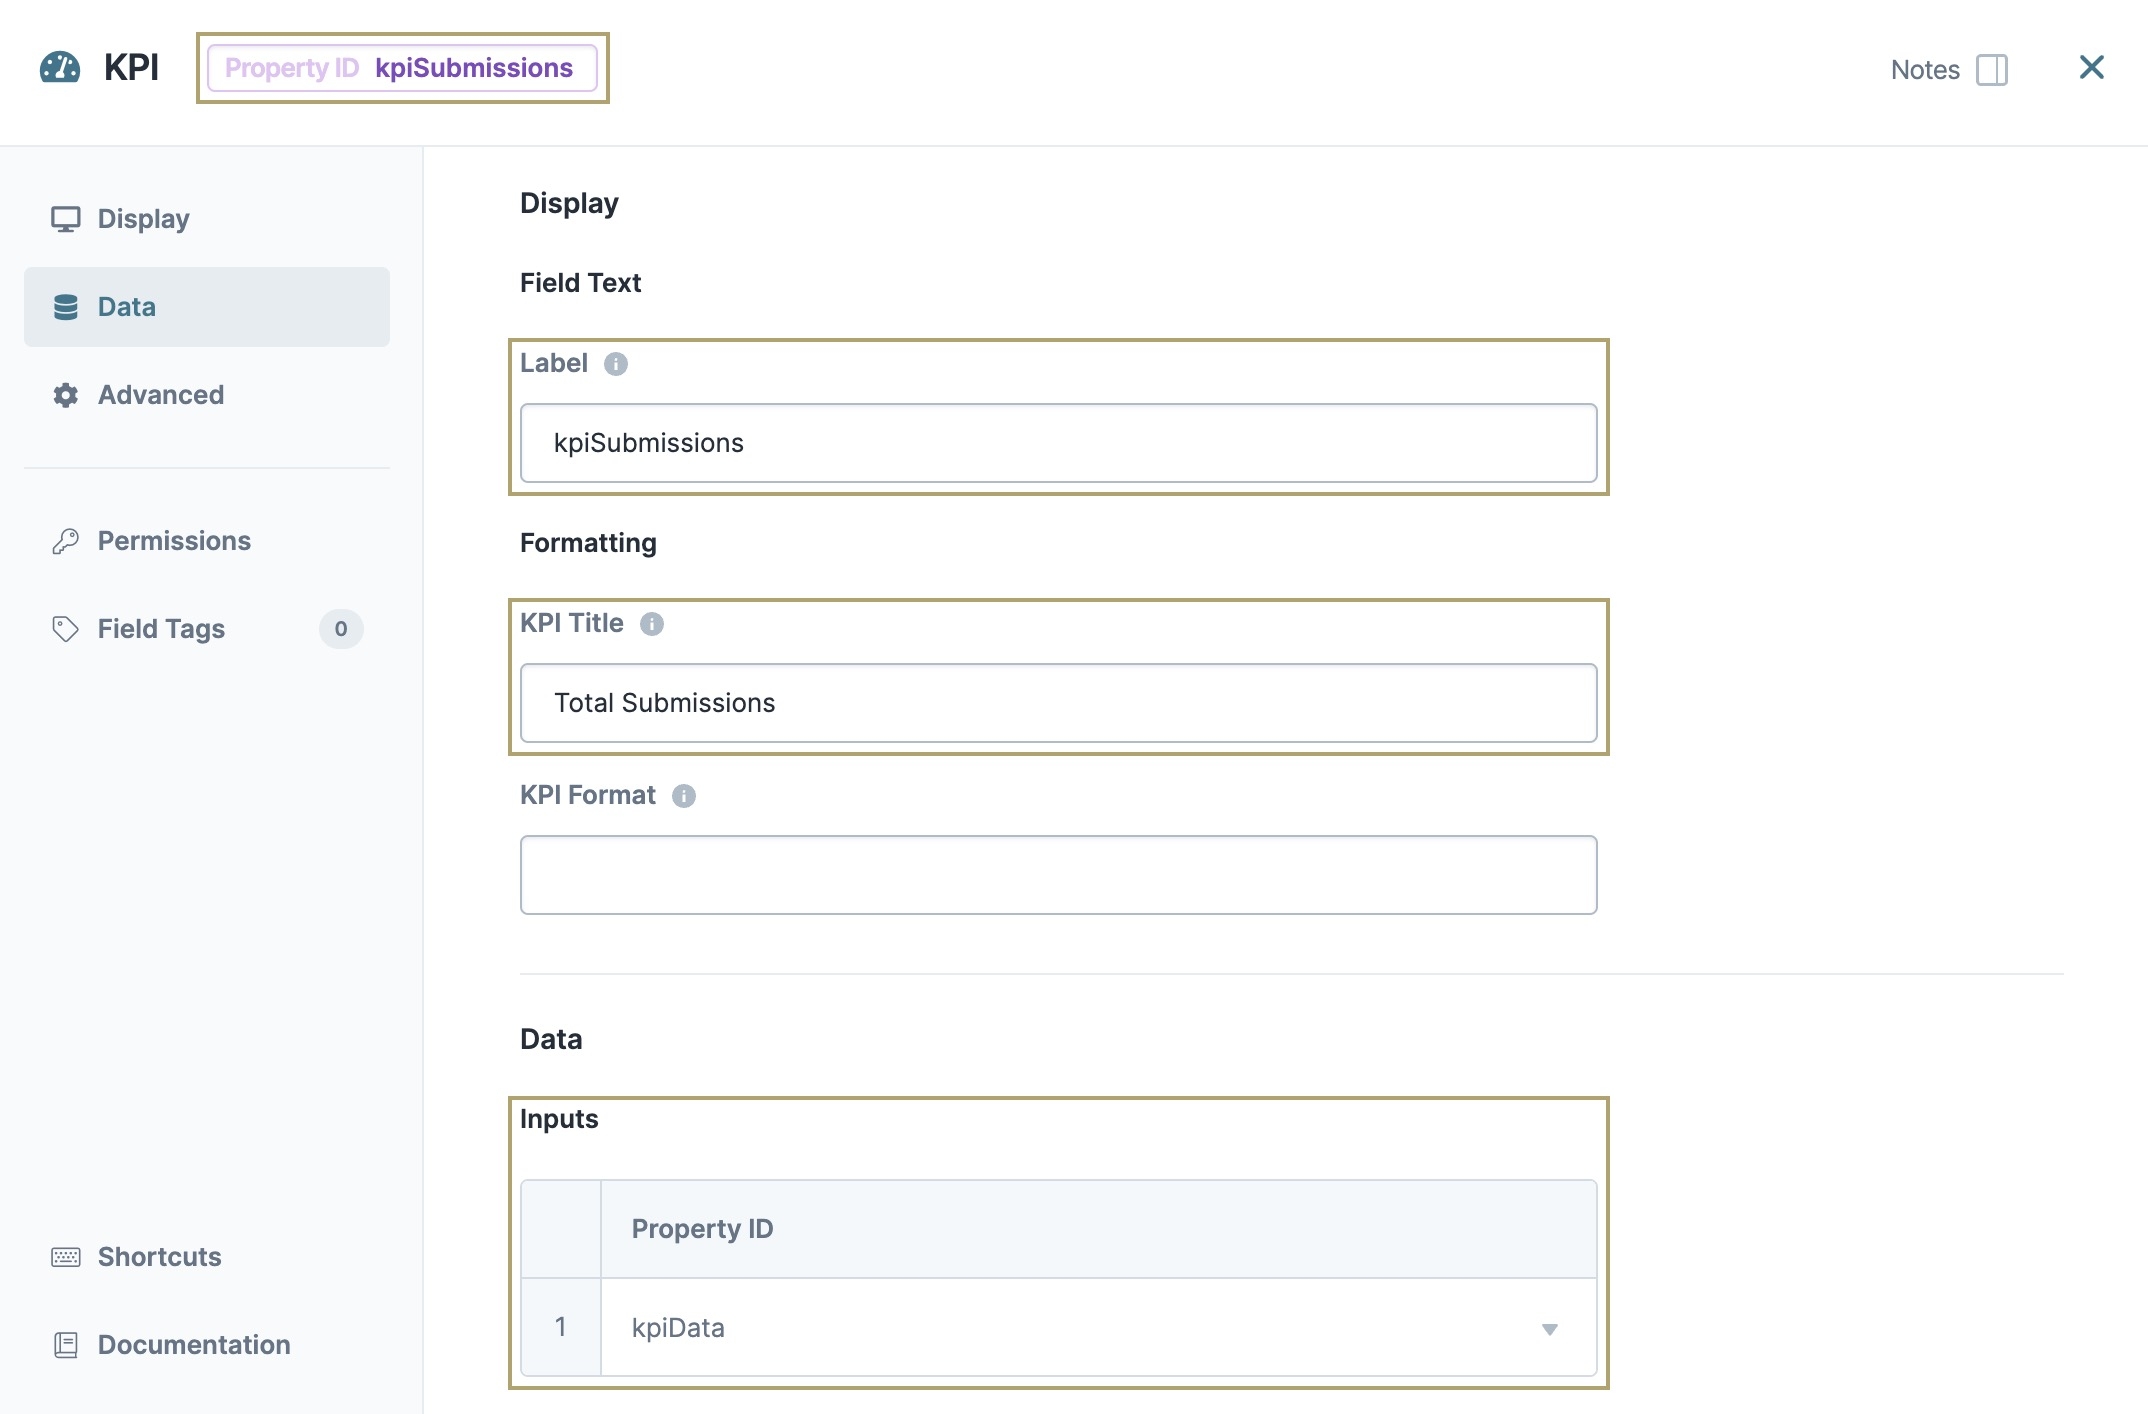
Drag and drop a KPI component onto the canvas, placing it below the kpiData Hidden component.
In the Property ID and Label Text fields, enter
kpiSubmissions.In the KPI Title field, enter
Total Submissions.Navigate to the Data settings.
From the Inputs drop-down, enter or select kpiData.
Navigate to the Advanced settings.
In the KPI Box Height field, enter
200.Click Save Component.
Save your module.
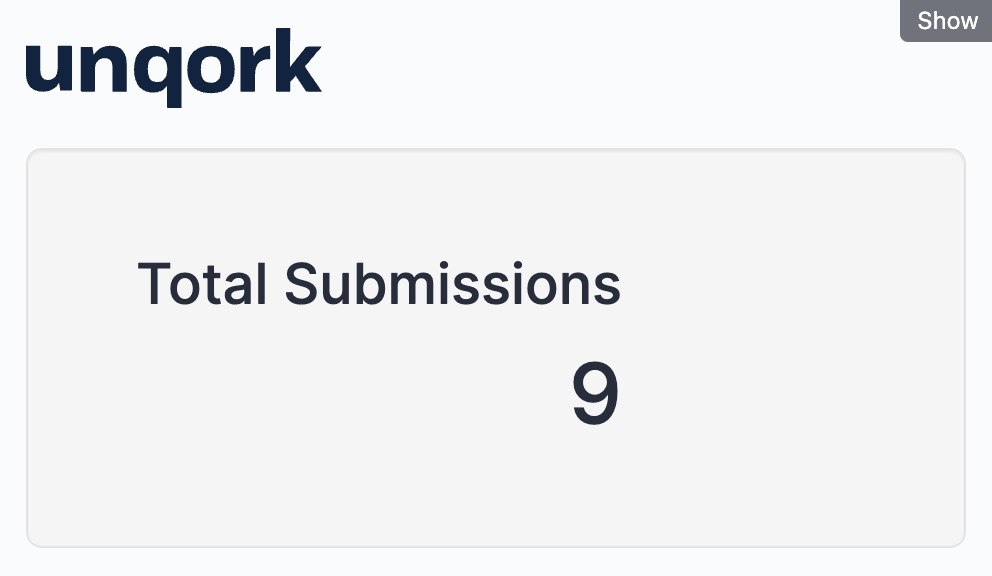
Preview your module in Express View to view the total number of submissions. The value is nine because you added nine rows of values to the dtUserSubmissionData .png) Data Table component.
Data Table component.
The KPI component is a Centauri v1.0 component that lets Creators display KPIs (key performance indicators) to measure and present a key metric in an application. For example, you can display the number of submissions or a net sales dollar value on your dashboard.
You can find the KPI component under the Charts & Graphs group to the left of the Module Builder.
About the Configuration Window
To learn more about general component settings, view our General Component Settings article.
Display Panel
Field Text
Setting | Description |
|---|---|
Label | The Label conveys what the input component is and what information it displays. Enter the purpose of the corresponding component or field. User-friendly labels make your module more accessible. Keep labels short and descriptive (a word or two) using title case. For longer entries, use sentence case. |
Formatting
Setting | Description |
|---|---|
KPI Title | The title that displays above the KPI widget in Express View. |
KPI Format | Adds a prefix or suffix to your KPI widget. To set the KPI format, enter {Prefix}X{Suffix}. |
Data Panel
Inputs
Setting | Description |
|---|---|
Inputs | Enter the Property ID where you stored your value. Your KPI widget displays the value you enter into the Inputs table.
|
Advanced Panel
Additional Styling
Setting | Description |
|---|---|
KPI Box Height (in px) | Enter a value (in pixels) to set the box height of your KPI widget. |
KPI Icon | Add an icon for your KPI widget by entering the icon class string. For example, to use Font Awesome US dollar icon, enter
|
KPI Background Color | Use this drop-down to set a background color for your KPI widget. Your local style sheet determines the color options available in your KPI Background Color Options menu.
|
KPI Text Color | Select the text color you want to display in your KPI widget. |
Adding a KPI Component
For this example, create an application that displays the total customer submissions to the end-user. Use a Data Workflow component to sum the number of submissions in a submission data set. Then, display that number on your application using a KPI widget.
These instructions assume that you have an open module saved with a title.
Configure the Data Table Component
Begin by adding the example submission data to a Data Table component.
In the Module Builder, drag and drop a Data Table component onto your canvas.
In the Property ID and Canvas Label Text fields, enter dtUserSubmission Data.
To the left of the component's configuration window, click Data.
In the data table, enter the following:
A
B
1
name
status
2
Robert
Denied
3
Ebony
Approved
4
Kaylin
Denied
5
Rachelle
Approved
6
Trevor
Pending
7
Kenya
Approved
8
Madison
Denied
9
Keshawn
Pending
10
Emie
Approved
Click Save & Close.
Configure the Hidden Component
This Hidden component stores the number of submissions. Your KPI component references this data to display to the end-user.
Drag and drop a Hidden component onto the canvas, placing it below your dtUserSubmissionData Data Table component.
In the Property ID and Canvas Label Text fields, enter kpiData.
Click Save & Close.
Configure the Data Workflow Component
Use a Data Workflow component to output the number of submissions from the Data Table component. Once your Data Workflow factors the number of submissions, it stores it in your Hidden component.
Drag and drop a Data Workflow component onto the canvas, placing it between the dtUserSubmissionData Data Table and kpiData Hidden components.
In the Canvas Label Text and Property Name fields, enter
dwfKpi.From the Trigger Type drop-down, select Watch.
Configure the Input Operator
Drag and drop an Input operator onto your Data Workflow canvas.
Configure the operator's Info window as follows:
Setting
Value
Category
Input
Component
dtUserSubmissionData
Required
Yes
Source
Default
Configure the Size Operator
Drag and drop a Size operator onto your Data Workflow canvas.
Configure the operator's Info window as follows:
Setting
Value
Category
Size
Label
Submission Size
Connect the output port (right) of the dtUserSubmissionData Input operator to the input port (left) of the Submission Size Size operator.
Configure the Output Operator
Drag and drop an Output operator onto the Data Workflow canvas.
Configure the operator's Info window as follows:
Setting
Value
Category
Output
Component
kpiData
Action
value
Connect the output port (right) of the Submission Size Size operator to the input port (left) of the kpiData Output operator.
Click Save.
Here's how the completed Data Workflow canvas looks:
Configure the KPI Component
Lastly, use a KPI component to display the total number of submissions.
Drag and drop a KPI component onto the canvas, placing it below the kpiData Hidden component.
In the Property ID and Label Text fields, enter
kpiSubmissions.In the KPI Title field, enter
Total Submissions.To the left of the component's configuration window, click the Data tab.
From the Inputs drop-down, select or enter kpiData.
To the left of the component's configuration window, click the
.png) Advanced tab.
Advanced tab.In the KPI Box Height field, enter
200.Click Save & Close.
Save your module.
Preview your module in Express View to view the total number of submissions. The value is nine because you added nine rows of values to the dtUserSubmissionData .png) Data Table component.
Data Table component.
Structure of a KPI Component's Data
The KPI data uses an input Property ID to display a value of a single key/value pair.
.jpg)
.jpg)
.jpg)
.jpg)