Common Troubleshooting Strategies
Overview
Unqork has common strategies when troubleshooting. This article reviews the most applicable strategies for your various applications. Some strategies are industry standards, and others are specific to Unqork. With practice, you can easily pinpoint what strategy to use for the issue. Also, you'll gravitate toward your preferred troubleshooting approaches.
For especially complex issues, contact support.unqork.com.
Google Chrome is Unqork’s recommended browser. Some of the following processes are specific to Chrome. We reference DevTools (Inspect) The DevTools Console helps you securely store, build, test, and deploy your software., which is native to Chrome.
Checking the API Network Log Using DevTools (Inspect)
Using this strategy, you’re determine the API APIs (application programming interfaces) are a set of protocols and definitions developers use to build and integrate application software. APIs act as the connective tissue between products and services. call status code in the Network tab of the DevTools Console The DevTools Console helps you securely store, build, test, and deploy your software.. From there, you’ll research the code to get details on any unexpected behavior.
One aspect that might need troubleshooting is when configuring integrations. Integrations come in the form of API calls. At Unqork, we use a Plug-In component to make API APIs (application programming interfaces) are a set of protocols and definitions developers use to build and integrate application software. APIs act as the connective tissue between products and services. calls to various endpoints. An endpoint could be external or it could be an Unqork internal API. When you save a submission, the save occurs using API calls.
Accessing the DevTools Network Tab
To open the DevTools Network tab:
| 1. | Preview your module in Express View. |
| 2. | Right-click anywhere on your Express View page. |
| 3. | Click Inspect. The DevTools open as a panel to the right of your page. |
To open the Console in Google Chrome, you can use the Ctrl + Shift + J (Windows/Linux) or Option + Command + J (Mac OS) shortcut.
| 4. | Click the Network tab located at the top of DevTools panel. |
As you submit data in the module, the Network Log rows populate with information. Each row represents a resource and are listed chronologically based on your navigation. API calls are the resources that you’ll investigate most when troubleshooting.
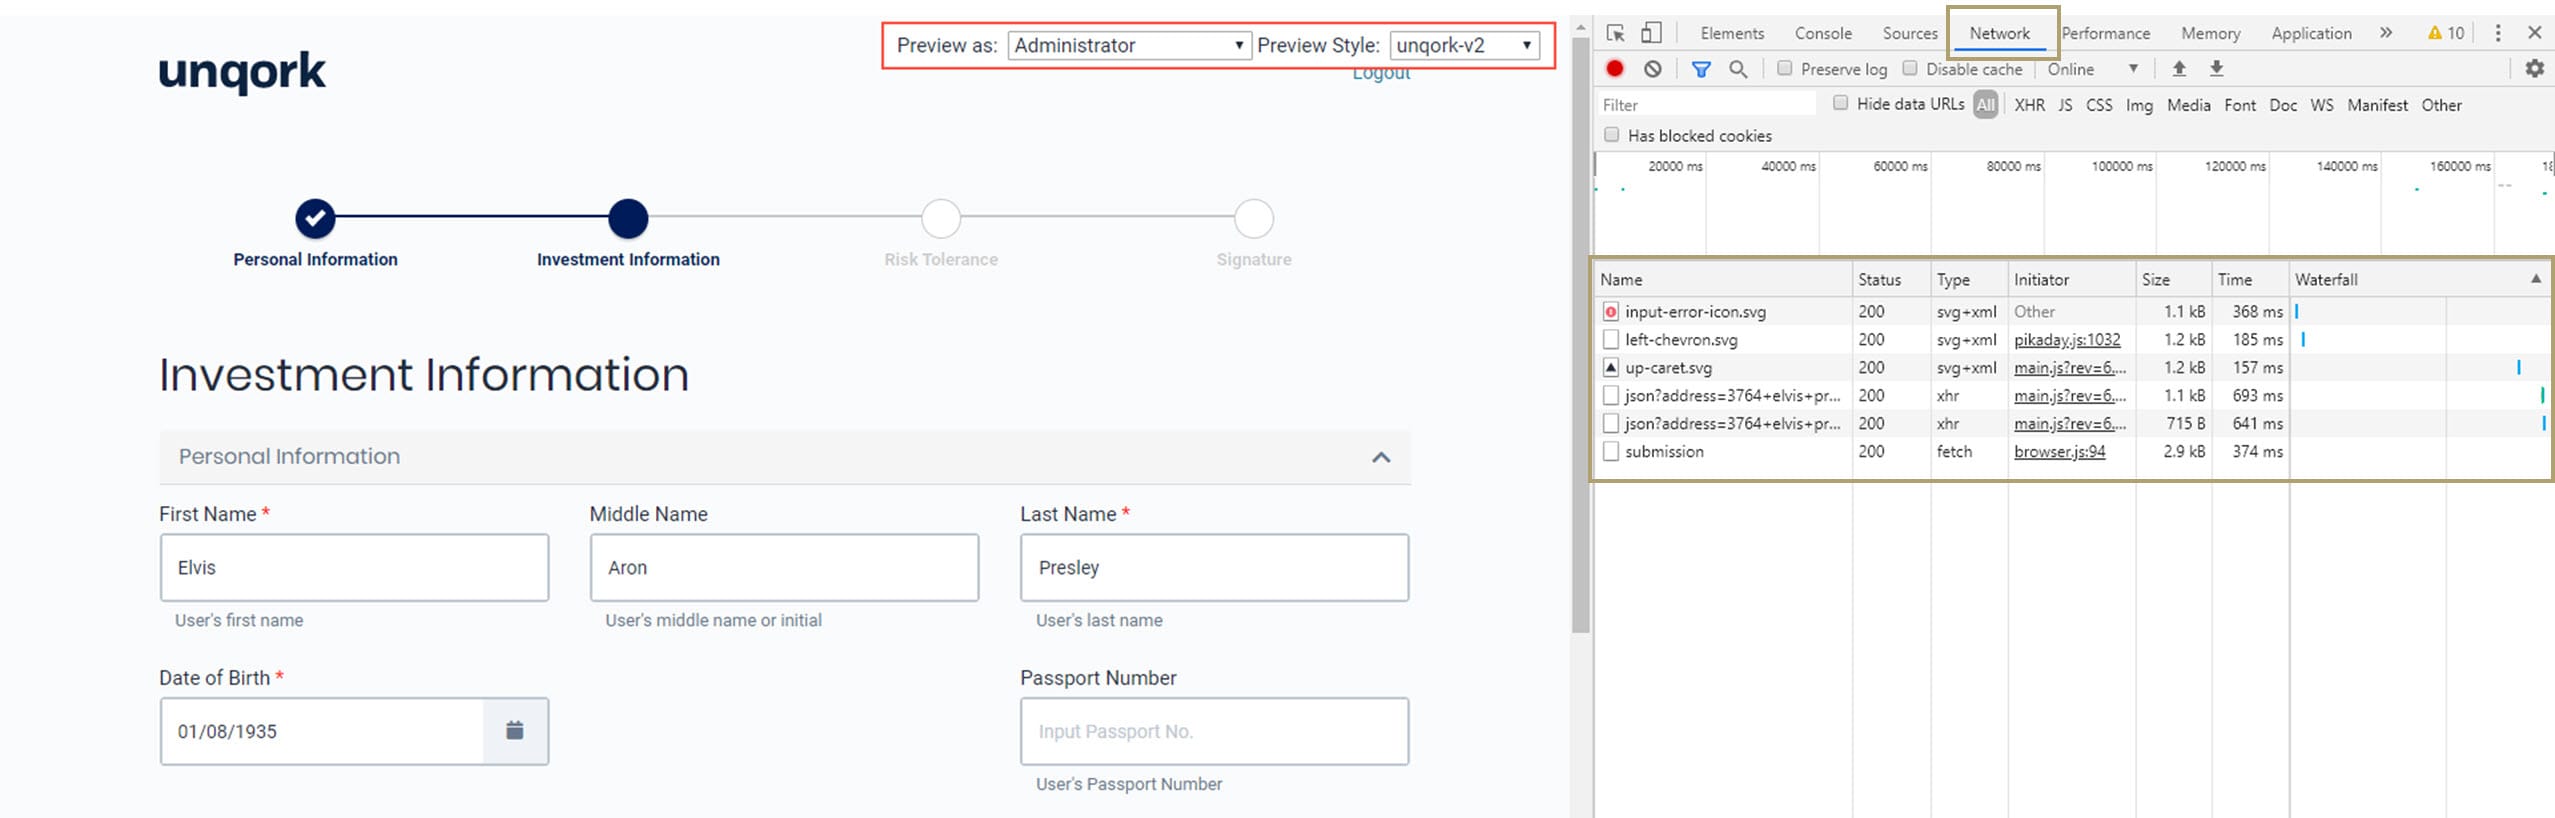
A common strategy is to watch those API APIs (application programming interfaces) are a set of protocols and definitions developers use to build and integrate application software. APIs act as the connective tissue between products and services. calls as they happen and while you’re navigating through the application. Ask yourself the following questions:
-
Was the call successful?
-
What response is the endpoint returning?
-
Is there an error message? If yes, what does it say?
Investigating an Unsuccessful API Call
Red text in the Network panel represents an unsuccessful call.
To investigate an unsuccessful API call:
| 1. | View your API calls in the Network tab of the DevTools The DevTools Console helps you securely store, build, test, and deploy your software.. |
| 2. | Select the unsuccessful call. The panel populates with a second menu and details of the call. |
| 3. | Click the Headers tab of the second menu. |
| 4. | Locate and take note of the status code. |
| 5. | Click the Response tab to get more information on the status code. |
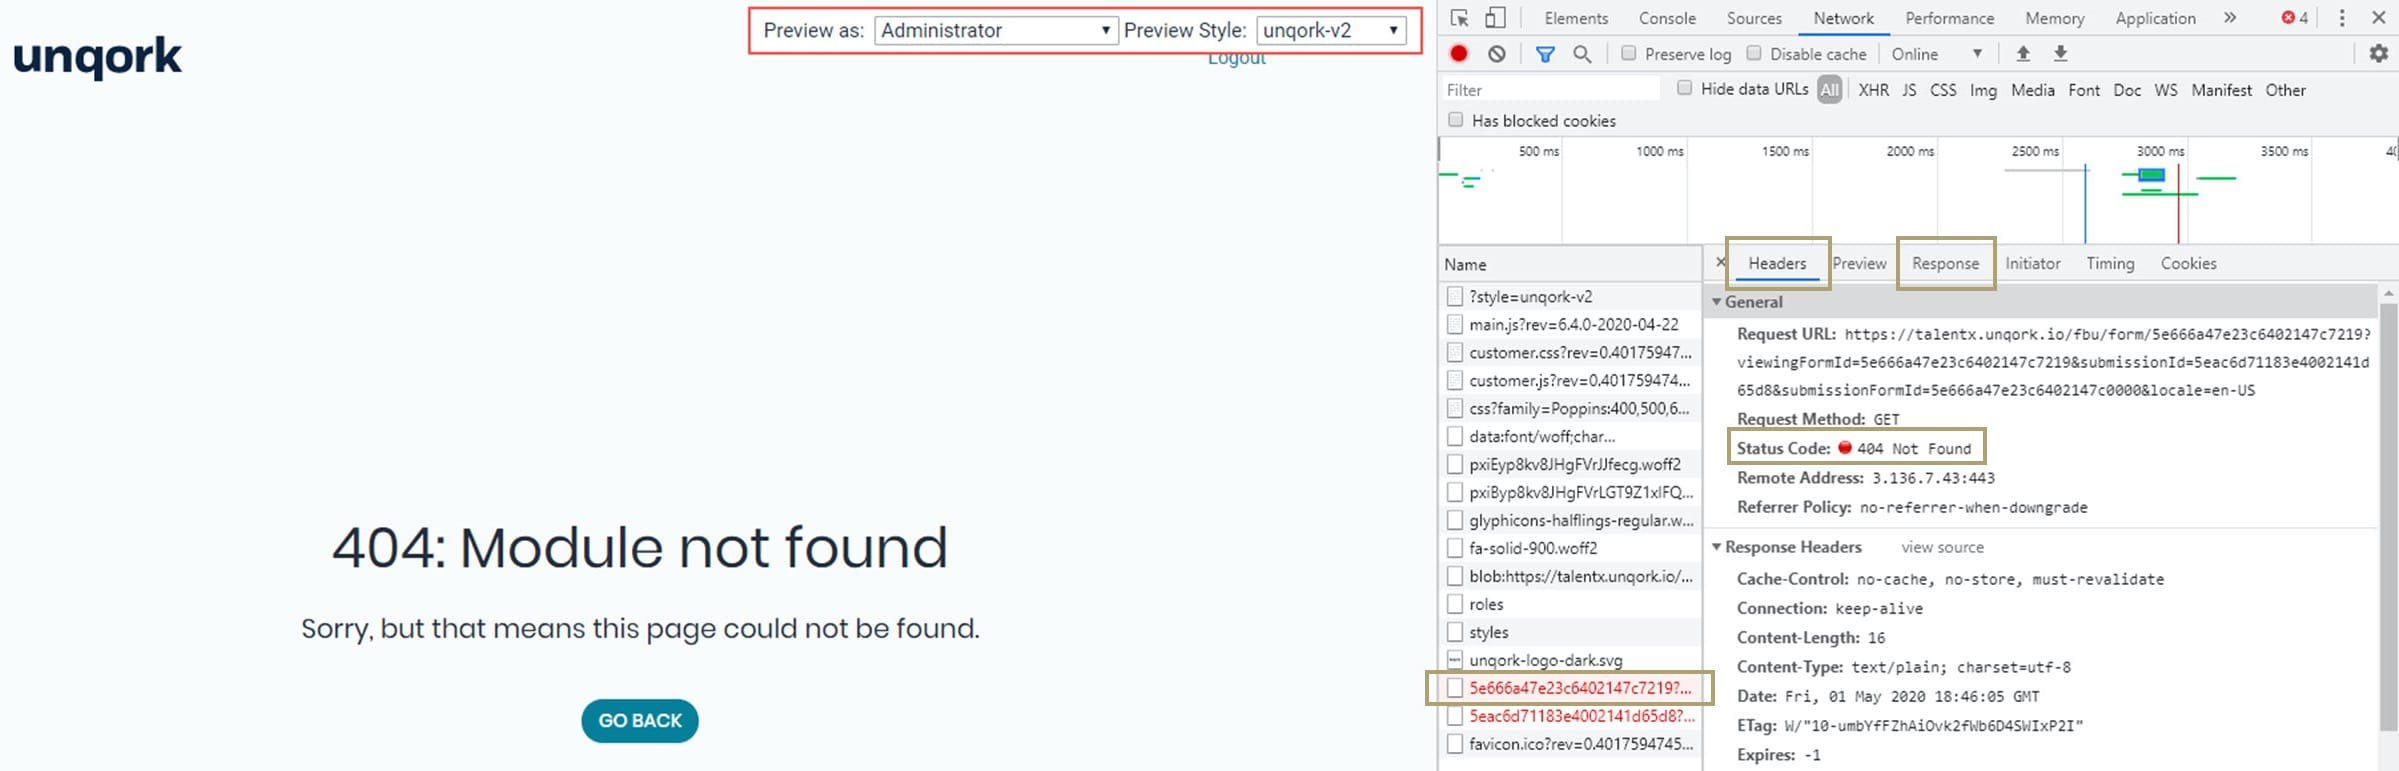
When end-users End-users, also known as Express Users, are the individuals accessing an application through Express View. In most cases, end-users are the customers using the product. see an error message, many times they will close and ignore it. However, it's important for you to understand the status code and the issue that occurred. Many times, error messages are descriptive and useful when exploring the issue.
The quickest way to determine what error the status code represents is to explore it using a browser search engine. For example, searching “What does [xyz] response code mean?” Let’s say you’re attempting to execute a module on the server-side. But it returns a 412 response code. A 412 code suggests that the execution on the server-side module failed.
Review the full range of status codes in our HTTP Status Codes article.
Interpreting the Console Output
This strategy lets you determine the timing and order of how your components fire. The Console output displays a live feed showing the process during a submission. You'll compare against the configuration to determine if the order and process is correct. The Console output shows you when a rule begins firing, and when it ends. So, if a beginning rule does not have a followup end rule, you know an issue occurred in the rule logic.
To open the DevTools Console The DevTools Console helps you securely store, build, test, and deploy your software. tab:
| 2. | Right-click anywhere on your Express View page. |
| 3. | Click Inspect. By default, the DevTools panel opens on the right side of your page. |
To open the Console in Google Chrome, you can use the Ctrl + Shift + J (Windows/Linux) or Option + Command + J (Mac OS) shortcut.
| 4. | At the top of the DevTools panel, click the Console tab. |
The Console tab lets you view your Unqork application's submission data Also known as Record Data. Submission data consists of information saved by Unqork components. View submission data by using the angular command, or in Record Collections.. A blue arrow to the left of a blank row at the bottom of the Console's feed indicates the Console's command line. You'll use this field to enter commands to get more data details.
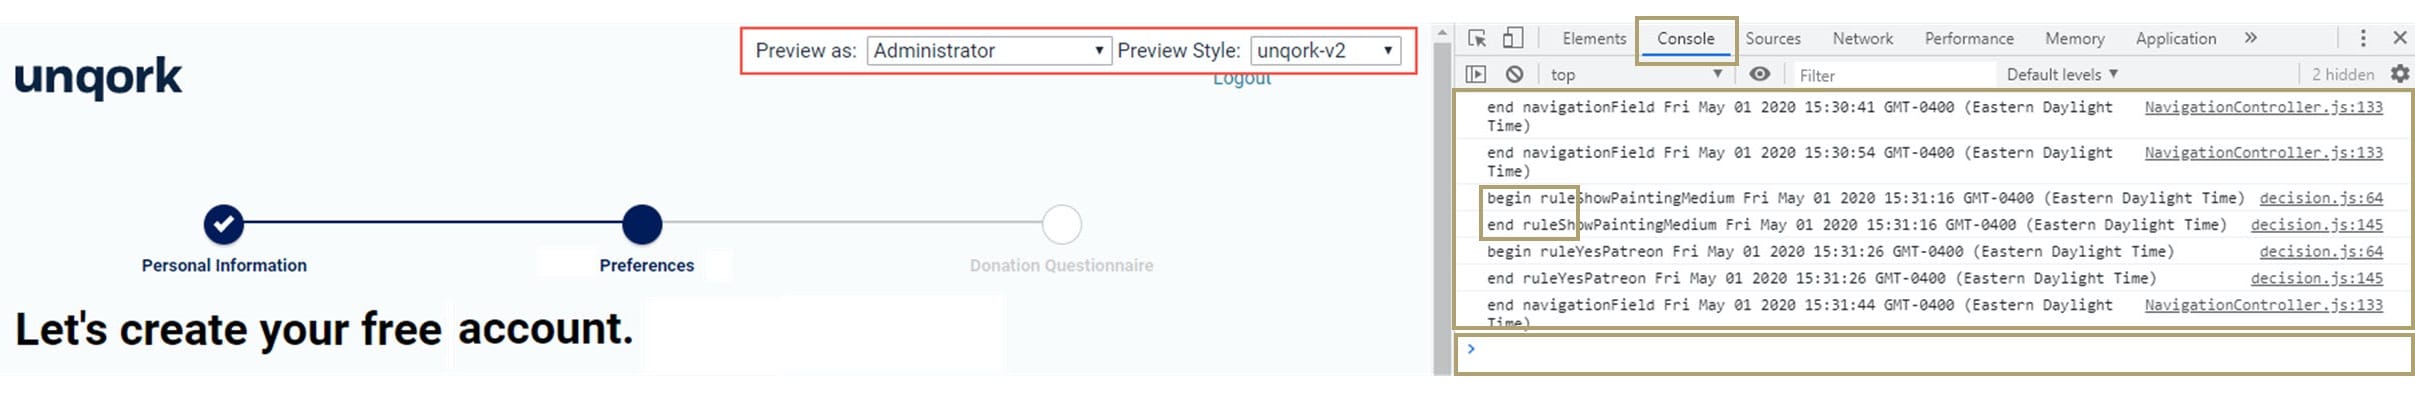
You can also add Console output for a Data Workflow. Set up Data Workflow Console operators to output a piece of information. Then, when you fire the module, the DevTools Console feed displays each step of the Data Workflow.
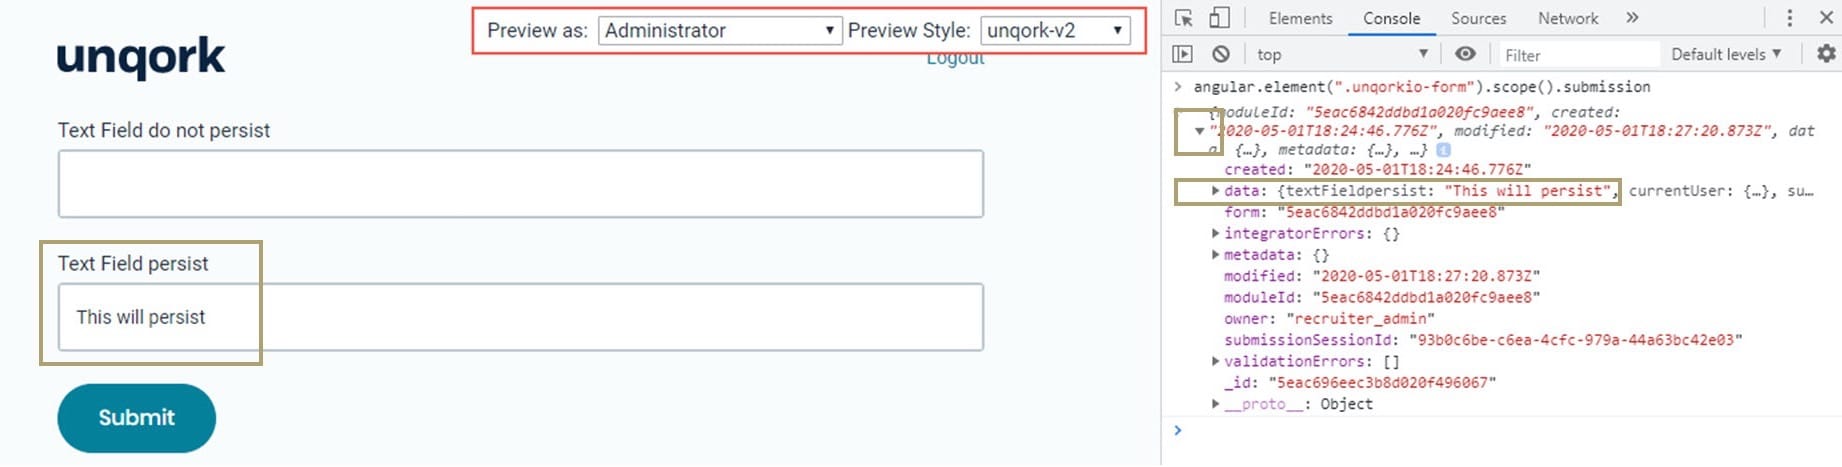
Checking Submission Data with a Data Command
This strategy helps you confirm your submission data Also known as Record Data. Submission data consists of information saved by Unqork components. View submission data by using the angular command, or in Record Collections. using the DevTools Console The DevTools Console helps you securely store, build, test, and deploy your software.. A data command (or Angular command The Angular command, or data command, is a tool that displays submission data in a browser's developer console. In Express View, enter the following command in the devtool console: angular.element('.unqorkio-form').scope().submission) shows you how the data in the browser persists (gets saved) in the database. In Express View Express View is how your end-user views your application. Express View also lets you preview your applications to test your configuration and view the styling. This is also the view your end-users will see when interacting with your application. After configuring a module, click Preview in the Module Builder to interact with the module in Express View., you can use a data command to check the submission data saved to the browser using the DevTools Console.
Let's say your client enters their Social Security Number (SSN) in a field, but their information does not display in the database. First, you'll verify that they entered the information using a data command. Once you confirm that the data is in the browser, you'll determine if the data saves on submission.
To open the DevTools Console The DevTools Console helps you securely store, build, test, and deploy your software. tab:
| 2. | Right-click anywhere on your Express View page. |
| 3. | Click Inspect. By default, the DevTools panel opens on the right side of your page. |
To open the Console in Google Chrome, you can use the Ctrl + Shift + J (Windows/Linux) or Option + Command + J (Mac OS) shortcut.
| 4. | At the top of the DevTools panel, click the Console tab. |
The Console tab lets you view your Unqork application's submission data Also known as Record Data. Submission data consists of information saved by Unqork components. View submission data by using the angular command, or in Record Collections.. A blue arrow to the left of a blank row at the bottom of the Console's feed indicates the Console's command line. You'll use this field to enter commands to get more data details.
To run the Unqork Angular command The Angular command, or data command, is a tool that displays submission data in a browser's developer console. In Express View, enter the following command in the devtool console: angular.element('.unqorkio-form').scope().submission in the DevTools Console The DevTools Console helps you securely store, build, test, and deploy your software. tab:
| 1. | At the prompt, enter the following Unqork Angular command: |
angular.element('.unqorkio-form').scope().submission| 2. | Press Enter (Return). The submission object displays in the Console. |
| 3. | Click the solid drop-down arrow to the left of the response in your Console panel. The response starts with |
| 4. | Expand the |
Next time you open the DevTools Console, you can press the up arrow key on your keyboard to repopulate the most recent command.
The Unqork Angular command only displays the submission data stored in a component through automated or end-user input before the command runs.
The Console panel populates with data for the current submission. The data shows, even if you type something without submitting the information. The Console panel's data temporarily stores in the browser.
Reading an Application's Configuration
This strategy walks you through reading the configuration of an application. The application’s configuration determines the application's behavior. Understanding module configuration is a crucial skill when troubleshooting in Unqork. The goal is to understand how the module logic works. It’s also important to know how the components interact with one another. For example, how a logic component uses other components as its input or output.
Let’s say a Calculator component is not firing. You'll confirm which component triggers the Calculator component and following the configuration to isolate the behavior.
Determining Component References
To check if another component references your component:
| 1. | Open your module in the Module Builder. |
| 2. | Navigate to the component you want to review. |
| 3. | To the right of the component, an icon displays if the component references another component in the module. |
| 4. | Hover over the icon with your mouse to determine which component references it. You can also determine whether the component is referenced as an input or output. |
Reviewing the Application Logic
To review the application logic:
| 1. | Open your module in the Module Builder. |
| 2. | Begin with the module's first component, then follow the application logic. |
When you preview the module in Express View, what happens first? Maybe an Initializer component fires or an end-user begins the process by entering information.
| 3. | Look at component inputs, outputs, triggers, and trigger types. Doing so will help you determine how the configuration works. |
| 4. | Lastly, perform a side-by-side comparison of the reported behavior. |
Reviewing the application logic is a dynamic process. Instead of a step-by-step checklist, you must navigate the unique flow of each application.
Checking a Transform Output Using an API Call
With this strategy, you'll validate a transform output using an API APIs (application programming interfaces) are a set of protocols and definitions developers use to build and integrate application software. APIs act as the connective tissue between products and services. call to determine if the logic works as expected. You can add a transform to a module to convert submission data into a different structure. A transform lets you control the format of data coming into Unqork, or data sent to a client.
Let's say a client does not receive the data they expect. As a troubleshooter, you could run the data command to determine if the data is in the submission. If so, the next step is to determine why the client did not receive the data. The next step is to run the submission data through the transform to identify what output the client sees. Then, you can make a call to this endpoint for a specific submission and module.
To confirm a transform’s output:
| 1. | Navigate to developers.unqork.io. |
| 2. | In the menu to the left, click Transforms. |
| 3. | Click Get Transforms. |
| 4. | From the panel to the right, copy the GET call. |
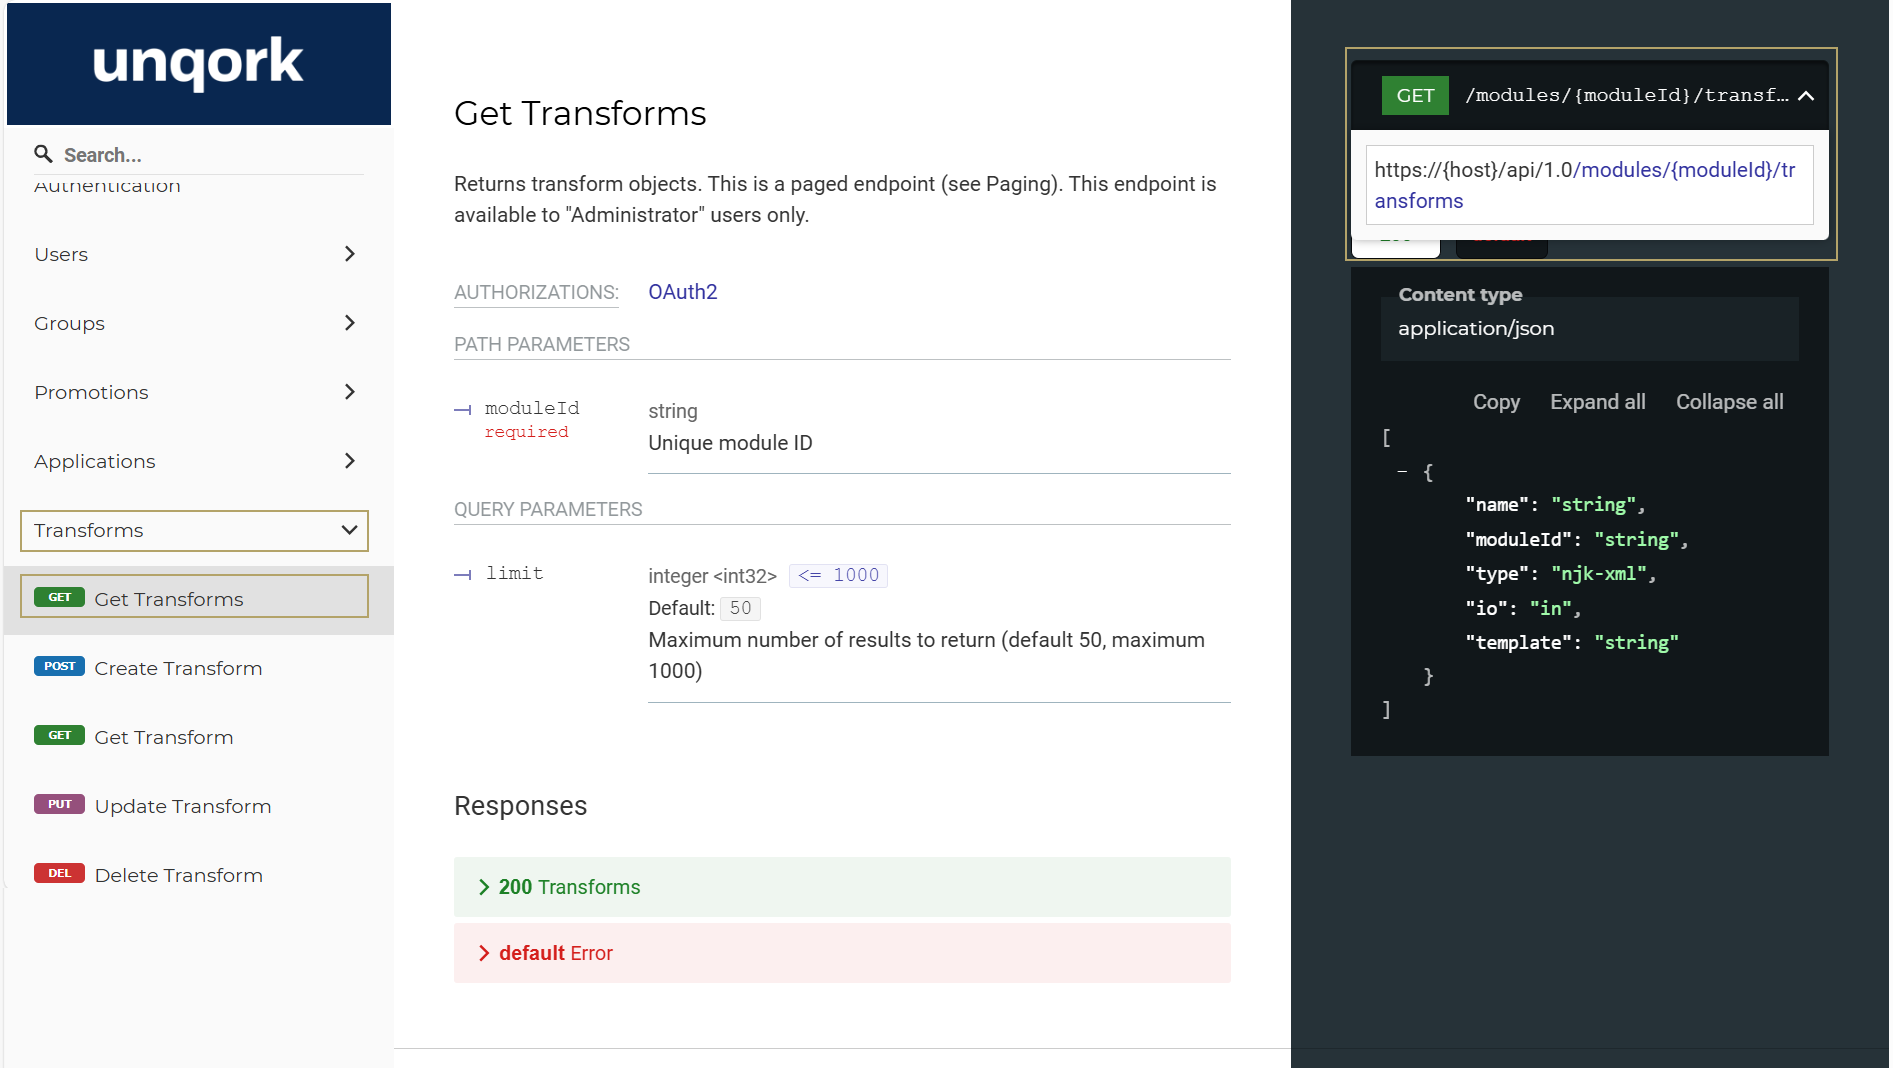
| 5. | Update the URL A URL (uniform resource locator) is a unique identifier used to locate a resource on the internet. Also known as a web address. with the correct domain and module ID. |
| 6. | Enter the call in your browser and press Enter (Return). The output returns in the browser. |
If the submission includes data, but it does not exist in the transform's output, an issue occurred with the transform logic. Review the transform's logic to determine the issue.
These steps assume that you’re authenticated as an Administrator in the environment.
Visit developers.unqork.io for other Unqork API specifications.
Setting up Service Logs for APIs and Remote Executes
This strategy involves customizing service logs for APIs APIs (application programming interfaces) are a set of protocols and definitions developers use to build and integrate application software. APIs act as the connective tissue between products and services. and remote executes. You can set up logging preferences to log request bodies and response bodies to view the details of a call. When a call fails, service logs can help you determine the issue.
For more information, visit Understanding Service Logs.
Setting up Service Logs for External APIs
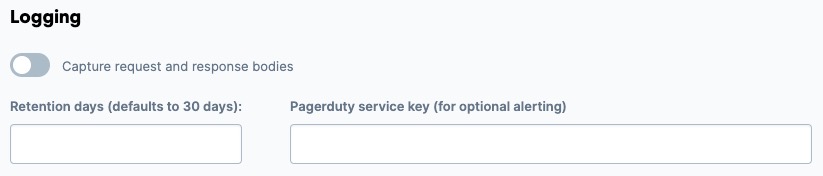
Service logs store any call made to an API set up in Unqork's Services Administration. By capturing request and response bodies, you'll have more information to review when troubleshooting a failed call.
You'll set up logging preferences under the Logging section of Services Administration. Once logging is set up for your Unqork service, service logs save to Unqork's database to be queried A query lets you retrieve, access, manipulate, and delete data in a database..
| Setting | Description |
|---|---|
|
Capture Request and Response Bodies |
Set to (checked) to enable logging for this service. |
|
Retention Days (defaults to 30 days) |
Enter a value to retain services for longer or less than 30 days. |
|
PagerDuty Service Key (for optional alerting) |
Enter a service key to integrate service logs with PagerDuty. To learn more about PagerDuty API keys and service, view the following documentation: https://support.pagerduty.com/docs/pagerduty-agent-integration-guide#send-an-event-to-pagerduty. |
Setting up Service Logs for Remote Executes
You can also set up service logs to capture the details of your remote execute calls. Remote executes occur when a module executes on Unqork's server. Capturing the request and response bodies of your calls can help with troubleshooting. You'll set up the request and response body log using Unqork's Environment Administration.
Let's look at the options from the Server Side Execution Request/Response Body Log drop-down.
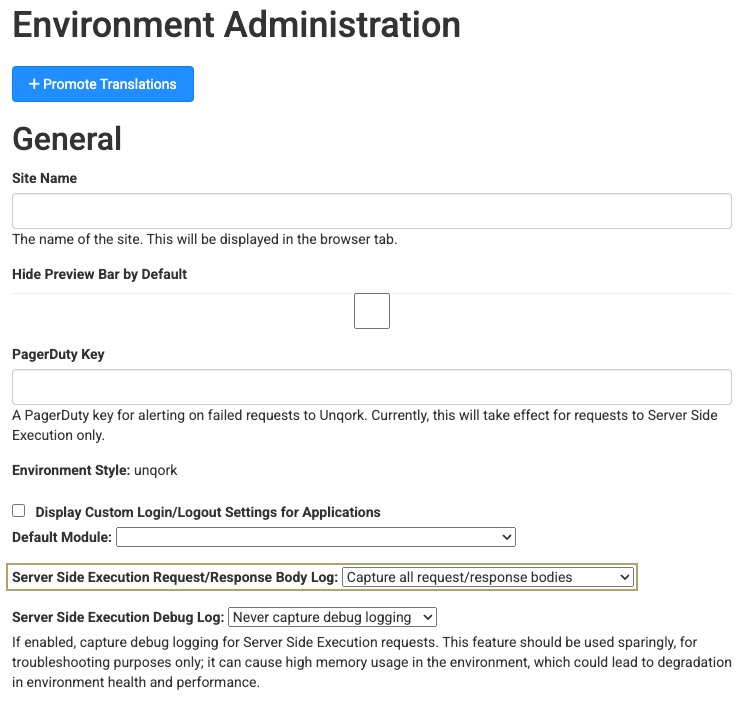
Remote execution, also called server-side execution, is a best practice for application security. Users with Designer access can see server-side execute logs at the following endpoint: https://{your-environment}.unqork.io/fbu/uapi/logs/services?type=remoteExecute.
The Server Side Execution Request/Response Body Log setting lets you choose what the log captures. You can select one of the following options:
-
Capture all request/response bodies.
-
Do not capture request/response bodies.
-
Capture request/response bodies on failure.
To adjust what request and response bodies the log captures:
| 1. | From the Server Side Execution Request/Response Body Log drop-down, select an option. |
| 2. | At the bottom of the page, click Save Changes. |
We recommend this setting even if a call is successful because the data sent and received might be incorrect. Having access to the request and response bodies for all calls gives you the information you need to troubleshoot any call.
You can also set up PagerDuty alerts using Environment Administration. When configured, PagerDuty sends alerts when there are errors in your Unqork application. To use the PagerDuty integration, you must have your own PagerDuty account.
Checking Service Logs Using an API Call
In Services Administration, you define what services integrate with your API APIs (application programming interfaces) are a set of protocols and definitions developers use to build and integrate application software. APIs act as the connective tissue between products and services.. You also define the level of logging you want for that service. All the logs save as a collection in the Unqork database. To retrieve service logs, you'll use the following endpoint in your browser: https://{your-environment}.unqork.io/fbu/uapi/logs/services.
We recommend installing a Chrome extension that formats JSON JSON (JavaScript Object Notation) is an open standard file and data interchange format. Unqork uses JSON for submission (record) data.. Without a JSON formatting extension, service logs return as long lines of text. A Chrome extension organizes the service logs in a user-friendly way.
You can also customize your query to locate calls made during a specific timeframe. Or, maybe you want to narrow your service logs to remote executes only. The query string can specify the service name, filter conditions, and sorting.
For example, to return service logs for a specific service, you'll enter the following API call into your browser: https://{your-environment}.unqork.io/fbu/uapi/logs/services?serviceName={your-serviceName}.
For more information, navigate to the following resource: https://github.com/loris/api-query-params.
Below are descriptions of each response attribute you'll see in a service log:
|
Response Attribute |
Description |
|---|---|
|
id |
A unique identifier for the service log. |
|
type |
The most common types are the following:
|
|
submissionId |
A basic identifier for each submission made in a module. |
|
moduleId |
Used in the case of a remote execute. This ID is the executed module. If you're logging a service, this ID indicates the module that made the API call. |
|
componentKey |
Displays the Property ID A Property ID is the unique field ID used by Unqork to track and link components in your module. of the component that made the external API call. With remote executes, components are not traced. |
|
requestTime |
When you made the request to the remote execute or external service. |
|
responseTime |
When the module finished executing and returned a response. Or, when the external API finished executing and returned a response. |
|
serviceName |
The name of the service added in Services Administration. |
|
userId |
The user ID of the person or integration job that submitted the request. Filtering your search by user ID can help you find out what went wrong for a specific user. |
|
url |
The URL of the request made. |
|
responseCode |
HTTP response status codes. The common codes you'll see in Unqork are the following:
For more information, visit HTTP Status Codes. |
|
responseText |
A basic description of the responseCode. An example might be Bad Request. This information is limited. |
|
requestBody |
The details of the API or remote execute request. A requestBody is only available for POST and PUT calls. |
|
responseBody |
What returned from the call. Depending on the API call, you might not see a responseBody. |
|
expireAt |
When the log expires. The default is 30 days. You can change this setting in Services Administration. |
|
created |
When Unqork created the log record. |
|
modified |
The date and time the log was modified. |
Testing API Endpoints Using Third-Party Applications
This strategy explains how to use third-party applications, like Postman and Insomnia, to test API endpoints. These tools let you make API calls outside a specific browser or configuration. These applications are useful when a failed response occurs at an endpoint. These applications help you discover if the issue is with the endpoint or the data you'er passing in. If the endpoint works when called from Postman, it's likely a configuration issue.
Visit Testing API Endpoints to use external tools to diagnose issues with API calls in Unqork.
Third-party Application Downloads
Below are links to download and access these third-party applications:
-
Download the Postman desktop application here: https://www.postman.com/.
-
Download the Insomnia desktop application here: https://insomnia.rest/.
Updating Data Using a Module
Sometimes an incorrect submission value prevents the application from proceeding. Instead of reconfiguration the application, you can update the data for that submission.
Let's say you have an insurance application with a Hidden component called applicationStatus. Your agent can only review the application if applicationStatus is set to complete. A client has an issue uploading an image of their driver’s license. Instead of uploading the image, they email it to your agent, so the application is still in progress. The unfinished application blocks your agent from reviewing and approving the application. If you can update the applicationStatus, work can continue without any further steps for the client.
| 1. | Create a new module. |
| 2. | Open a module in the Module Builder. |
Configure an Entry Component
Ensure the component you choose relates to the data type of the submission field you're updating. For example, if you want to update a field called data.name and store it as a string, use a Text Field component. For a numeric value, use a Number component.
| 1. | Drag and drop a Text Field component onto the canvas. |
| 2. | In the Property ID A Property ID is the unique field ID used by Unqork to track and link components in your module. field, enter firstName. |
| 3. | In the Label Text Label Text conveys what the input component is and what information it displays. Enter the purpose of the corresponding component or field. field, enter First Name. |
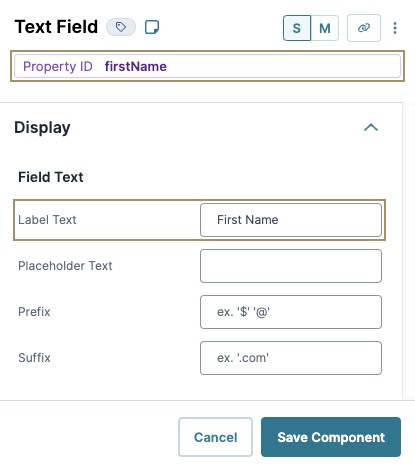
| 4. | Click Save Component. |
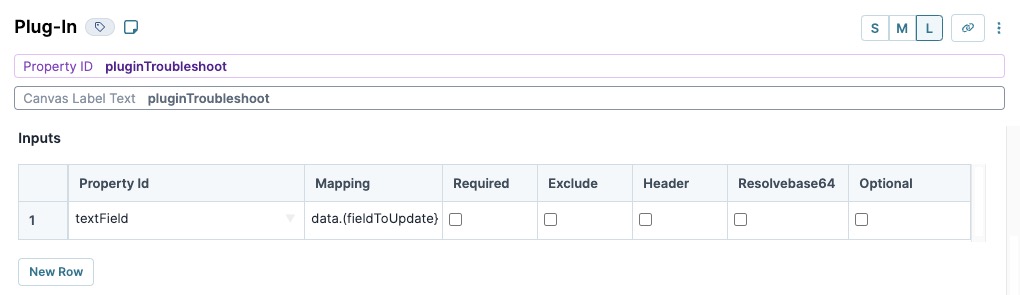
Configure a Plug-In Component
| 1. | Drag and drop a Plug-In component onto your canvas, placing it below your Text Field component. |
| 3. | Navigate to the Plug-In component's Data settings. |
| 4. | From the Internal Services drop-down, enter or select Update Module Submission. |
| 5. | Update the Data Source URL with the correct Module ID and Submission ID. |
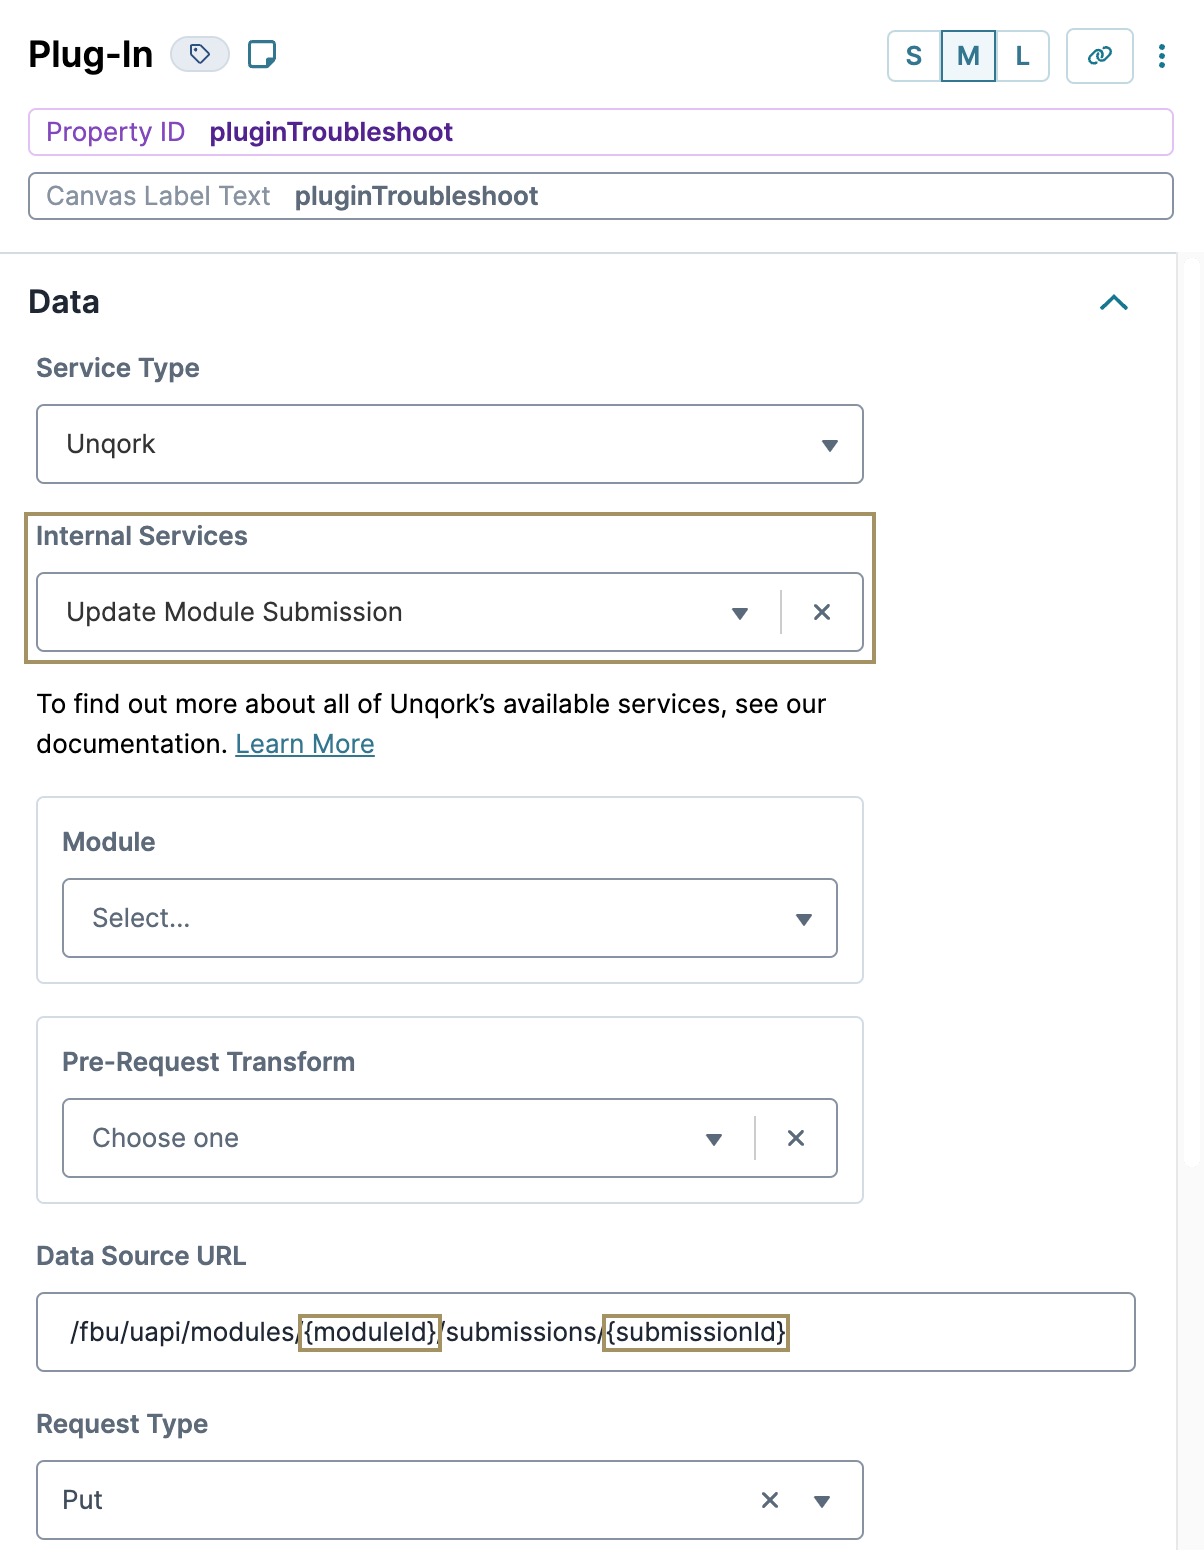
| 6. | In the Inputs table, enter the following: |
|
|
Property ID |
Mapping |
Required |
Exclude |
Header |
Resolvable |
Optional |
|---|---|---|---|---|---|---|---|
|
1 |
firstName |
data.{fieldToUpdate} |
☐ (unchecked) |
☐ (unchecked) |
☐ (unchecked) |
☐ (unchecked) |
☐ (unchecked) |
The firstName Property ID A Property ID is the unique field ID used by Unqork to track and link components in your module. refers to the component that you created earlier and {fieldToUpdate} refers to specific field that you want to update.
| 7. | Click Save Component. |
Configure a Button Component
| 1. | Drag and drop a |
| 2. | In the Property ID A Property ID is the unique field ID used by Unqork to track and link components in your module. field, enter btnSubmit. |
| 3. | Navigate to the Actions settings. |
| 4. | From the Action Type drop-down, select Validate. |
| 5. | From the On Click drop-down, select pluginTroubleshoot. This is the Property ID of the Plug-In component that you configured earlier. |
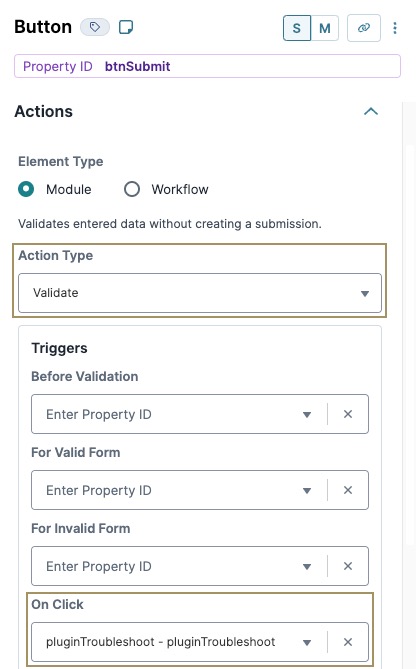
| 6. | Click Save Component. |
| 7. | Save your module. |
Updating the Data for the Submission
To complete the update, you'll:
| 2. | Populate your Text Field component with the value you want to update. |
This updates the field that you entered in the Mapping section of your Plug-In component.
| 3. | Click Submit. |
If you configured the module correctly, the button triggers the Plug-In component and updates the submission data.
When you update an array or object’s data, the new data overwrites the entire array or object. Please reach out to your Unqork representative with any questions about this functionality.
Using the Server-Side Execution
Server-side execution occurs when a FE module executes outside of the end-user's End-users, also known as Express Users, are the individuals accessing an application through Express View. In most cases, end-users are the customers using the product. browser. Meaning, the module performs its function on the server. To configure a server-side execute, use the Execute Module API APIs (application programming interfaces) are a set of protocols and definitions developers use to build and integrate application software. APIs act as the connective tissue between products and services. call.
To learn more, visit Server Side Execution Tool.
Execute Module API Call
In the list of Unqork's API APIs (application programming interfaces) are a set of protocols and definitions developers use to build and integrate application software. APIs act as the connective tissue between products and services. documentation (developers.unqork.io), you’ll find an API call for Execute Module. Use this API to create a server-side module execution to trigger a module.
Without the Execute Module API, the call occurs in the browser. Doing so can expose your data to end-users in Express View. A remote execute occurs behind the scenes on the server, ensuring greater security.
Why Are Server-Side Executions More Secure?
If an API call runs in the browser, any end-user can open the DevTools Console The DevTools Console helps you securely store, build, test, and deploy your software. and inject malware Malware is software designed to disrupt, damage, or gain access to a computer system. or access private information. Creating remote execute modules prevents malicious actors A bad actor is a cybercriminal or organization that might attempt to exploit vulnerabilites in your environment or application. Common exploits used by bad actors include XSS (cross-site scripting) attacks, malware, randsomware, and more. from accessing sensitive data.
Executing internal API calls, like Get Submissions, Create Submission, or Update Submission, in server-side modules is beneficial in the following ways:
-
Speed: API calls occur using a remote server, unburdening the browser.
-
Security: Bad actors cannot access Personally Identifiable Information Personal Identifiable Information (PII) is any representation of information that permits the identity of an individual to whom the information applies to be reasonably inferred by either direct or indirect means. using the DevTools Console.
-
Easier Debugging: Creating modular API modules provides a smaller codebase when troubleshooting.
Server-side execution enables HTTP status code outputs in API modules. To learn more about HTTP Output, visit our HTTP Status Codes article.
Creating APIs From Modules
You might have a API API module that sends email reminders. This module includes a Plug-In component that uses the SendGrid API. When triggered, the Plug-In component sends an email.
In a separate FE Front-End module, a Plug-In component makes a remote execute call to the SendGrid module. When that occurs , the SendGrid API API module executes. Then, the SendGrid Plug-In component triggers and the email sends.
It’s best practice to modularize your application so that each API is represented by an API API module. For example, an application might have a Create Submissions Module, an Update Submissions Module, a Get Submissions Module, and so on. When you remote execute these API API modules, you’re treating them like you would an API.
Need to troubleshoot your API API module? View our Server Side Execution Tool article.
