Unqork Service Logs let Creators and Administrators review API service call information. In this article, you'll learn how to read Unqork Service Logs and how to use the service logs API (application programming interface) call. The service logs collect all the API calls made at Unqork. Here, you'll find the information on API calls made to internal and external services.
In Services Administration, you'll define which services integrate with your application. You can also choose to log your API's request and response bodies. This information is beneficial when you're troubleshooting failed calls. When a call fails, service logs can show you exactly why a call fails.
Setting up Service Logs for External APIs
You'll use Services Administration to set up APIs you want to log in Unqork's service logs. By capturing request and response bodies, you'll have the right information to troubleshoot any failed call.
You'll set up logging preferences under the Logging section of Services Administration. Below, you'll see what these settings mean and how to use them.
.jpg)
Setting | Description |
|---|---|
Capture Request and Response Bodies | Set to |
Retention Days (defaults to 30 days) | Enter the number of days to retain services.
|
PagerDuty Service Key (for optional alerting) | Enter a service key to integrate service logs with PagerDuty.
|
Once you set your logging settings, you're good to go. The service logs automatically save to Unqork's database so you can query the logs at any time. We'll show you how to access these longs in a bit. First, let's set up service logs for remote execute calls.
Setting up Service Logs for Remote Executes
You can also set up service logs to capture the details of your remote execute calls. Remote executes are when a module executes on Unqork's server. You have some flexibility with what you capture in these logs. Capturing the request and response bodies of your calls makes future troubleshooting easier. You'll set up the request and response body log through Environment Administration.
Let's look at the options for the Server Side Execution Request/Response Body Log drop-down in Environment Administration.
.jpg)
Server Side Execution Request/Response Body Log Settings
Setting | Description |
|---|---|
Do Not Capture Request/Response Bodies | Logs won't show the details (request and response body) of remote execute calls. |
Capture Request/Response Bodies on Failure | Unqork only logs request and response bodies if a remote execute fails. |
Capture All Request/Response Bodies | Unqork logs request and response bodies for all remote executes. |
We recommend choosing Capture all request/response bodies. Even if a call is successful, the data to and from may be incorrect. Having access to the request and response bodies for all calls gives you the information you need to troubleshoot any call.
You can also set up PagerDuty alerts from Environment Administration. When configured, PagerDuty sends alerts when there are errors in your Unqork application. To use the PagerDuty integration, you must have your own PagerDuty account. Again, you can visit this link to set up an account: https://www.pagerduty.com.
Now that you have service logs saving to the database for your remote executes, let's go over how to find the service logs.
Checking Service Logs Using an API Call
Now, let's check the service logs to see the status of external API calls and remote execute calls.
We recommend installing a Chrome extension that formats JSON. Without a JSON formatting extension, service logs return as long lines of text. Using a Chrome extension organizes the service logs in a user-friendly way.
The service logs look something like this:
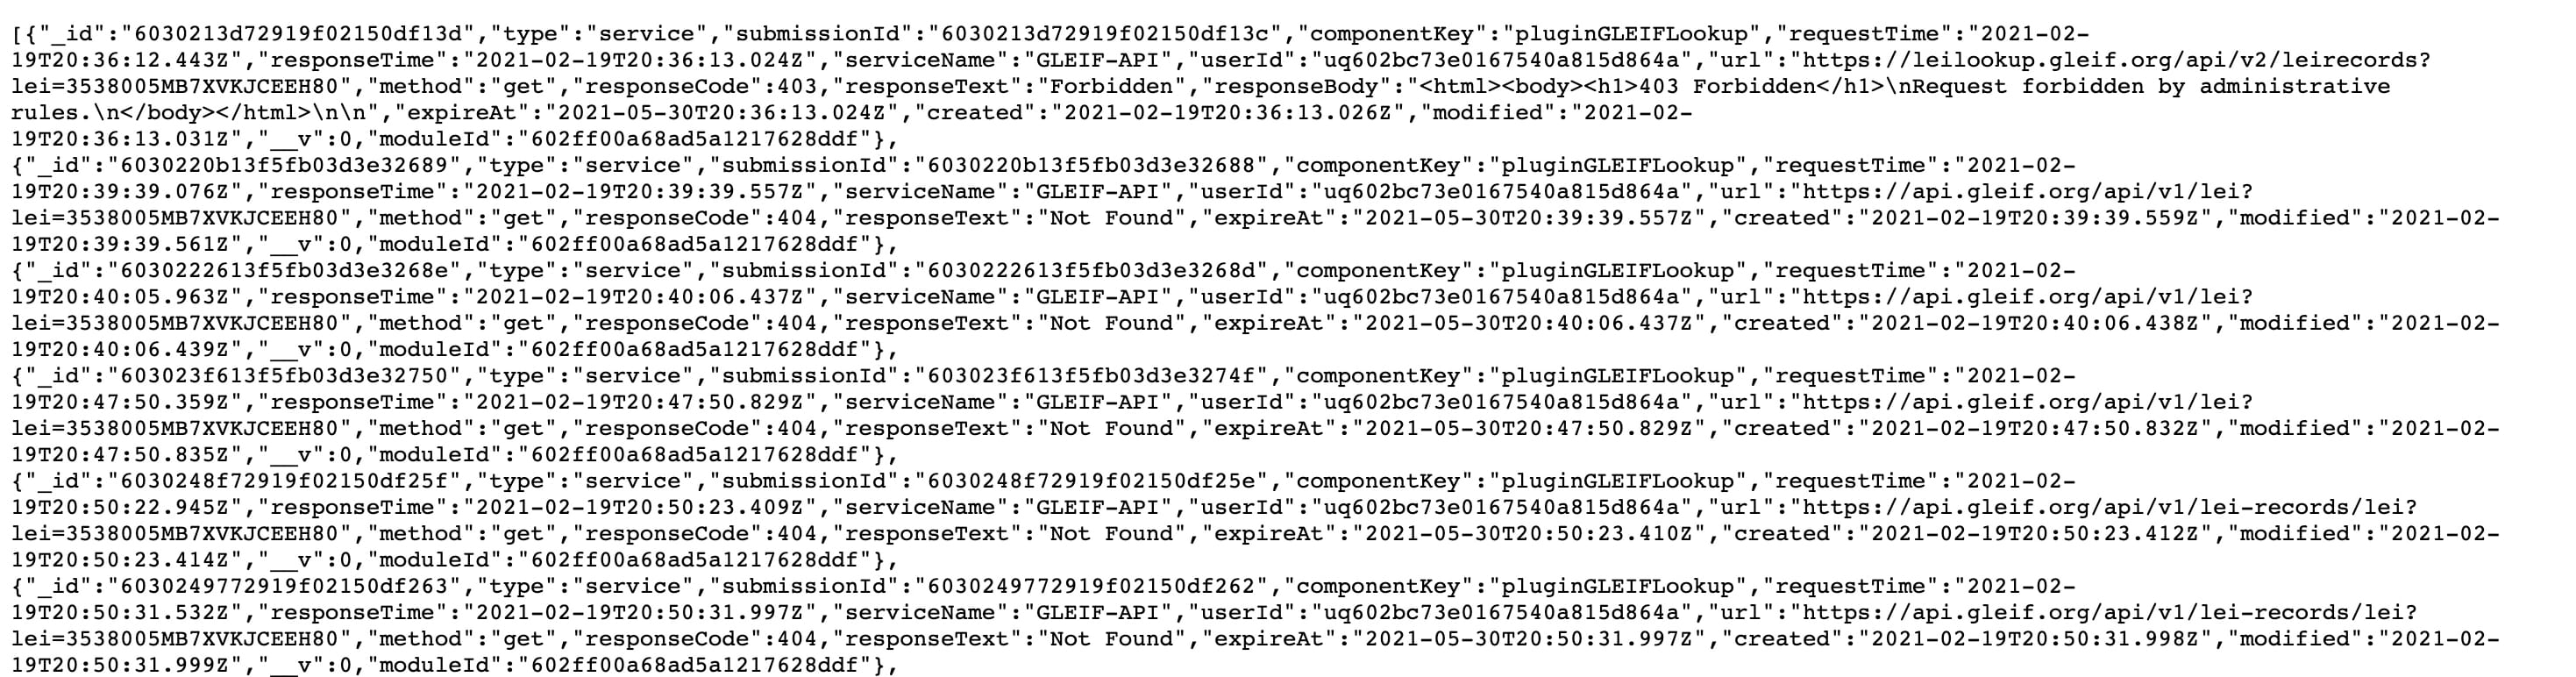
The table below gives a description of each response item you'll see in the service logs.
Response Item | Description |
|---|---|
| A unique identifier the Service Log returns. |
| Could be
|
| A basic identifier for each submission made. Your end-user creates a new submission any time they save or submit their module. |
| Shows the date and time when you made the request to the remote execute or external service. |
| Shows the date and time when the module finishes executing and sends a response, or when the external API finishes executing and sends a response. |
| The total time the service execution took, measure from start to completion. |
| Shows the Property Name of the component that made the external API call. With remote executes, components aren't traced. |
| The name of the service you added in Services Administration. |
| The user ID of the person or integration job that submitted the request. Filtering your search by user ID can help you find out what went wrong for a specific user. |
| The URL of the request made. |
| The type of operation or request performed (e.g., GET, POST, PUT), indicating how the service was invoked. |
| Text with a basic description of the |
| HTTP response status codes. The codes you'll see in Unqork are:
For example, you can query by |
| The details of the API call or the remote execute request. There will only be a |
| The call details returned. Depending on the API call, you may or may not see a |
| A Boolean value ( |
| The identifier of the very first (root) service log in a chain of related service calls, used to trace back to the origin. |
| The identifier of the immediate parent service log, linking the current log to the service call that triggered it. |
| Shows the date and time when the record will drop off the log. The default is 30 days. You can change this setting by going to Services Administration and updating the Retention Days setting. |
| Shows the date and time when Unqork created the log record. |
| Shows the date and time of a log's modification. |
| This ID refers to the executed module. In the case of a remote execute, the ID refers to the executed module. If you're logging a service, this ID indicates the module that made the API call. |
Viewing Service Logs Through Chrome
To get back service logs, you'll use the following endpoint:
Enter
https://{your-environment}.unqork.io/fbu/uapi/logs/servicesin your Chrome address bar. Replace{your-environment}with the name of your Unqork environment.Press Enter or Return.
Bringing Service Logs Directly into a Module
You can also bring service logs into a module using a Plug-In component:
Select Get Service Logs from the Internal Services drop-down.
The Data Source URL automatically populates with /fbu/uapi/logs/services. You can see this highlighted in the image below.
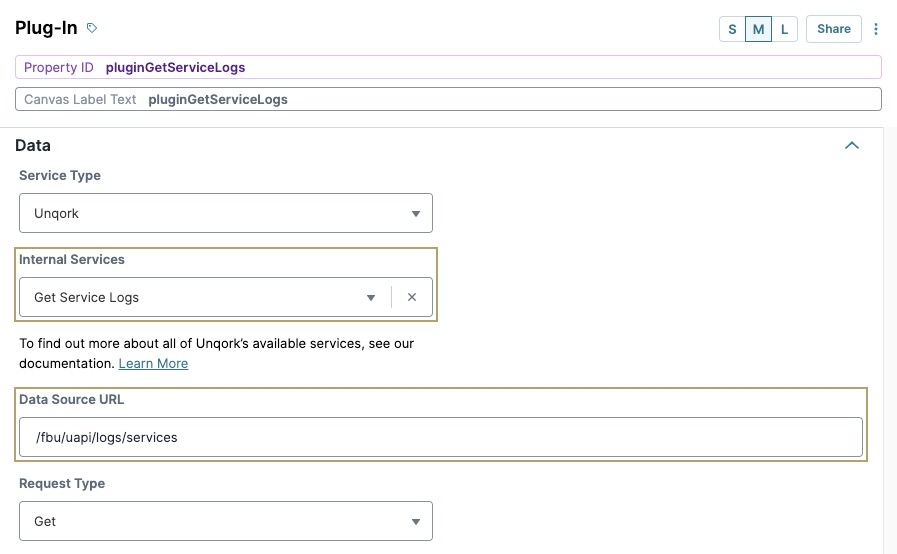
Click Save Component.
Searching and Filtering Service Logs
Because service logs store all API calls made at Unqork, finding yours can be difficult. Thankfully, built-in filtering operators let you customize your search. Maybe you only want to query failed calls or find calls made during a certain timeframe. Or, maybe you want to narrow your service logs down to remote executes only. The query string can specify the service name, filter conditions, and sorting.
For example, to return service logs for a certain service, you'll enter the following API call into your browser: https://{your-environment}.unqork.io/fbu/uapi/logs/services?serviceName={serviceName}. Replace {your-environment} with the name of your Unqork environment. Then, you’ll see the response for the service you queried.
To view your filtering options, go to the following link and scroll to the Filtering operator's table: https://github.com/loris/api-query-params.