Sometimes, your end-user might have to save multiple submissions on your form simultaneously. For usability, you do not want them to have to log in and out of the application over and over, creating submissions individually. Instead, it’s easier to collect large amounts of data in an Excel sheet. Then upload that sheet, populating your application automatically. The Excel Upload feature makes that possible.
There is a known issue with Chrome and Chromium-based browsers where uploading XLSX and XLS files from non-US locales might incorrectly parse the timestamp value. For example, the timestamp might be off by one-tenth. To avoid this issue, use a different browser (like Firefox or Safari), change your browser's locale, or manually adjust incoming date values to
YYYY-MM-DD-T12:mm:ss.sssZas a workaround.
What Is an Excel Upload?
An Excel upload feature lets your end-user upload an Excel sheet to your application. Your application stores the Excel sheet, where you can parse the data into your application's fields.
Let’s say a broker has a client applying for insurance on multiple golf courses. There are several questions the client must answer about each golf course. It would be time-consuming for the client to answer the same questions for each golf course. Instead, you provide them with an Excel template. The client can complete the template and upload it to your Unqork application. Doing so simplifies the process and saves time.
Preconfiguration
These instructions assume you have a new Front-End module open, saved, and with a title.
Configure the Advanced Datagrid Component
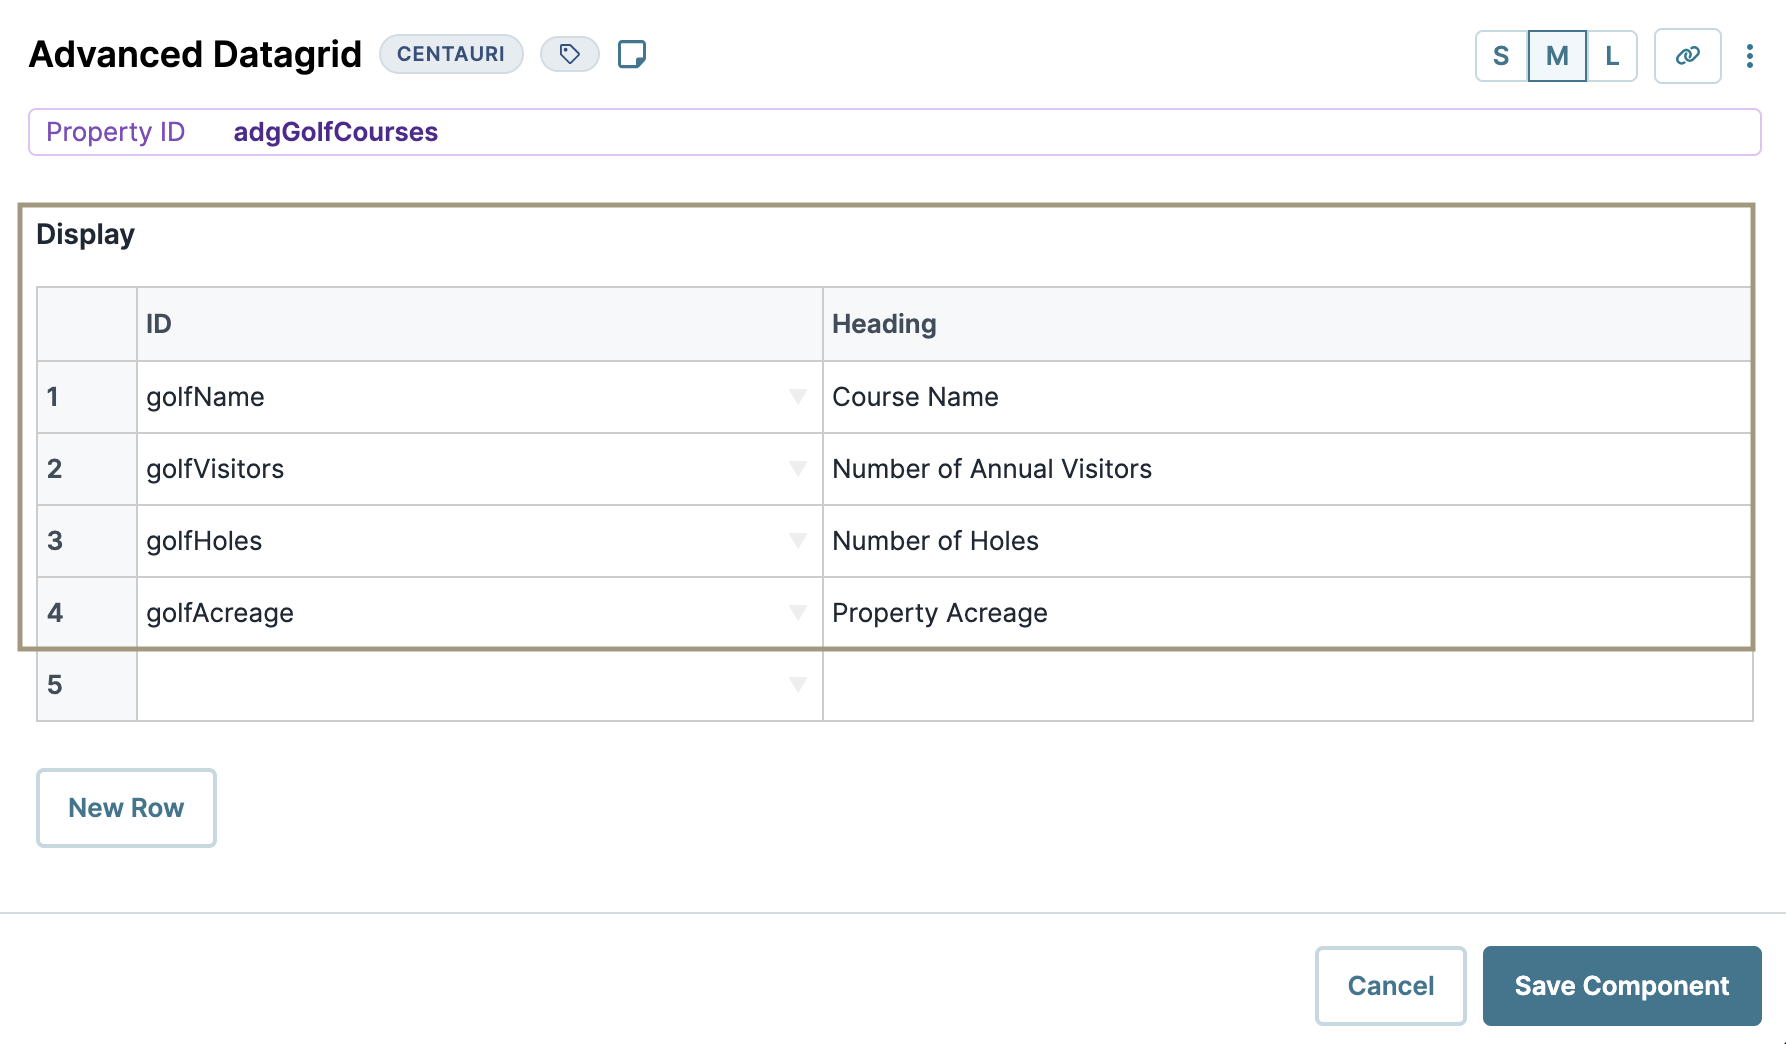
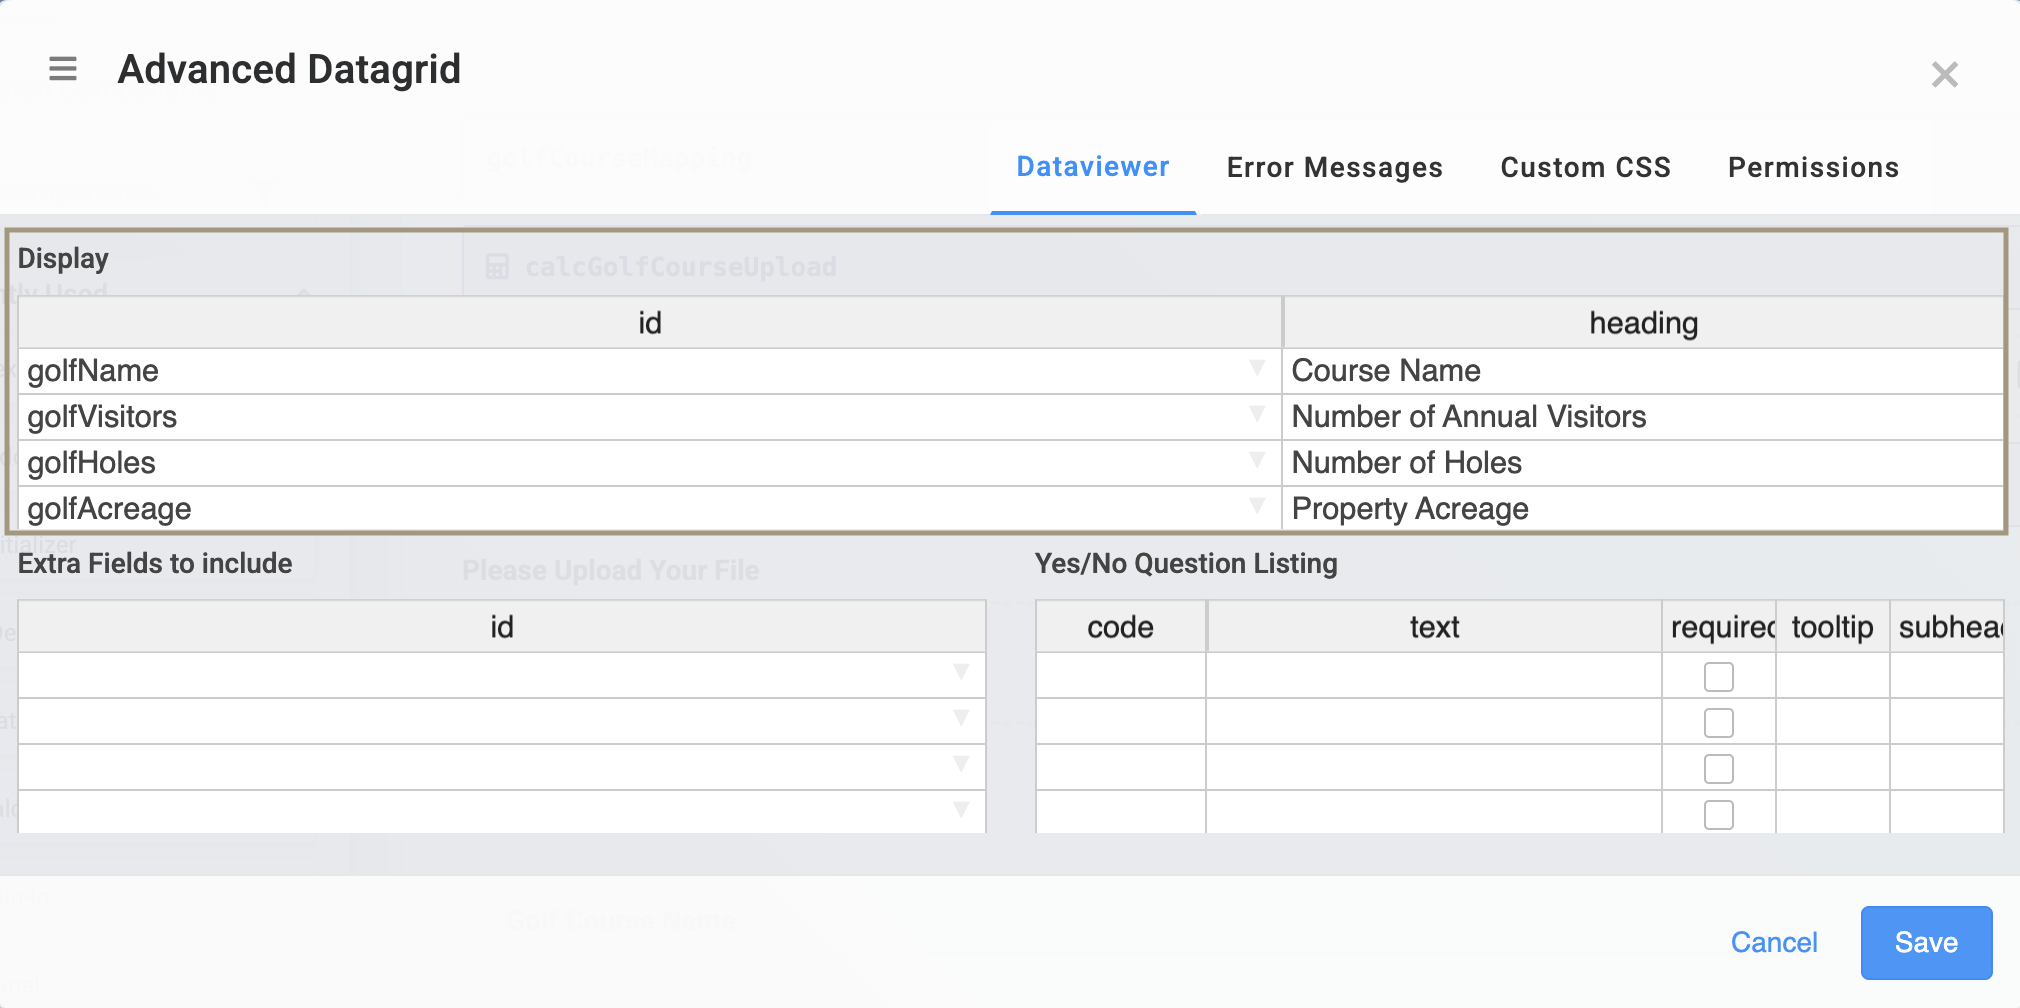
The Advanced Datagrid component will display the golf course data, including the name of the golf course, the number of annual visitors, the number of holes on the course, and the course's acreage.
In the Module Builder, drag and drop an Advanced Datagrid component onto your canvas.
In the Property ID field, enter
Golf Course Information.In the Label Text field, enter
adgGolfCourses.In the Display table, enter the following:
#
ID
Formula
Heading
1
golfName
Course Name
2
golfVisitors
Number of Annual Visitors
3
golfHoles
Number of Holes
4
golfAcreage
Property Acreage
The entries in the Display table are for the components you’ll add in the next steps.
Click Save Component.
Configure the Text Field Component
Next, you’ll use a Text Field component to store the name of the golf course. You’ll place this component inside your Advanced Datagrid component.
Drag and drop a Text Field component inside your Advanced Datagrid component.
In the Property ID field, enter
golfName.In the Label Text field, enter
Golf Course Name.Click Save Component.
Configure the Number Components
Next, you’ll use three Number components to store data about the golf course, placing them inside your Advanced Datagrid component.
Drag and drop three Number components inside your Advanced Datagrid component.
In the Property ID and Label Text fields, enter the following for each component:
#
Property ID
Label Text
1
golfVisitors
Number of Annual Visitors
2
golfHoles
Number of Holes
3
golfAcreage
Property Acreage
Click Save Component for each component as you add it.
Configure the File Component
Your File component is how your end-user uploads their Excel sheet. On its own, the component doesn't interpret any data. Later, you'll add a Data Workflow to retrieve the uploaded files and interpret them.
Drag and drop a File component onto your canvas, placing it above your Advanced Datagrid component.
In the Property ID field, enter
fileGolfCourses.In the Label Text field, enter
Please Upload Your File.Click Save Component.
Configuration
Configure the Data Table Component
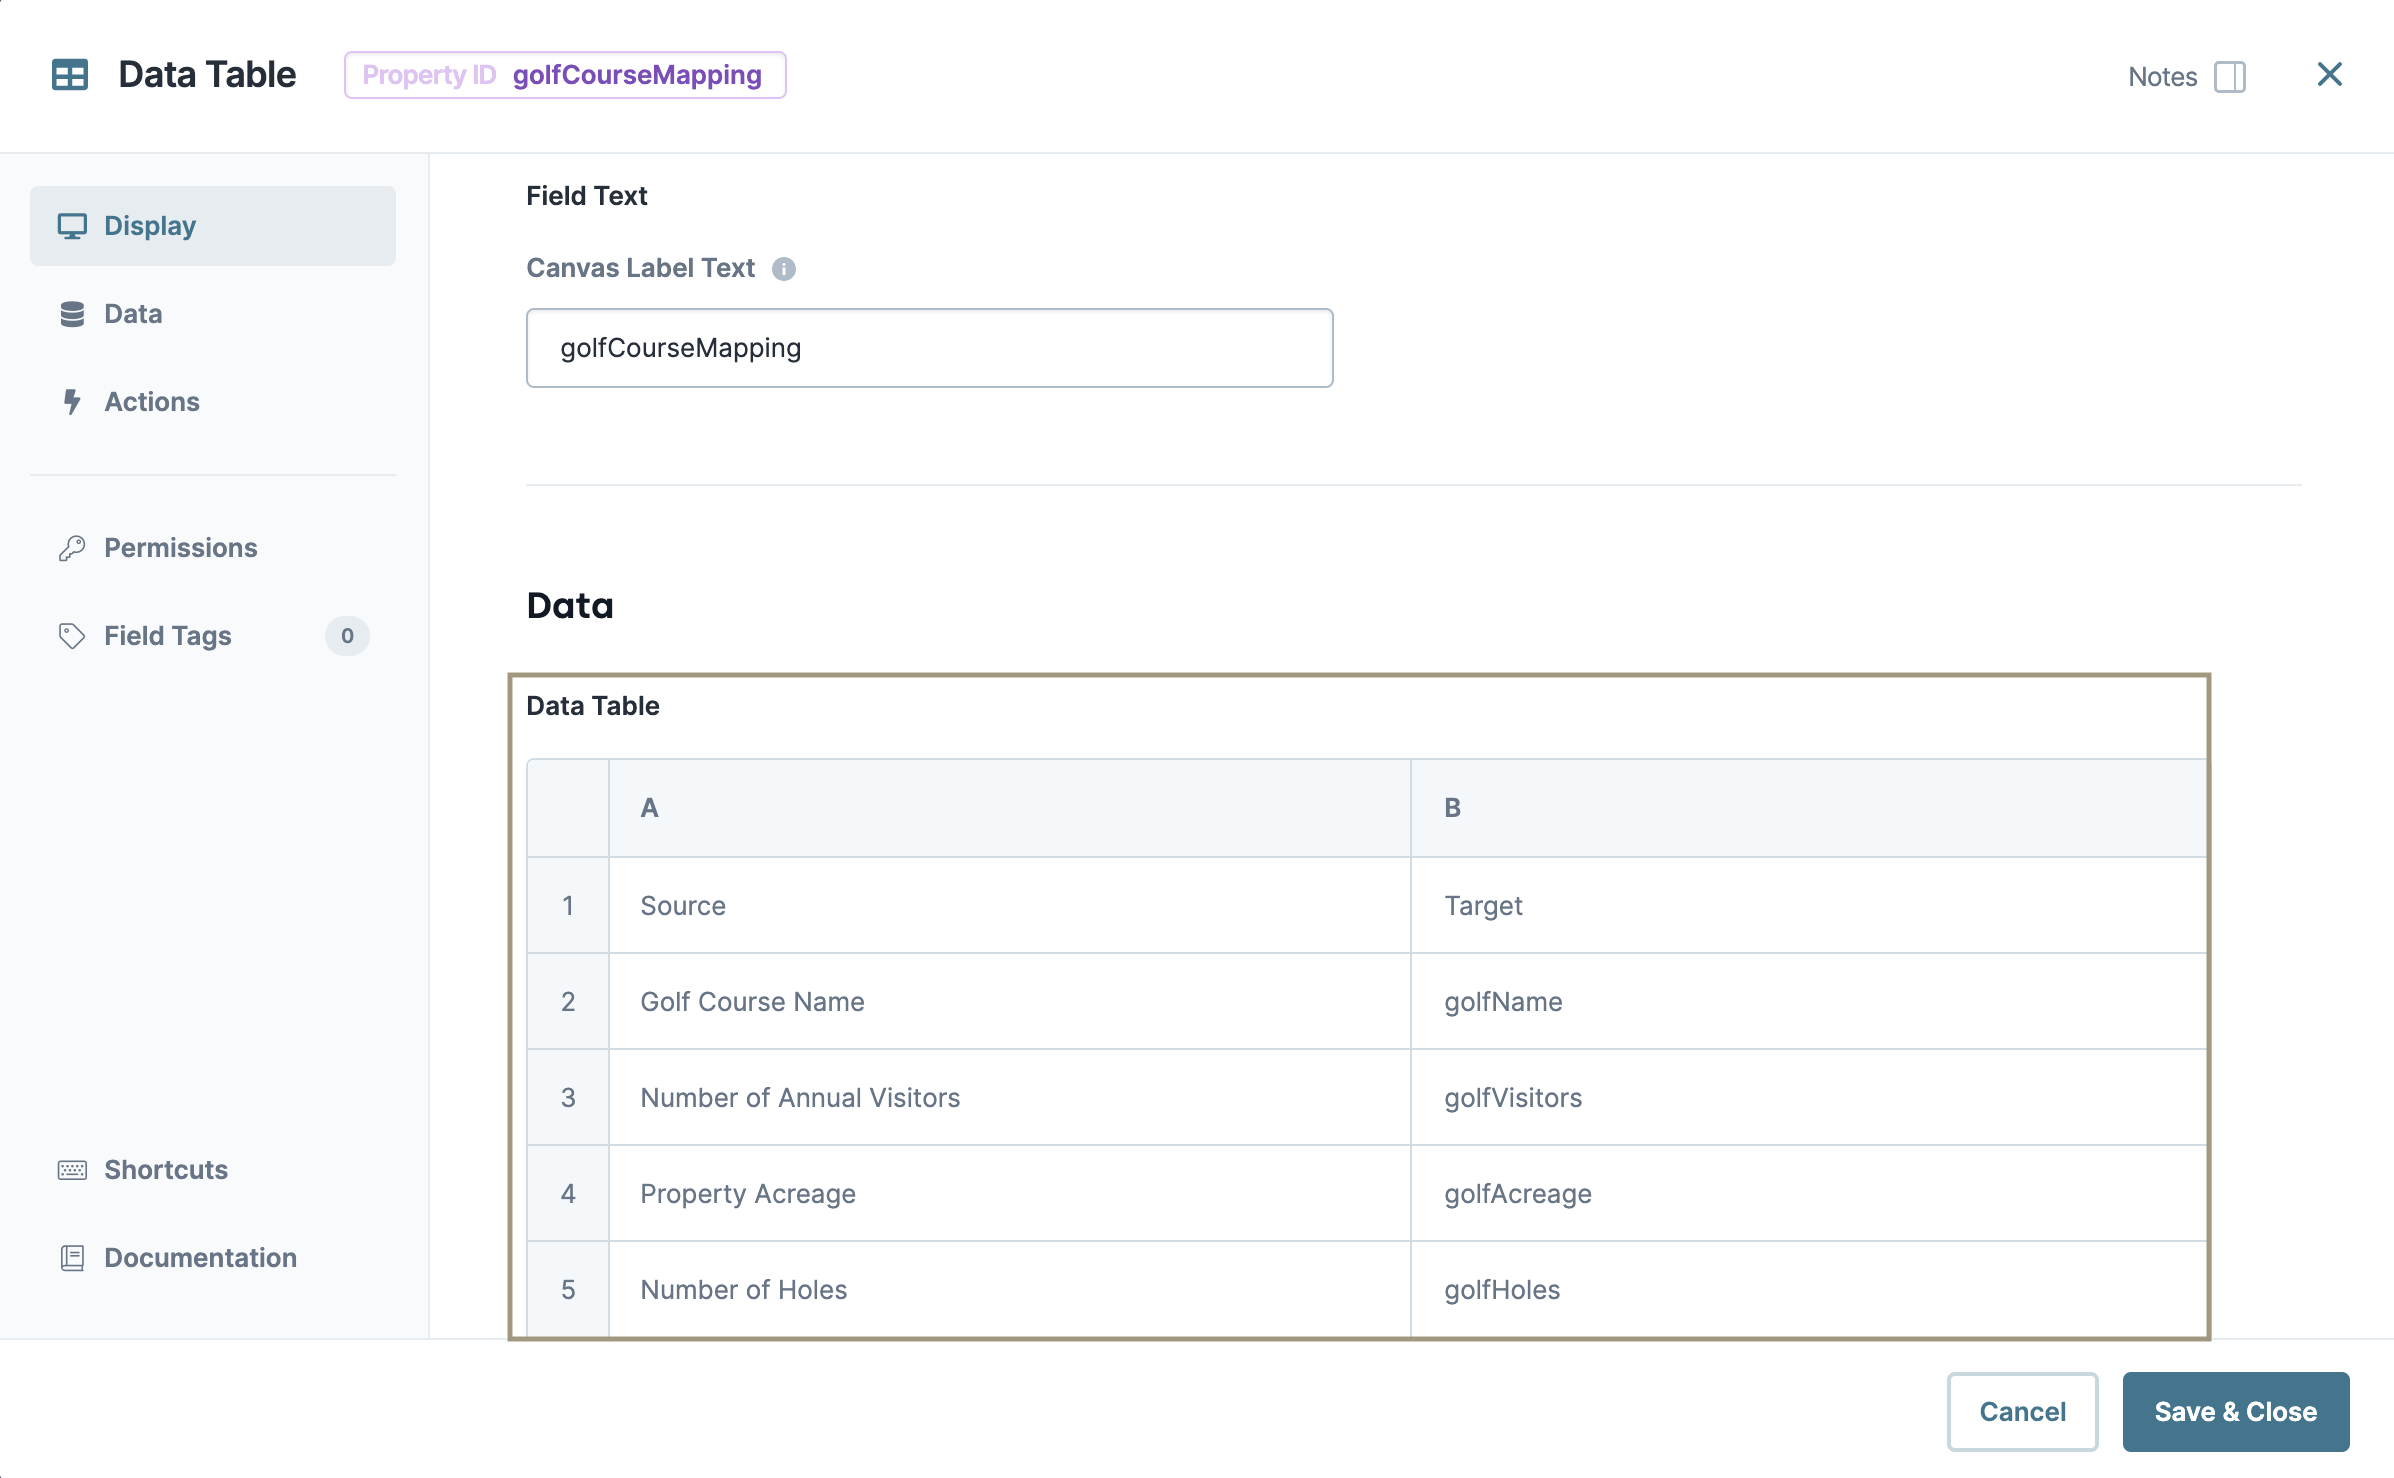
Next, let’s add a Data Table component to determine which columns of the Excel sheet belong in which fields of your application.
We'll create an Excel template as the last step in this configuration. But keep in mind that your Source column must match the label headings you use in your Excel sheet.
Drag and drop a Data Table component onto your canvas, placing it above your File component.
In the Property ID and Label Text fields, enter
golfCourseMapping.Configure the data table as follows:
Source
Target
Golf Course Name
golfName
Number of Annual Visitors
golfVisitors
Property Acreage
golfAcreage
Number of Holes
golfHoles
.png)
Click Save Component.
Configure the Calculator Component
A Data Workflow can’t process an Excel sheet on its own. First, you must retrieve the Excel data and add it to a JSON file using a Calculator component.
Drag and drop a Calculator component onto your canvas, placing it below your Data Table component.
In the Property ID and Canvas Label Text fields, enter
calcGolfCourseUpload.Set the Trigger Type as Watch.
In the Inputs table, enter the following:
Source
Alias
Required
fileGolfCourses[0].json
A
.png) (unchecked)
(unchecked)In the Outputs table, enter the following:
Source
Formula
golfCourseUpload
=A
This configuration outputs the data to the
golfCourseUploadHidden component you’ll add next..png)
Click Save Component.
Configure the Hidden Component
Next, let’s add a Hidden component to act as a storage container for your converted Excel sheet. You’ll later reference this component and its data in your Data Workflow.
Drag and drop a Hidden component onto your canvas, placing it below your Calculator component.
in the Property ID and Label Text fields, enter
golfCourseUpload.Click Save Component.
Configure the Data Workflow Component
The JSON object stored by your Hidden component contains all data from the Excel sheet. Let's add a Data Workflow component to retrieve that data and separate it by golf course and field.
Drag and drop a Data Workflow component onto your canvas, placing it below your
golfCourseUploadHidden component.In the Property ID and Canvas Label Text fields, enter
dwfGolfCourseUpload.
Configure the First Input Operator
Drag and drop an Input operator onto your Data Workflow canvas.
Configure the operator’s Info window as follows:
Setting
Value
Category
Input
Component
golfCourseUpload
Required
Yes
Source
Default
Configure the Second Input Operator
Drag and drop a second Input operator onto your Data Workflow canvas.
Configure the operator’s Info window as follows:
Setting
Value
Category
Input
Component
golfCourseMapping
Required
Yes
Source
Default
Configure the Map Keys Operator
Drag and drop a Map Keys operator onto your Data Workflow canvas.
Configure the operator’s Info window as follows:
Setting
Value
Category
Map Keys
Label
Source Column
Source
Target Column
Target
Connect the output port (right) of the
golfCourseUploadInput operator to the upper input port (left) of the Map Keys operator.Connect the output port (right) of the
golfCourseMappingInput operator to the lower input port (left) of the Map Keys operator.
Configure the Output Operator
Drag and drop an Output operator onto your Data Workflow canvas.
Configure the operator’s Info window as follows:
Setting
Value
Category
Output
Component
adgGolfCourses
Action
Value
Configure the First Console Operator
These Console operators let you troubleshoot if any issues arise.
Drag and drop a Console operator onto your Data Workflow canvas.
Configure the operator’s Info window as follows:
Setting
Value
Category
Console
Label
Connect the output port (right) of the
golfCourseUploadInput operator to the input port (left) of the Console operator.
Configure the Second Console Operator
Drag and drop a second Console operator onto your Data Workflow canvas.
Configure the operator’s Info window as follows:
Setting
Value
Category
Console
Label
Connect the output port (right) of the Map Keys operator to the input port (left) of the Console operator.
Click Save Component.
Save your module.
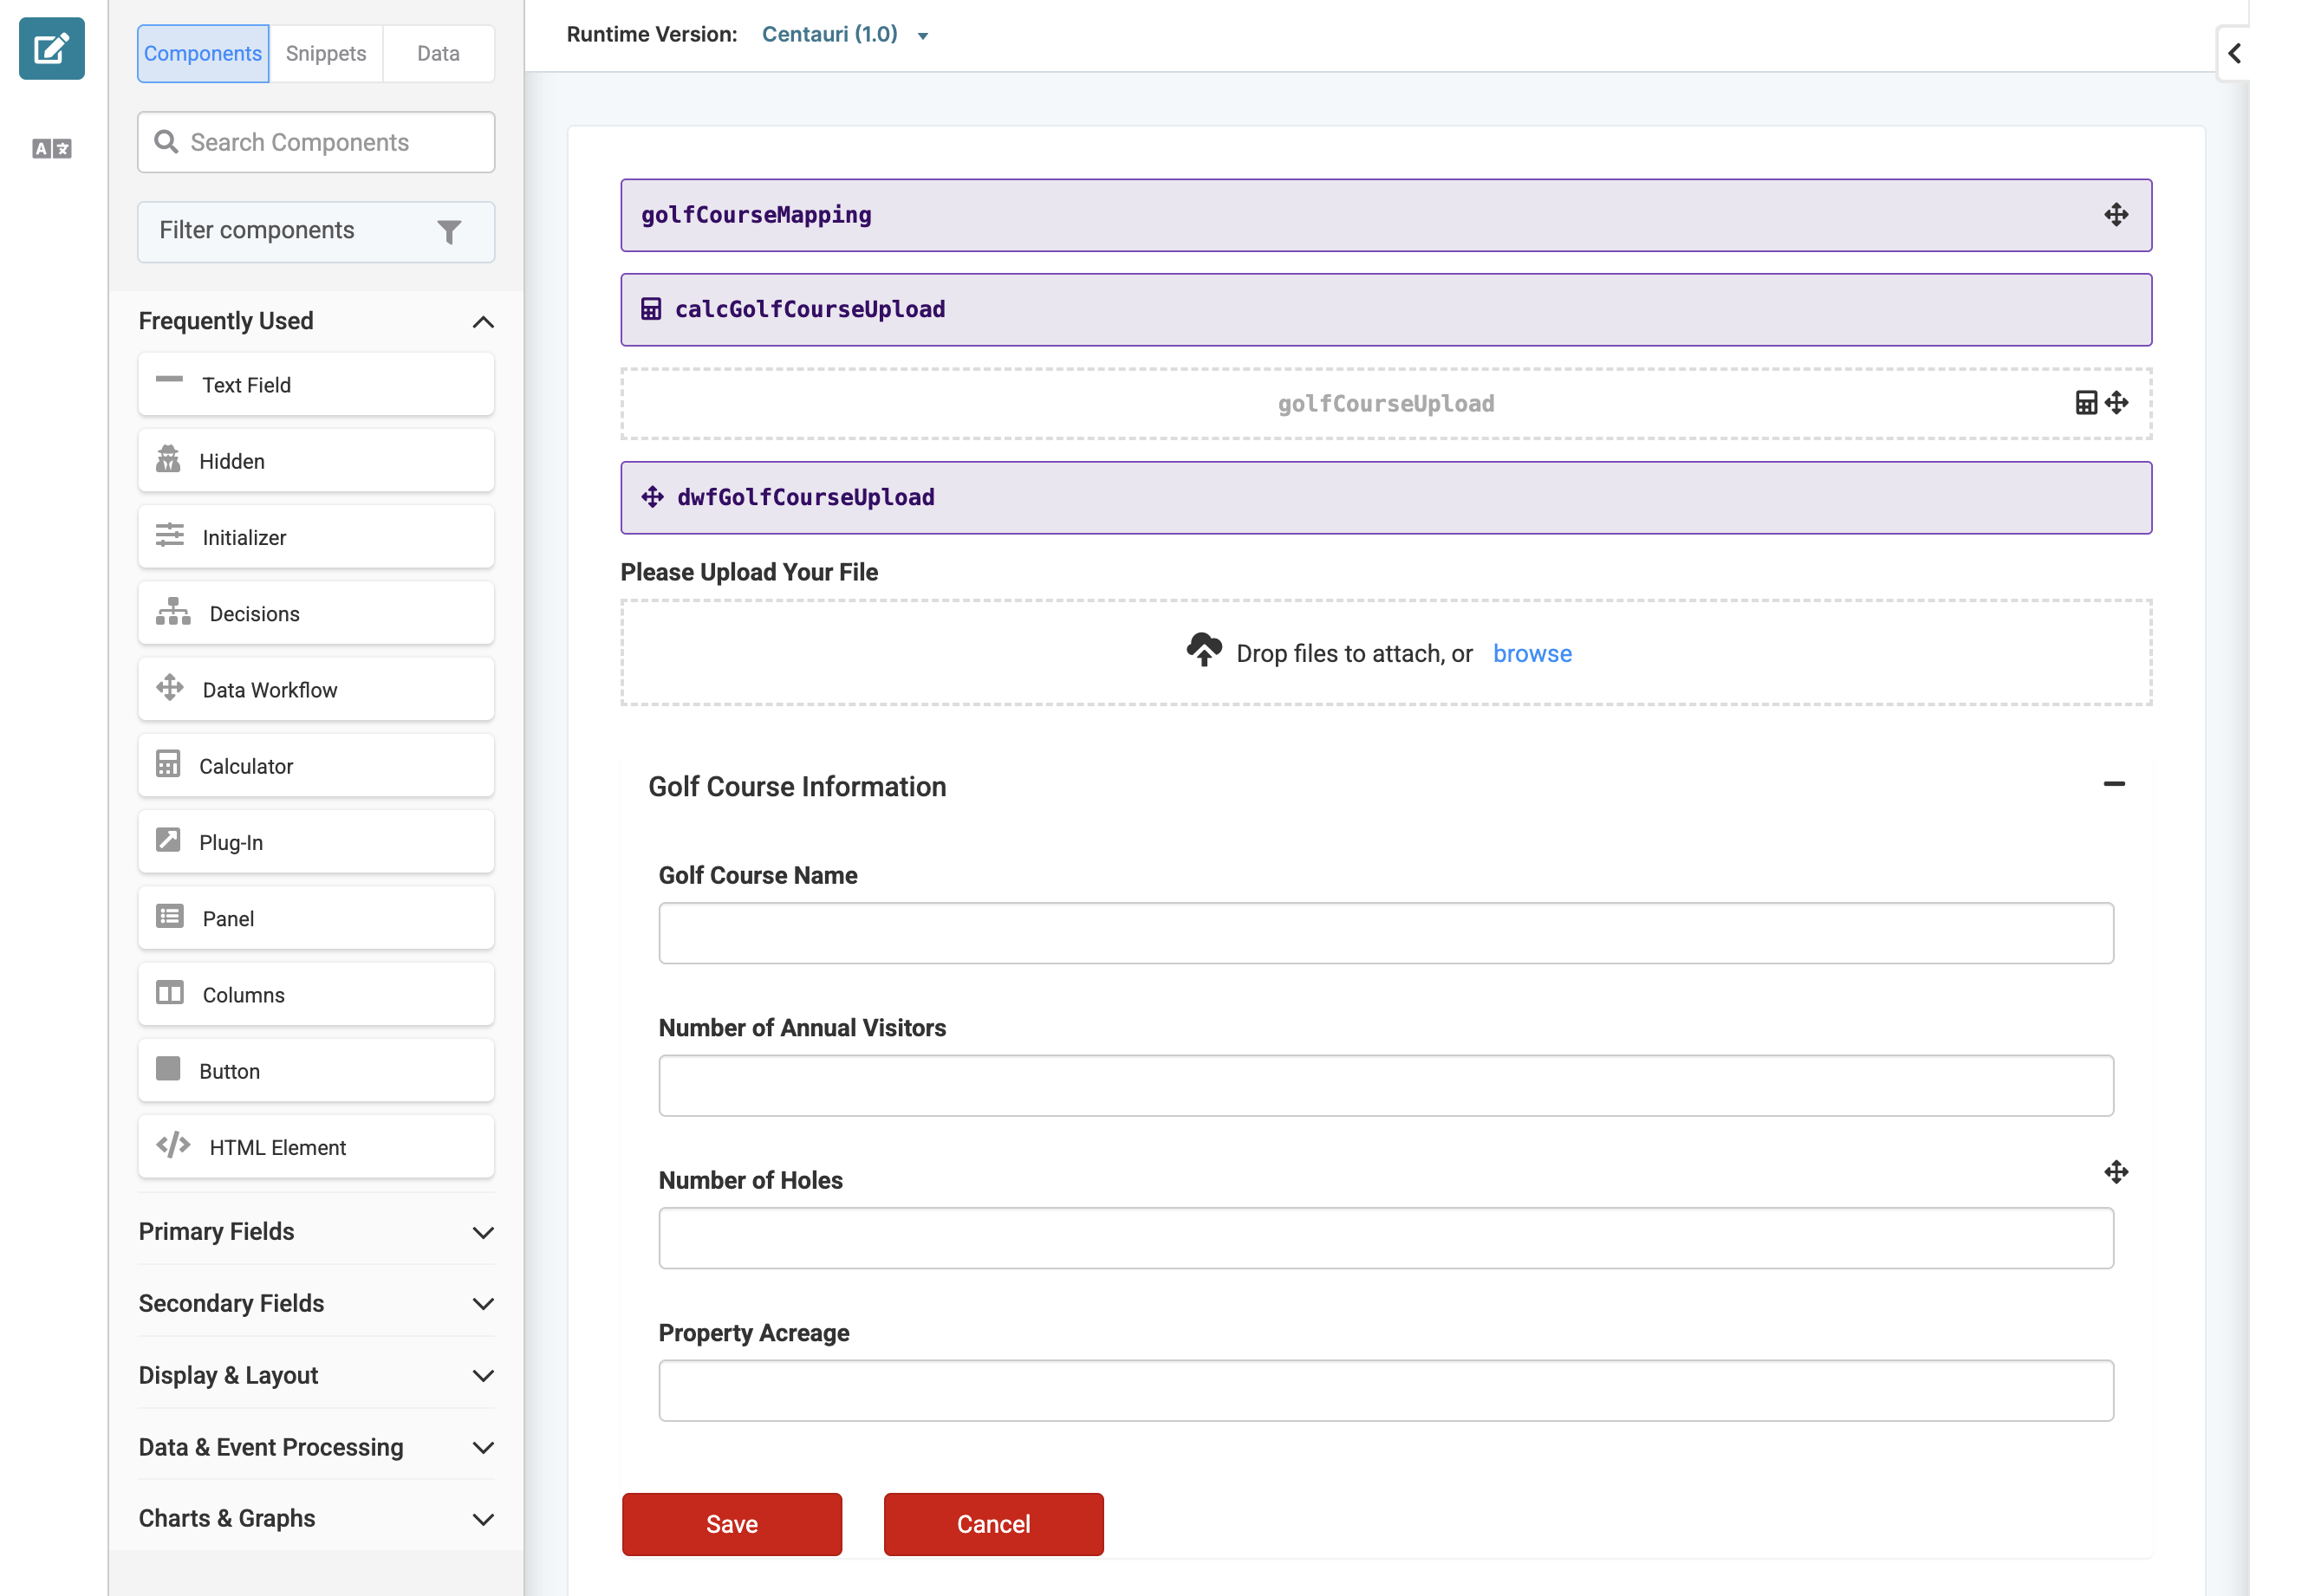
Here's how your completed module looks in the Module Builder:
Configure the Excel Sheet
Your final step happens outside of Unqork. A best practice for Excel uploads is to provide your end-user with an Excel template. Remember that the column labels must match what's used in your Data Table component. You can also set up fields with validation criteria in the Excel template. Keep in mind that data mapping is case sensitive, so you must set those restrictions in your template as well. In our example, we’ll set our Number of Annual Visitors, Property Acreage, and Number of Holes columns to accept numeric values greater than 0.
In Excel, open a blank workbook.
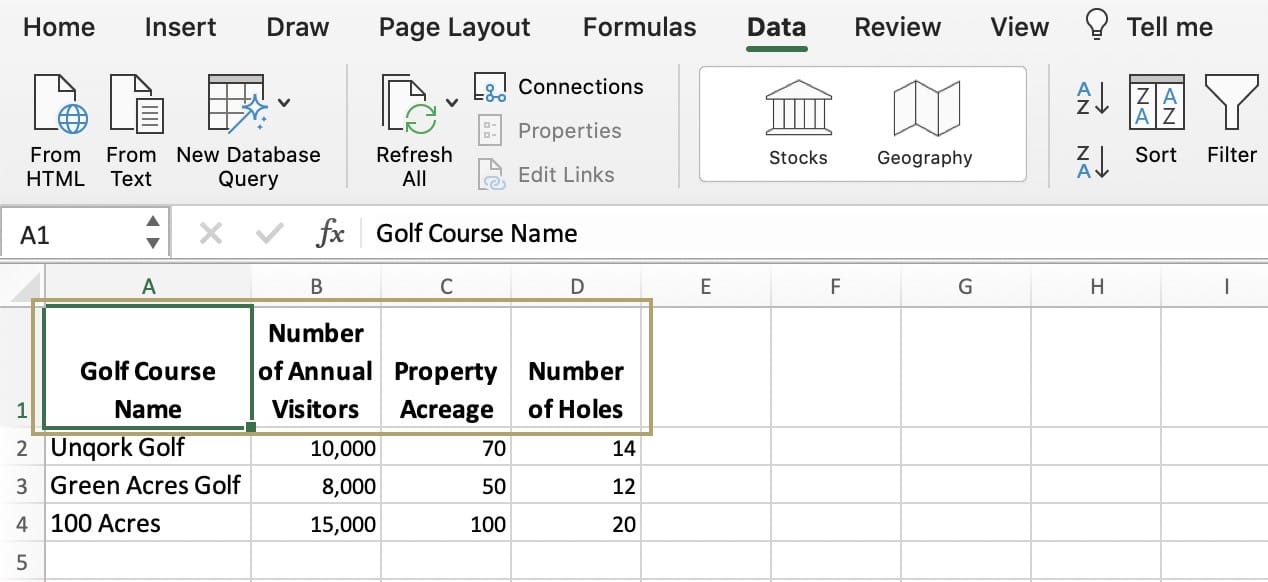
In the first row, enter the following headers:
Golf Course Name
Number of Annual Visitors
Property Acreage
Number of Holes
Highlight columns B, C, and D.
Click the Data tab and select Data Validation.
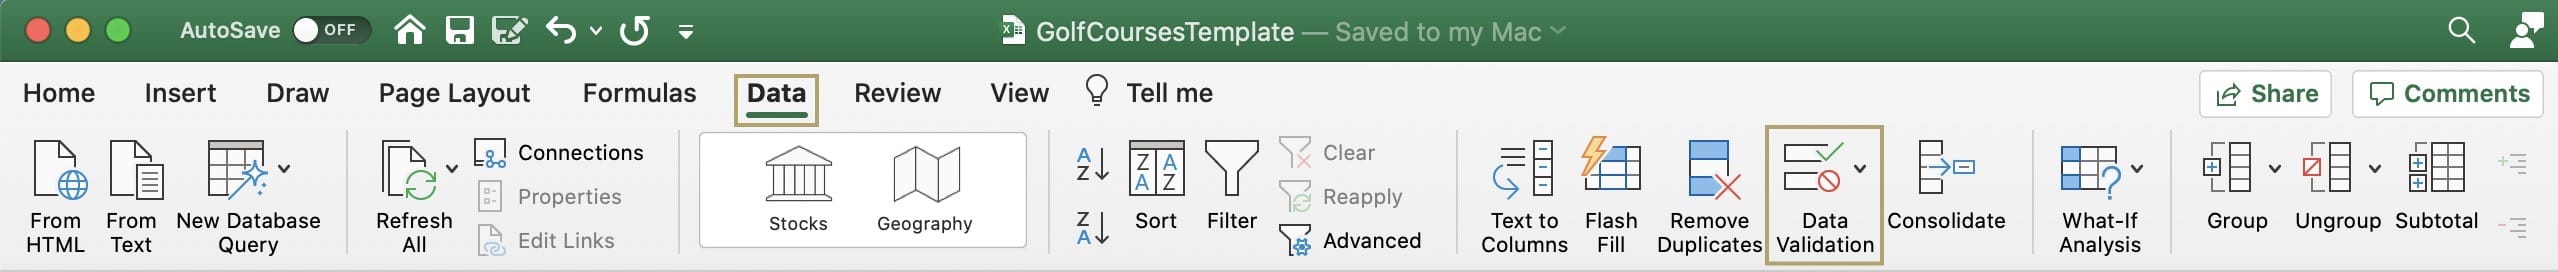
From the Allow drop-down, select Whole Number.
From the Data drop-down, select Greater Than.
Set the Minimum as
0.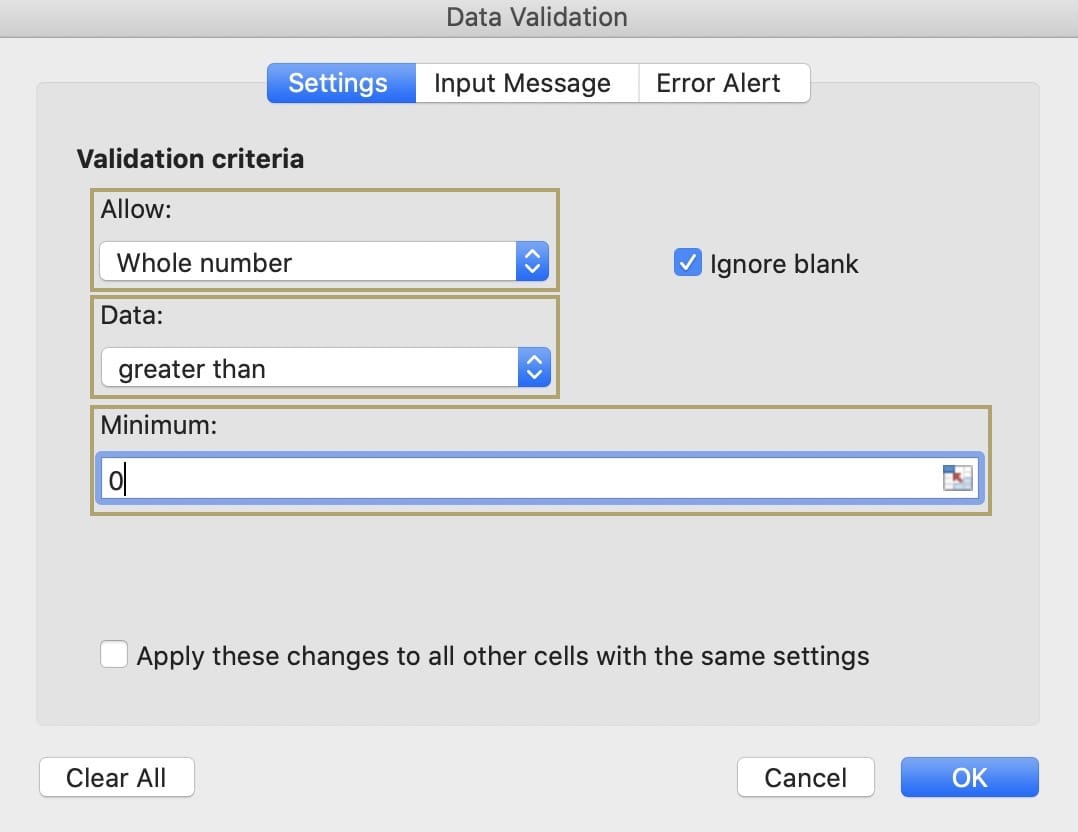
Click OK.
Save your Workbook.
With the above steps completed, you can test your configuration. In your Excel template, input some sample data. Then, preview your Unqork module in Express View and upload the Excel sheet.
Preconfiguration
These instructions assume you have a new Front-End module open, saved, and with a title.
Configure the Advanced Datagrid Component
The Advanced Datagrid component will display the golf course data, including the name of the golf course, the number of annual visitors, the number of holes on the course, and the course's acreage.
In the Module Builder, drag and drop an Advanced Datagrid component onto your canvas.
In the Label field, enter
Golf Course Information.In the Property Name field, enter
adgGolfCourses.In the Display table, enter the following:
ID
Formula
Heading
golfName
Course Name
golfVisitors
Number of Annual Visitors
golfHoles
Number of Holes
golfAcreage
Property Acreage
The entries in the Display table are the components you’ll add in the next steps.
Click Save.
Configure the Text Field Component
Next, you’ll use a Text Field component to store the name of the golf course. You’ll place this component inside your Advanced Datagrid component.
Drag and drop a Text Field component inside your Advanced Datagrid component.
In the Property ID field, enter
golfName.In the Label Text field, enter
Golf Course Name.Click Save & Close.
Configure the Number Components
Next, you’ll use three Number components to store data about the golf course, placing them inside your Advanced Datagrid component.
Drag and drop three Number components inside your Advanced Datagrid component.
In the Property ID and Label Text fields, enter the following for each component:
#
Property ID
Label Text
1
golfVisitors
Number of Annual Visitors
2
golfHoles
Number of Holes
3
golfAcreage
Property Acreage
Save & Close each component as you add it.
Configure the File Component
Your File component is how your end-user uploads their Excel sheet. On its own, the component doesn't interpret any data. Later, you'll add a Data Workflow to retrieve the uploaded files and interpret them.
Drag and drop a File component onto your canvas, placing it above your Advanced Datagrid component.
In the Property ID field, enter
fileGolfCourses.In the Label Text field, enter
Please Upload Your File.Click Save & Close.
Configuration
Configure the Data Table Component
Next, let’s add a Data Table component to determine which columns of the Excel sheet belong in which fields of your application.
We'll create an Excel template as the last step in this configuration. But keep in mind that your Source column must match the label headings you use in your Excel sheet.
Drag and drop a Data Table component onto your canvas, placing it above your File component.
In the Property ID and Canvas Label Text fields, enter
golfCourseMapping.Configure the data table as follows:
Source
Target
Golf Course Name
golfName
Number of Annual Visitors
golfVisitors
Property Acreage
golfAcreage
Number of Holes
golfHoles
Click Save & Close.
Configure the Calculator Component
A Data Workflow can’t process an Excel sheet on its own. First, you must retrieve the Excel data and add it to a JSON file using a Calculator component.
Drag and drop a Calculator component onto your canvas, placing it below your Data Table component.
In the Property ID and Canvas Label Text fields, enter
calcGolfCourseUpload.Set the Trigger Type as Watch.
In the Inputs table, enter the following:
Source
Alias
Required
fileGolfCourses[0].json
A
(unchecked)In the Outputs table, enter the following:
Source
Formula
golfCourseUpload
=A
This configuration outputs the data to the
golfCourseUploadHidden component you’ll add next.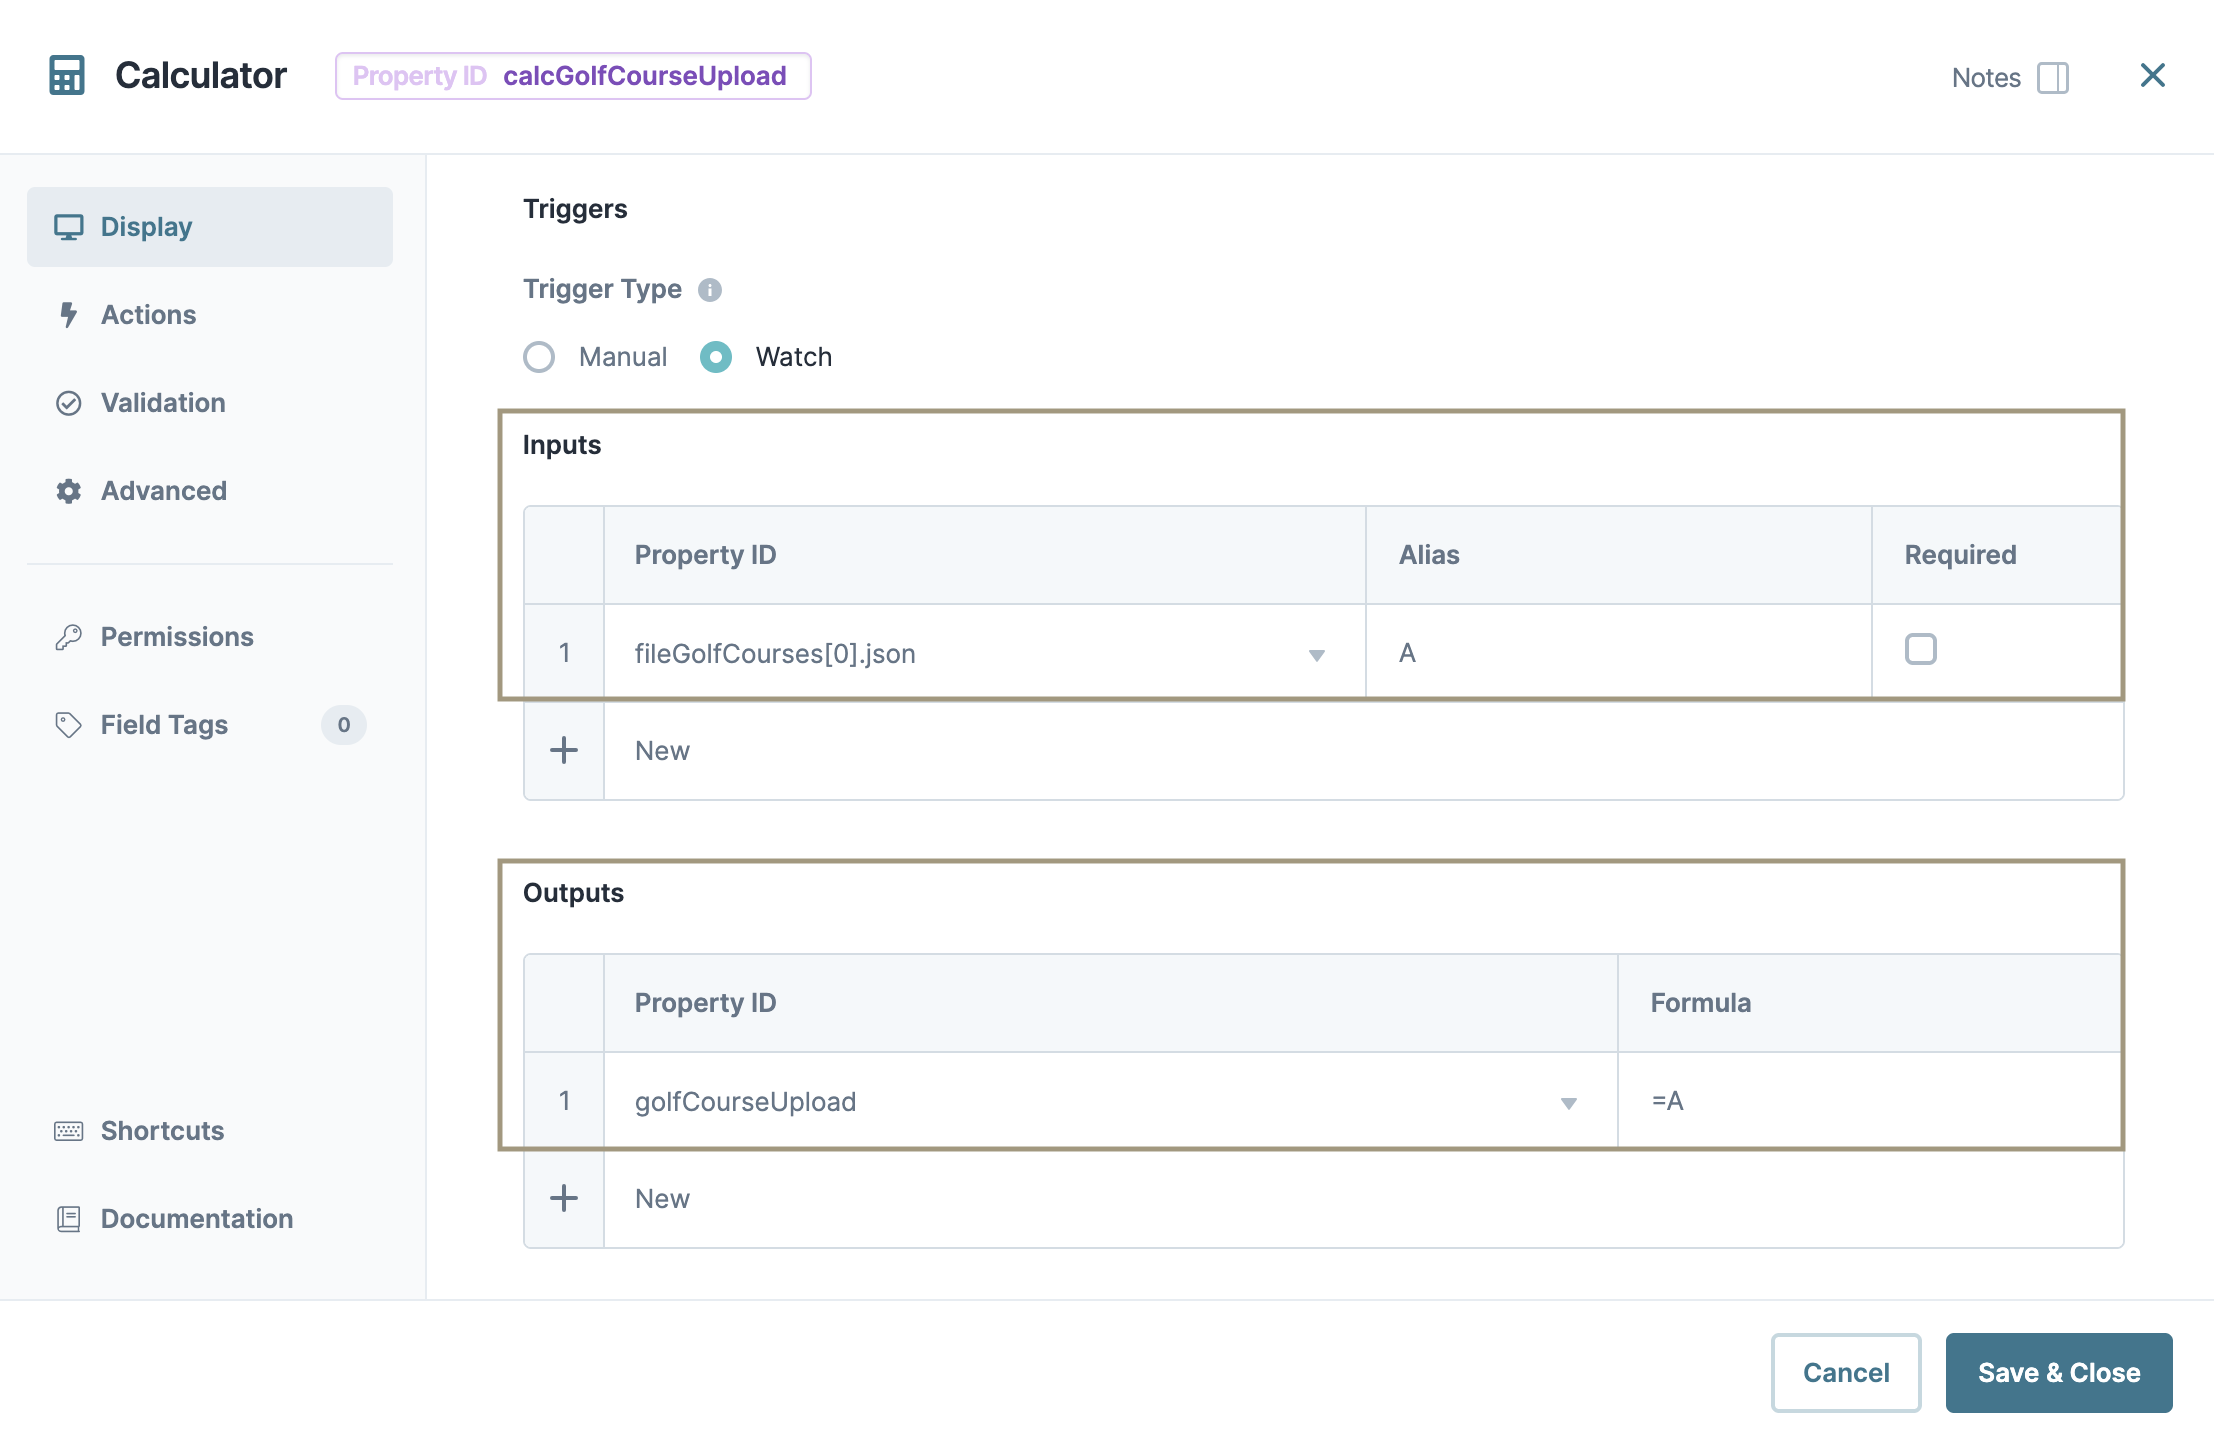
Click Save & Close.
Configure the Hidden Component
Next, let’s add a Hidden component to act as a storage container for your converted Excel sheet. You’ll later reference this component and its data in your Data Workflow.
Drag and drop a Hidden component onto your canvas, placing it below your Calculator component.
in the Property ID and Canvas Label Text fields, enter
golfCourseUpload.Click Save & Close.
Configure the Data Workflow Component
The JSON object stored by your Hidden component contains all data from the Excel sheet. Let's add a Data Workflow component to retrieve that data and separate it by golf course and field.
Drag and drop a Data Workflow component onto your canvas, placing it below your Hidden component.
In the Canvas Label Text and Property Name fields, enter
dwfGolfCourseUpload.
Configure the First Input Operator
Drag and drop an Input operator onto your Data Workflow canvas.
Configure the operator’s Info window as follows:
Setting
Value
Category
Input
Component
golfCourseUpload
Required
Yes
Source
Default
Configure the Second Input Operator
Drag and drop a second Input operator onto your Data Workflow canvas.
Configure the operator’s Info window as follows:
Setting
Value
Category
Input
Component
golfCourseMapping
Required
Yes
Source
Default
Configure the Map Keys Operator
Drag and drop a Map Keys operator onto your Data Workflow canvas.
Configure the operator’s Info window as follows:
Setting
Value
Category
Map Keys
Label
Source Column
Source
Target Column
Target
Connect the output port (right) of the
golfCourseUploadInput operator to the upper input port (left) of the Map Keys operator.Connect the output port (right) of the
golfCourseMappingInput operator to the lower input port (left) of the Map Keys operator.
Configure the Output Operator
Drag and drop an Output operator onto your Data Workflow canvas.
Configure the operator’s Info window as follows:
Setting
Value
Category
Output
Component
adgGolfCourses
Action
Value
Configure the First Console Operator
These Console operators let you troubleshoot if any issues arise.
Drag and drop a Console operator onto your Data Workflow canvas.
Configure the operator’s Info window as follows:
Setting
Value
Category
Console
Label
Connect the output port (right) of the
golfCourseUploadInput operator to the input port (left) of the Console operator.
Configure the Second Console Operator
Drag and drop a second Console operator onto your Data Workflow canvas.
Configure the operator’s Info window as follows:
Setting
Value
Category
Console
Label
Connect the output port (right) of the Map Keys operator to the input port (left) of the Console operator.
Click Save.
Save your module.
Here's how your completed module looks in the Module Builder:
Configure the Excel Sheet
Your final step happens outside of Unqork. A best practice for Excel uploads is to provide your end-user with an Excel template. Remember that the column labels must match what's used in your Data Table component. You can also set up fields with validation criteria in the Excel template. Keep in mind that data mapping is case sensitive, so you must set those restrictions in your template as well. In our example, we’ll set our Number of Annual Visitors, Property Acreage, and Number of Holes columns to accept numeric values greater than 0.
In Excel, open a blank workbook.
In the first row, enter the following headers:
Golf Course Name
Number of Annual Visitors
Property Acreage
Number of Holes
Highlight columns B, C, and D.
Click the Data tab and select Data Validation.
From the Allow drop-down, select Whole Number.
From the Data drop-down, select Greater Than.
Set the Minimum as
0.Click OK.
Save your Workbook.
With the above steps completed, you can test your configuration. In your Excel template, input some sample data. Then, preview your Unqork module in Express View and upload the Excel sheet.