Overview
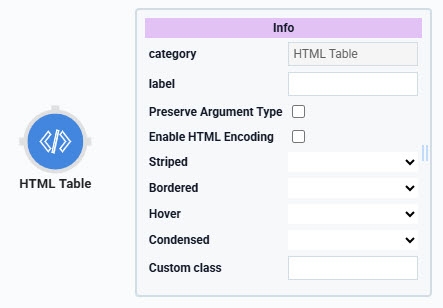
The HTML Table operator converts a data table into an HTML format. You'll use this operator when you want to display a clean, simple HTML version of your data. Additionally, this operator lets Creators customize the appearance of the table in the following ways:
Striped: Alternating row colors for readability.
Bordered: Adds borders around the table and cells.
Hoverable: Highlights rows when the user hovers over them.
Condensed: Creates a more compact table layout.
Creators can also use the argument port to create and apply their own CSS custom classes.
The HTML Table operator is located under the Table group to the left of the Data Workflow canvas.
About the Info Window
Learn more about each setting in the HTML Table operator's Info window:
Info | |
|---|---|
Category | Grayed out and non-adjustable setting indicating the operation type. |
Label | Sets the label for your operator, displaying below the operator on your Data Workflow canvas. This field is optional, but set a label if you use more than one of the same operator type. A label helps you identify your operators without opening any Info windows. |
Preserve Argument Type | When selected, this setting ensures the argument data type is respected when the operator executes. |
Striped | Sets the HTML table class as striped. The resulting table has alternating color rows. |
Bordered | Sets the HTML table class as border. The resulting table has an exterior border. |
Hover | Sets the HTML table class as hoverable. The rows in the resulting table change color when hovered over. |
Condensed | Sets the HTML table class as condensed. The resulting table shows in a smaller format. |
Custom Class | Lets you set a custom HTML class for your table. You can also set a custom class using an argument by connecting an Input operator to the HTML Table operator's argument port. Then, entering |
Adding an HTML Table Operator
For this example, configure a Data Workflow component to retrieve data from a Data Table component. Use the HTML Table operator to convert the data to HTML data. Then, send the HTML data to an HTML Element component to display it in the browser.
Configure the Data Table Component
First, configure a Data Table component to store sample data.
In the Module Builder, drag and drop a Data Table component onto your canvas.
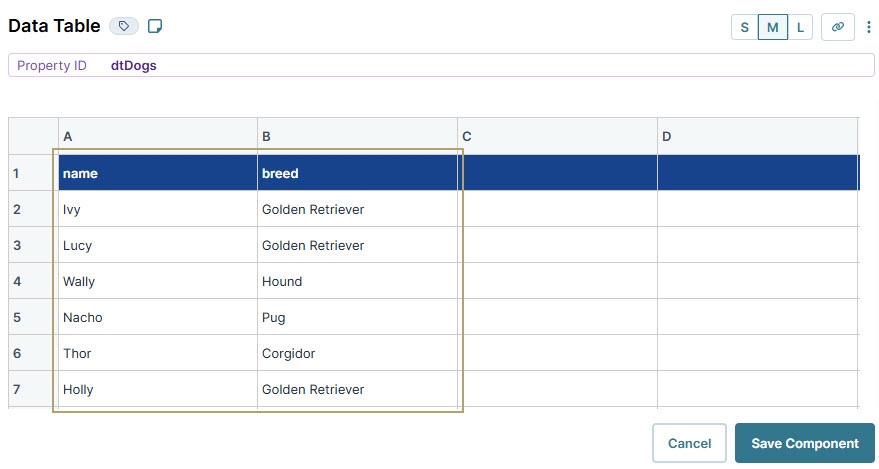
In the Property ID field, enter dtDogs.
In the data table, enter the following:
A
B
1
name
breed
2
Ivy
Golden Retriever
3
Lucy
Golden Retriever
4
Wally
Hound
5
Nacho
Pug
6
Thor
Corgidor
7
Holly
Golden Retriever
Click Save Component.
Configure the HTML Element Component
Configure an HTML Element component to receive the HTML table data from the Data Workflow.
Drag and drop a HTML Element component onto your canvas, placing it below the dtDogs Data Table component.
In the Property ID field, enter htmlExportTable .
Click Save Component.
Configure the Data Workflow Component
Configure a Data Workflow component to retrieve the dtDogs Data Table component data and convert it into HTML data. Then, configure the output to send the data to the htmlExportTable HTML Element component. You'll also configure a Console operator to view how the data passes through the Data Workflow in the DevTools Console.
Drag and drop a Data Workflow onto your canvas, placing it below the htmlExportTable HTML Element component.
In the Property ID and Canvas Label Text fields, enter
dwfExportTable.
Configure the Input Operator
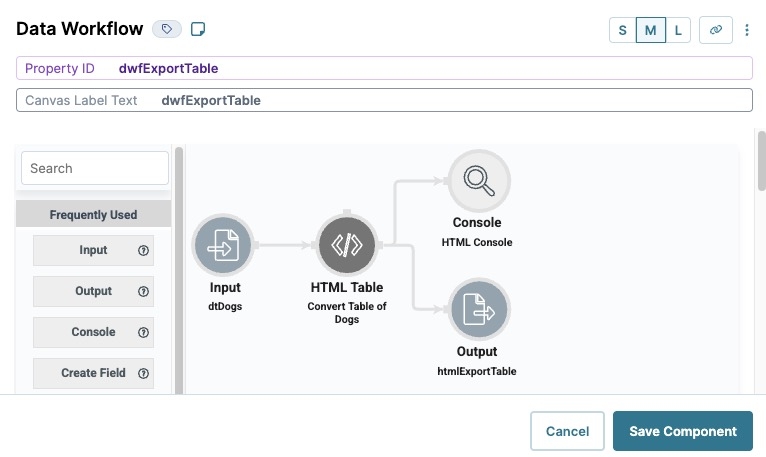
Drag and drop an Input operator onto your Data Workflow canvas.
Configure the operator's Info window as follows:
Info
Category
Input
Component
dtDogs
Required
Yes
Source
Default
Configure the HTML Table Operator
Drag and drop an HTML Table operator onto your Data Workflow canvas.
Configure the operator's Info window as follows:
Info
Category
HTML Table
Label
Convert Table of Dogs
Striped
No
Bordered
No
Hover
No
Condensed
No
Custom Class
Connect the output port (right) of the dtDogs Input operator to the input port (left) of the Convert Table of Dogs HTML Table operator.
Configure the Output Operator
Next, output the HTML table data to htmlExportTable HTML Element component.
Drag and drop an Output operator onto your Data Workflow canvas.
Configure the operator's Info window as follows:
Info
Category
Output
Component
htmlExportTable
Action
value
Connect the output port (right) of the Convert Table of DogsHTML Table operator to the input port (left) of the htmlExportTableOutput operator.
Configure the Console Operator
Add a Console operator as an output to the HTML Table operator so you can review the results in the DevTools Console.
Drag and drop a Console operator onto your Data Workflow canvas.
Configure the operator's Info window as follows:
Info
Category
Console
Label
HTML Console
Connect the output port (right) of the Convert Table of Dogs HTML Table operator to the input port (left) of the HTML Console Console operator.
Click Save Component.
Here's how the completed Data Workflow looks:
Configure the Button Component
Lastly, configure a Button component to trigger the Data Workflow in Express View.
Drag and drop a Button component onto your canvas, placing it below the htmlExportTable HTML Element component.
In the Property ID field, enter btnShowTable.
In the Label Text field, enter
Show Table.From the Action Type drop-down, select Event.
From the On Click drop-down, select dwfExportTable.
.jpg)
Click Save Component.
Save your module.
Preview your module in Express View and open the DevTools Console. Then, click Show Table to display the data.
.jpg)
Overview
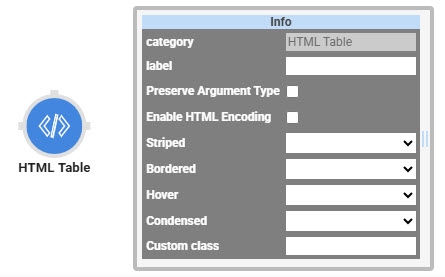
The HTML Table operator converts a data table into an HTML format. You'll use this operator when you want to display a clean, simple HTML version of your data. Additionally, this operator lets Creators customize the appearance of the table in the following ways:
Striped: Alternating row colors for readability.
Bordered: Adds borders around the table and cells.
Hoverable: Highlights rows when the user hovers over them.
Condensed: Creates a more compact table layout.
Creators can also use the argument port to create and apply their own CSS custom classes.
The HTML Table operator is located under the Table group to the left of the Data Workflow canvas.
About the Info Window
Learn more about each setting in the HTML Table operator's Info window:
Setting | Description |
|---|---|
Category | Grayed out and non-adjustable setting indicating the operation type. |
Label | Sets the label for your operator, displaying below the operator on your Data Workflow canvas. This field is optional, but set a label if you use more than one of the same operator type. A label helps you identify your operators without opening any Info windows. |
Preserve Argument Type | When selected, this setting ensures the argument data type is respected when the operator executes. |
Striped | Sets the HTML table class as striped. The resulting table has alternating color rows. |
Bordered | Sets the HTML table class as border. The resulting table has an exterior border. |
Hover | Sets the HTML table class as hoverable. The rows in the resulting table change color when hovered over. |
Condensed | Sets the HTML table class as condensed. The resulting table shows in a smaller format. |
Custom Class | Lets you set a custom HTML class for your table. You can also set a custom class using an argument by connecting an Input operator to the HTML Table operator's argument port. Then, entering |
Adding an HTML Table Operator
For this example, configure a Data Workflow component to retrieve data from a Data Table component. Use the HTML Table operator to convert the data to HTML data. Then, send the HTML data to an HTML Element component to display it in the browser.
Configure the Data Table Component
First, configure a Data Table component to store sample data.
In the Module Builder, drag and drop a Data Table component onto your canvas.
In the Property ID field, enter dtDogs.
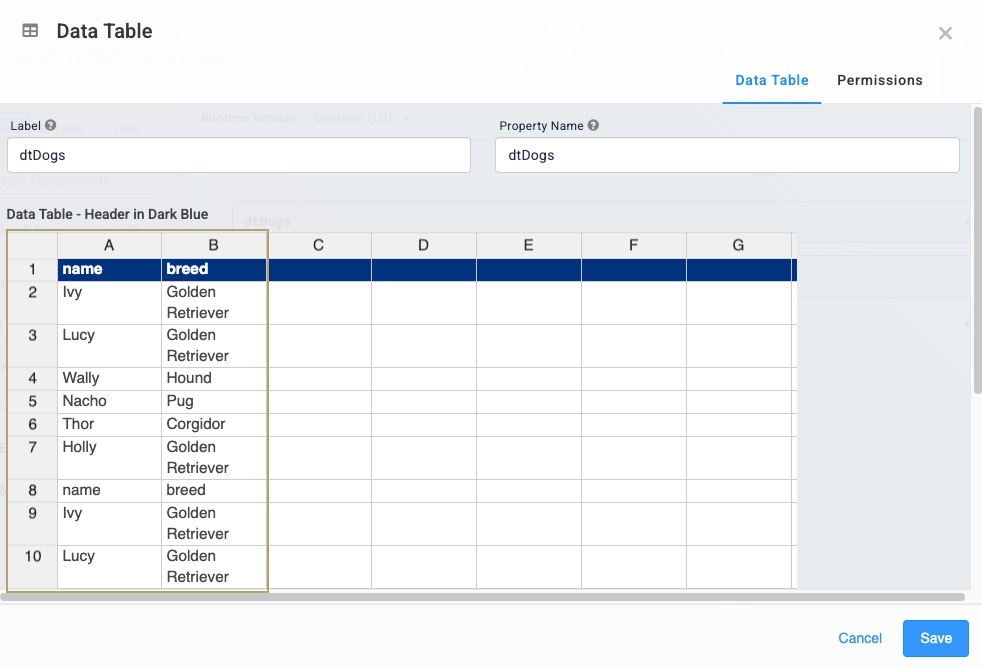
In the data table, enter the following:
A
B
1
name
breed
2
Ivy
Golden Retriever
3
Lucy
Golden Retriever
4
Wally
Hound
5
Nacho
Pug
6
Thor
Corgidor
7
Holly
Golden Retriever
Click Save.
Configure the HTML Element Component
Configure an HTML Element component to receive HTML table data from the Data Workflow.
Drag and drop a HTML Element component onto your canvas, placing it below the dtDogs Data Table component.
In the Property ID field, enter htmlExportTable.
Click Save.
Configure the Data Workflow Component
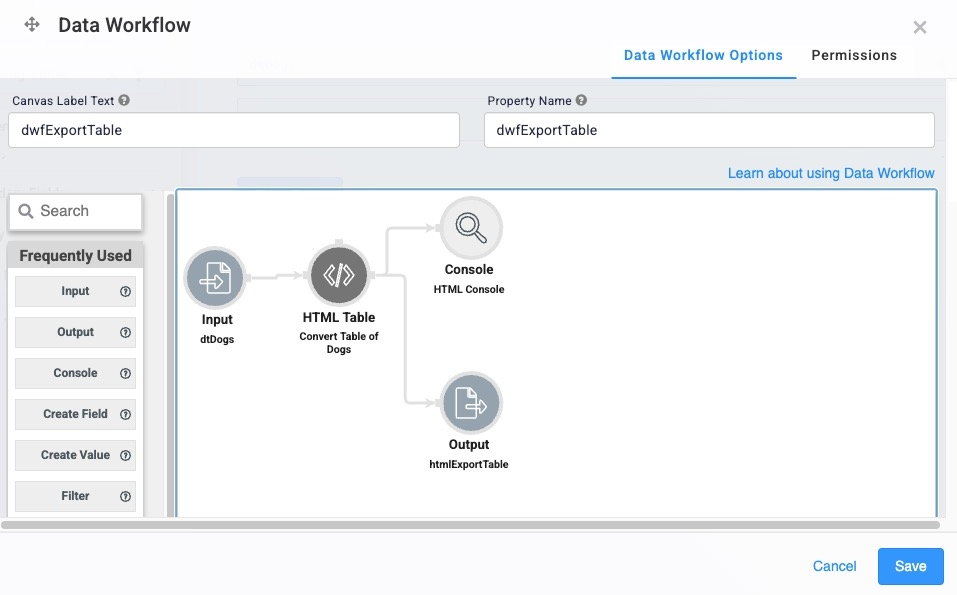
Configure a Data Workflow component to retrieve the dtDogs Data Table component data and convert it into HTML data. Then, configure the output to send the data to the htmlExportTable HTML Element component. You'll also configure a Console operator to view how the data passes through the Data Workflow in the DevTools Console.
Drag and drop a Data Workflow onto your canvas, placing it below the htmlExportTable HTML Element component.
In the Canvas Label Text and Property Name fields, enter
dwfExportTable.
Configure the Input Operator
Drag and drop an Input operator onto your Data Workflow canvas.
Configure the operator's Info window as follows:
Setting
Value
Category
Input
Component
dtDogs
Required
Yes
Source
Default
Configure the HTML Table Operator
Drag and drop an HTML Table operator onto your Data Workflow canvas.
Configure the operator's Info window as follows:
Setting
Value
Category
HTML Table
Label
Convert Table of Dogs
Striped
No
Bordered
No
Hover
No
Condensed
No
Custom Class
Connect the output port (right) of the dtDogs Input operator to the input port (left) of the Convert Table of Dogs HTML Table operator.
Configure the Output Operator
Next, output the HTML table data to htmlExportTable HTML Element component.
Drag and drop an Output operator onto your Data Workflow canvas.
Configure the operator's Info window as follows:
Setting
Value
Category
Output
Component
htmlExportTable
Action
value
Connect the output port (right) of the Convert Table of DogsHTML Table operator to the input port (left) of the htmlExportTableOutput operator.
Configure the Console Operator
Add a Console operator as an output to the HTML Table operator so you can review the results in the DevTools Console.
Drag and drop a Console operator onto your Data Workflow canvas.
Configure the operator's Info window as follows:
Setting
Value
Category
Console
Label
HTML Console
Connect the output port (right) of the Convert Table of Dogs HTML Table operator to the input port (left) of the HTML Console Console operator.
Click Save.
Here's how the completed Data Workflow looks:
Configure the Button Component
Lastly, configure a Button component to trigger the Data Workflow in Express View.
Drag and drop a Button component onto your canvas, placing it below the htmlExportTable HTML Element component.
In the Property ID field, enter btnShowTable.
In the Label Text field, enter
Show Table.Set the Action Type as Event.
From the On Click drop-down, select dwfExportTable.
Click Save & Close.
Save your module.
Preview your module in Express View and open the DevTools Console. Then, click Show Table to display the data.
.jpg)