How to: Create a Dashboard Using the Grid Component
Estimated Reading Time: 5 minutes
Overview
Using the Grid component, you can collect, organize, and display data to the end-user in a dashboard. The data you display can be added manually or imported into your Grid component.
In this how-to guide, you'll create a dashboard that displays imported values. You'll configure a Grid component with the component fields to display your data. You'll import values from another Unqork application using an internal API to populate your Grid component.
What You'll Learn
In this
Set Up Your Dashboard Module
Start by setting up a module application where you'll add your Grid component.
What You Need
To create a new module application, you need:
Accessing Vega
Currently, the Vega Table component is only available in the Vega runtime engine. To use the Vega runtime in your module:
| 1. | Open your workspace. |
| 2. | Select your application. |
| 3. | Open your application module. |
| 4. | At the top of the Module Builder, select the version drop-down. By default, it's set to Runtime v1.0.0 |
| 5. | From the version drop-down, select Runtime v2.0.0 |
Configuring the Dashboard Grid
Configuring the Grid Component Fields
Your Dashboard Grid displays submission data from an employee travel request workflow application. In the travel request application, employees submit travel requests, which are then reviewed by their managers. The dashboard you create imports all reviewed employee travel requests. This data includes the employee and manager names, the request status (approved or denied), the estimated cost, and the manager's budget. In order to display this data in your Grid, start your configuration by creating the appropriate component column fields.
| 1. | Drag and drop three  Text Field components onto your canvas. Text Field components onto your canvas. |
| 2. | In the Property ID and Label Text fields, enter the following: |
|
Property ID |
Label Text |
|---|---|
|
employeeFullName |
Employee's Full Name |
|
managerFullName |
Manager's Full Name |
|
requestStatus |
Status |
| 3. | Save & Close each component as you add it. |
| 4. | Drag and drop two  Number components onto your canvas, placing them below your Text Field components. Number components onto your canvas, placing them below your Text Field components. |
| 5. | In the Property ID and Label Text fields, enter the following: |
|
Property ID |
Label Text |
|---|---|
|
employeeEstimatedCost |
Est. Cost ($) |
|
managerBudget |
EOY Budget ($) |
| 6. | Save & Close each component as you add it. |
Configuring the Grid Component
Now that you've added the Grid component fields, you can configure your Grid component and nest the component fields inside it.
| 1. | Drag and drop a Number components. |
| 2. | In the Property ID field, enter gridInsurance. |
| 3. | In the Label Text field, enter Insurance Claim Summary. |
| 4. | Set the Read Only View toggle to  (ON). (ON). |
| 5. | Click Save & Close. |
| 6. | Drag and drop the employeeFullName, managerFullName, and requestStatus Text Field components inside the gridInsurance |
| 7. | Drag and drop the employeeEstimatedCost and managerBudget Number components inside the gridInsurance Text Field components. |
| 8. | Click Save & Close. |
Configure the Grid Data
Next, import and display submission data from another Unqork application in your Grid component.
Configuring the Plug-In Component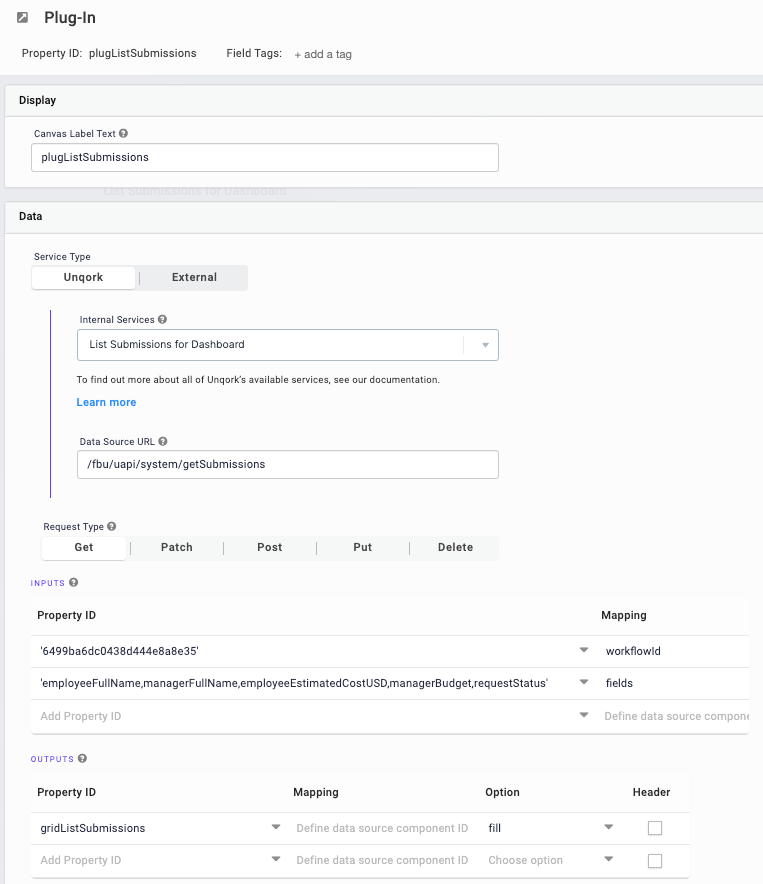
To import the submission data into your module, use a Plug-In component.
| 1. | Drag and drop a  Plug-In component onto your canvas, placing it above the gridInsurance Plug-In component onto your canvas, placing it above the gridInsurance |
| 2. | In the Property ID and Canvas Label Text fields, enter plugListSubmissions. |
| 3. | From the Internal Services drop-down, select List Submissions for Dashboard. |
| 4. | In the Inputs table, enter the following: |
|
Property ID |
Mapping |
|---|---|
|
'6499ba6dc0438d444e8a8e35' |
workflowId |
|
'employeeFullName,managerFullName,employeeEstimatedCostUSD,managerBudget,requestStatus' |
fields |
| 5. | In the Outputs table, enter the following: |
|
Property ID |
Mapping |
Option |
|---|---|---|
|
gridListSubmissions |
|
fill |
TIP When you use a Plug-In component to import and display data in a Grid component, enter fill in the Option column of the Outputs table. The fill setting fills the imported data into the matching fields nested in the Grid.
| 6. | Click Save & Close. |
Configuring the Initializer Component
Add an Initializer component to trigger your Plug-In component when the page loads.
| 1. | Drag and drop an  Initializer component onto your canvas, placing it above the plugListSubmissions Plug-In component. Initializer component onto your canvas, placing it above the plugListSubmissions Plug-In component. |
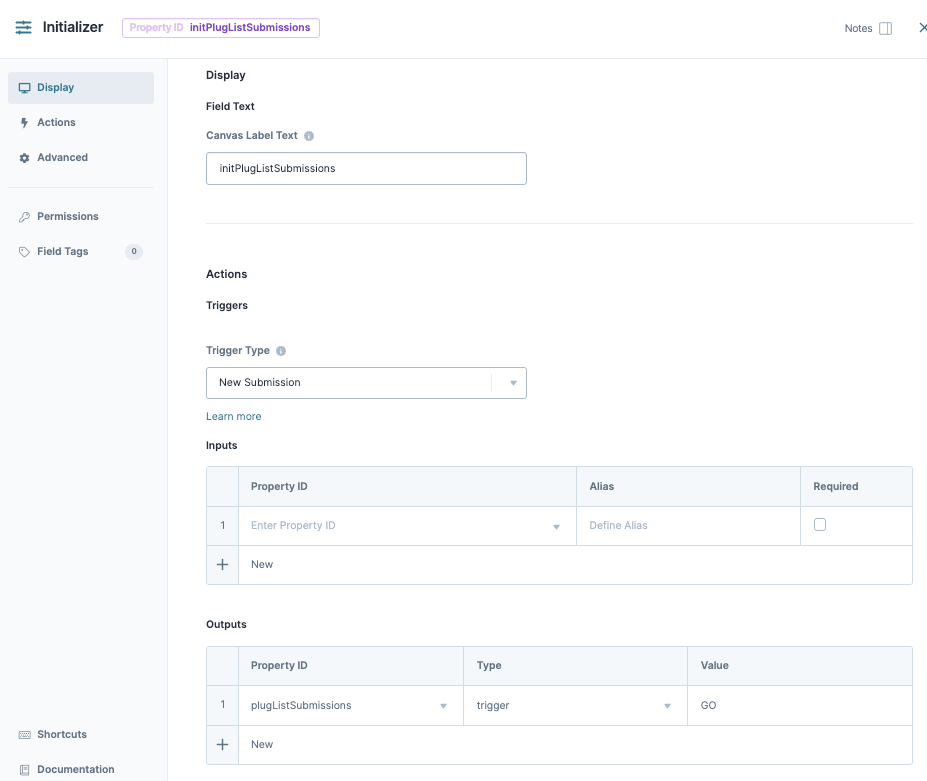
| 2. | In the Property ID and Canvas Label Text fields, enter initPlugListSubmissions. |
| 3. | From the Trigger Type drop-down, select New Submission. |
| 4. | In the Outputs table, enter the following: |
|
Property ID |
Type |
Value |
|---|---|---|
|
plugListSubmissions |
trigger |
GO |
| 5. | Click Save & Close. |
| 6. | Save your module. |
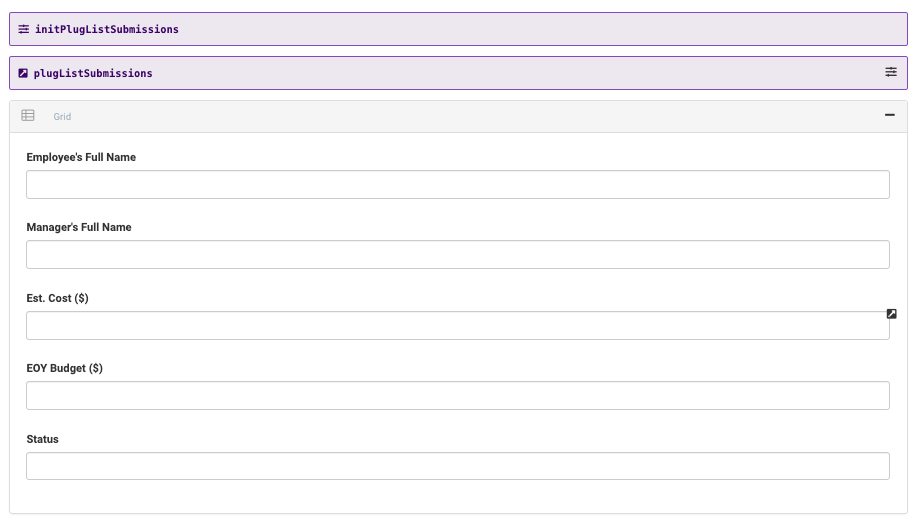
Here's how your completed module looks in the Module Builder:
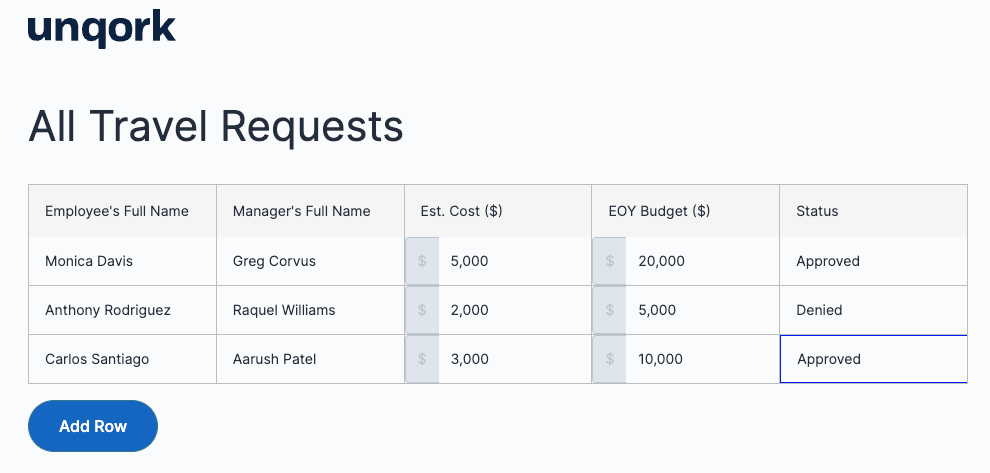
Your module application now imports values from another Unqork application and displays them in a dashboard. Preview your module in Express View. Here's how your module displays with imported submission data: