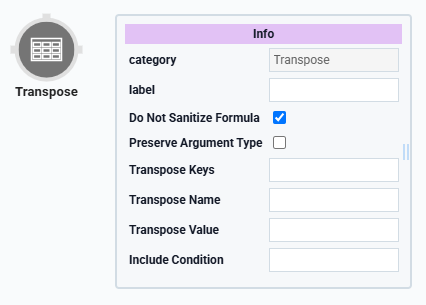
The Transpose operator transposes, or rotates, data from columns to rows in a table. Using this operator, you can also apply filters to the source data to isolate and group specific values in your output.
This operator works by adding two new columns to your data. The first new column is called Key, and it stores your previous column headers as values. The second new column is called Value, and it has the values for each row previously stored in the column you designated in the Transpose Keys setting. You can also set custom names for these columns using the Transpose Name and Transpose Value settings in the operator’s Info window.
Let’s say you have a column with the key of Name. In that column, you have the values Josephine, Art, and Lenna. You can use a Transpose operator to create a new column called Key (or any word of your choice). This new column stores three values: Name, Name, and Name. The operator also creates a new column called Value (or any word of your choice). This new column stores three values: Josephine, Art, and Lenna.
Another example of using this operator is when you have a data table that stores the worth of multiple companies. The Transpose operator converts the headers in your data table into values. These new values have their own header for clearer grouping.
You’ll find the Transpose operator under the Table Operators group to the left of the Data Workflow canvas.
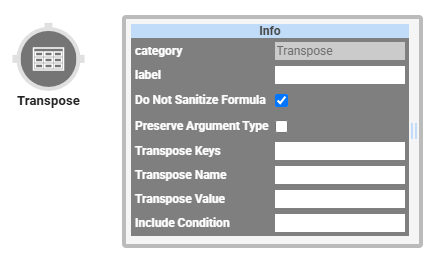
About the Info Window
Here's the breakdown of each setting in the Info window:
Setting | Description |
|---|---|
Category | Grayed out and non-adjustable setting indicating the operation type. |
Label | Sets the label for your operator, displaying below the operator on your Data Workflow canvas. This field is optional, but set a label if you use more than one of the same operator type. A label helps you identify your operators without opening any Info windows. |
Do Not Sanitize Formula | When this checkbox is clear, the operator cleans values coming into or defined in the operator. For example, removing special characters. Some of those special characters include Sanitizing improves performance. But it can also lead to unexpected data behavior. If your Create Field is not behaving as expected, try selecting this box. When selected, the operator uses your values and expressions as-is. This is best when working with complex values or values that should remain unchanged. By default, this setting is selected, which means the operator does not attempt to sanitize. |
Preserve Argument Type | When selected, this setting ensures the argument data type is respected when the operator executes. |
Transpose Keys | The keys (headers) of the columns you want to transpose into values that display as rows in your data. |
Transpose Name | The new key (column header) where your transposed column headers are stored as values. This setting is optional. If left blank, your new key (column header) defaults to |
Transpose Value | The new key (column header) where the values previously held in your transposed columns are stored. This setting is optional. If left blank, your new key (column header) defaults to |
Include Condition | A formula that tells your operator which data to operate on. This setting is optional, and you’ll only use it if you do not want to transpose all data in a key (column). For example, say you’re transposing data in a column with the key of Company, but you only want to transpose data for a certain company in that column. This formula looks like the following: |
Adding a Transpose Operator
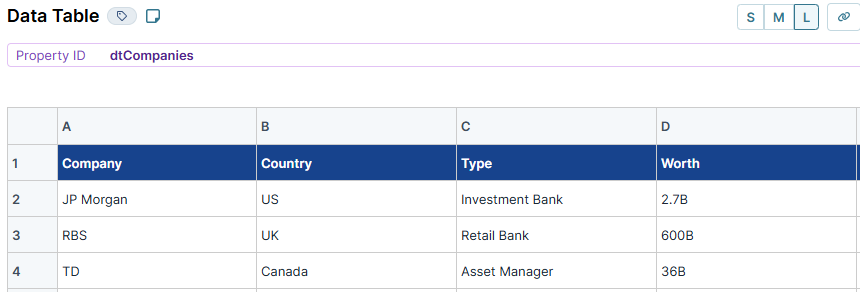
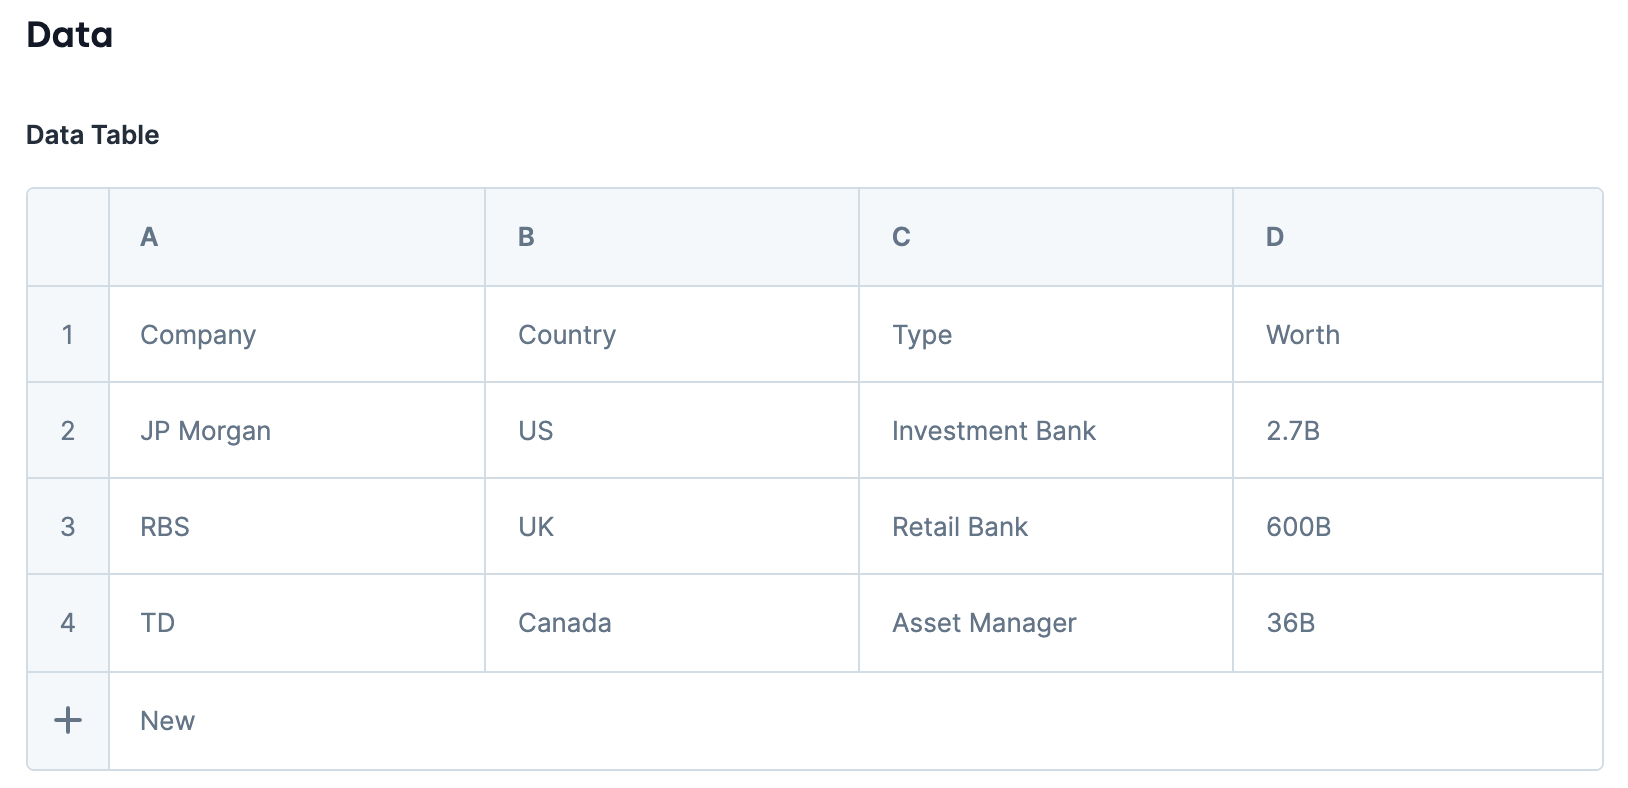
Let's begin by configuring a Data Table component with company data. All columns have headers, which are your keys. The keys are Company, Country, Type, and Worth. Below each of these column headers, you have your values. In this example, let's say you want to rearrange the data so that Company, Type, and Worth are no longer keys but values. You can use the Transpose operator to do this.
These instructions assume you have a module open, saved, and with a title.
Configure the Data Table Component
Let's begin with a 4-column Data Table component that stores your company details.
In the Module Builder, drag and drop a Data Table component onto your canvas.
In the Property ID and Canvas Label Text fields, enter
dtCompanies.In the data table, enter the following:
#
A
B
C
D
1
Company
Country
Type
Worth
2
JP Morgan
US
Investment Bank
2.7B
3
RBS
UK
Retail Bank
600B
4
TD
Canada
Asset Manager
36B
Click Save & Close.
Configure the Data Workflow Component
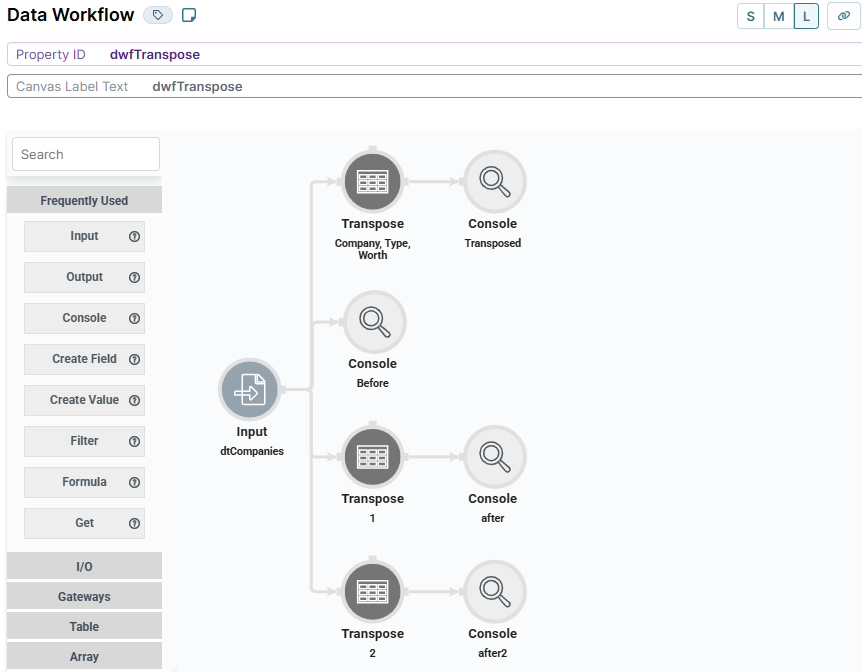
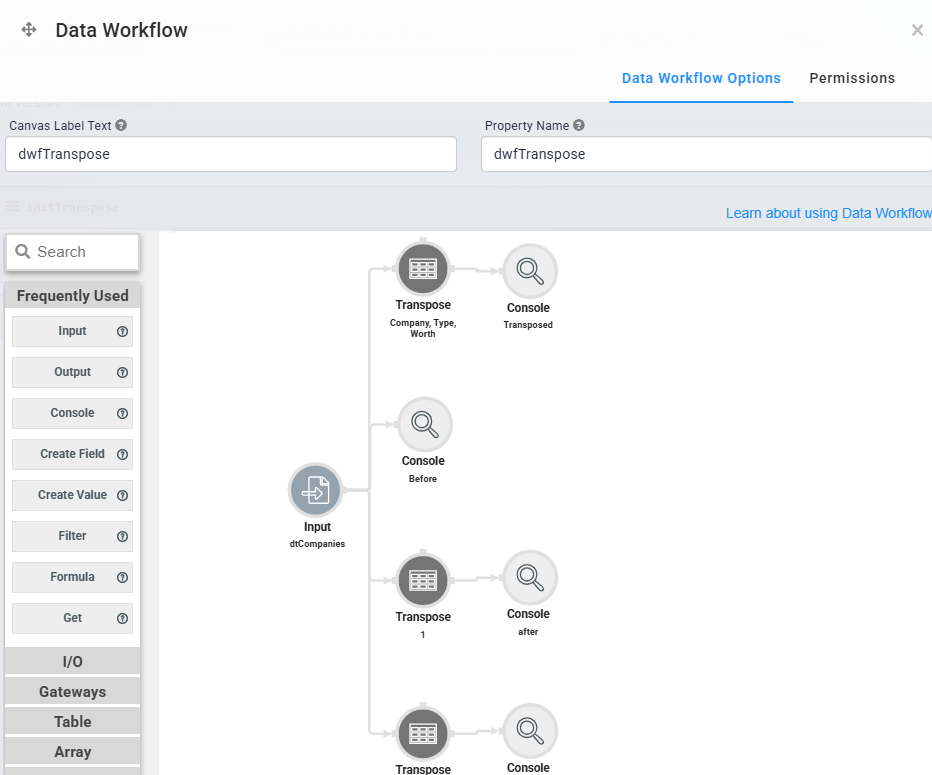
For the Transpose operator to work, you must input the data stored in your table. To bring your data into the Data Workflow, use an Input operator. You will use three Transpose operators to view three different structures. You’ll also configure four Console operators to view how the data looks before and after each Transpose operator.
Drag and drop a Data Workflow component onto your canvas, placing it below your Data Table component.
In the Property ID and Canvas Label Text fields, enter
dwfTranspose.
Configure the Input Operator
This operator references your source data.
Drag and drop an Input operator onto your Data Workflow canvas.
Configure the operator's Info window as follows:
Setting
Value
Category
Input
Component
dtCompanies
Required
Yes
Source
Default
Configure the First Transpose Operator
You want Company, Type, and Worth to be values instead of keys. So, you’ll set these keys in the Transpose Keys field. That way, the key of Country stays the same, but Company, Type, and Worth become row values instead of keys (column names).
Drag and drop a Transpose operator onto your Data Workflow canvas.
Configure the operator's Info window as follows:
Setting
Value
Category
Transpose
Label
Company, Type, Worth
Do Not Sanitize Formula
.png) (checked)
(checked)Preserve Argument Type
.png) (unchecked)
(unchecked)Transpose Keys
Company, Type, Worth
Transpose Name
Classification
Transpose Value
Answer
Include Condition
Connect the output port (right) of the
dtCompaniesInput operator to the input port (left) of theCompany, Type, WorthTranspose operator.
Configure the First Console Operator
A Console operator lets you view how your source data displays in the DevTools Console before passing through the Transpose operator. This operator displays your key/value pairs in their original formatting.
Drag and drop a Console operator onto your Data Workflow canvas.
Configure the operator's Info window as follows:
Setting
Value
Category
Console
Label
Before
Connect the output port (right) of the
dtCompaniesInput operator to the input port (left) of theBeforeConsole operator.
Configure the Second Console Operator
Adding another Console operator lets you confirm the output of your Data Workflow in the DevTools Console. Doing so ensures that your Transpose operator is configured correctly.
Drag and drop a Console operator onto your Data Workflow canvas.
Configure the operator's Info window as follows:
Setting
Value
Category
Console
Label
Transposed
Connect the output port (right) of the
Company, Type, WorthTranspose operator to the input port (left) of theTransposedConsole operator.
Configure the Second Transpose Operator
This Transpose operator restructures data by pivoting values associated with the Country key.
Drag and drop a Transpose operator onto your Data Workflow canvas.
Configure the operator's Info window as follows:
Setting
Value
Category
Transpose
Label
1
Do Not Sanitize Formula
.png) (checked)
(checked)Preserve Argument Type
.png) (unchecked)
(unchecked)Transpose Keys
Country
Transpose Name
countryname
Transpose Value
answer
Include Condition
Connect the output port (right) of the
dtCompaniesInput operator to the input port (left) of the1Transpose operator.
Configure the Third Console Operator
Adding another Console operator lets you confirm the output of your Data Workflow in the DevTools Console. Doing so ensures that your Transpose operator is configured correctly.
Drag and drop a Console operator onto your Data Workflow canvas.
Configure the operator's Info window as follows:
Setting
Value
Category
Console
Label
after
Connect the output port (right) of the
1Transpose operator to the input port (left) of theafterConsole operator.
Configure the Third Transpose Operator
This Transpose operator restructures data by pivoting, namely Country, Company, Type, and Worth.
Drag and drop a Transpose operator onto your Data Workflow canvas.
Configure the operator's Info window as follows:
Setting
Value
Category
Transpose
Label
2
Do Not Sanitize Formula
.png) (checked)
(checked)Preserve Argument Type
.png) (unchecked)
(unchecked)Transpose Keys
Country, Company, Type, Worth
Transpose Name
Transpose Value
Include Condition
Connect the output port (right) of the
dtCompaniesInput operator to the input port (left) of the2Transpose operator.
Configure the Third Console Operator
Adding another Console operator lets you confirm the output of your Data Workflow in the DevTools Console. Doing so ensures that your Transpose operator is configured correctly.
Drag and drop a Console operator onto your Data Workflow canvas.
Configure the operator's Info window as follows:
Setting
Value
Category
Console
Label
after2
Connect the output port (right) of the
2Transpose operator to the input port (left) of theafter2Console operator.
The image below is how your completed Data Workflow looks:
Configure the Initializer Component
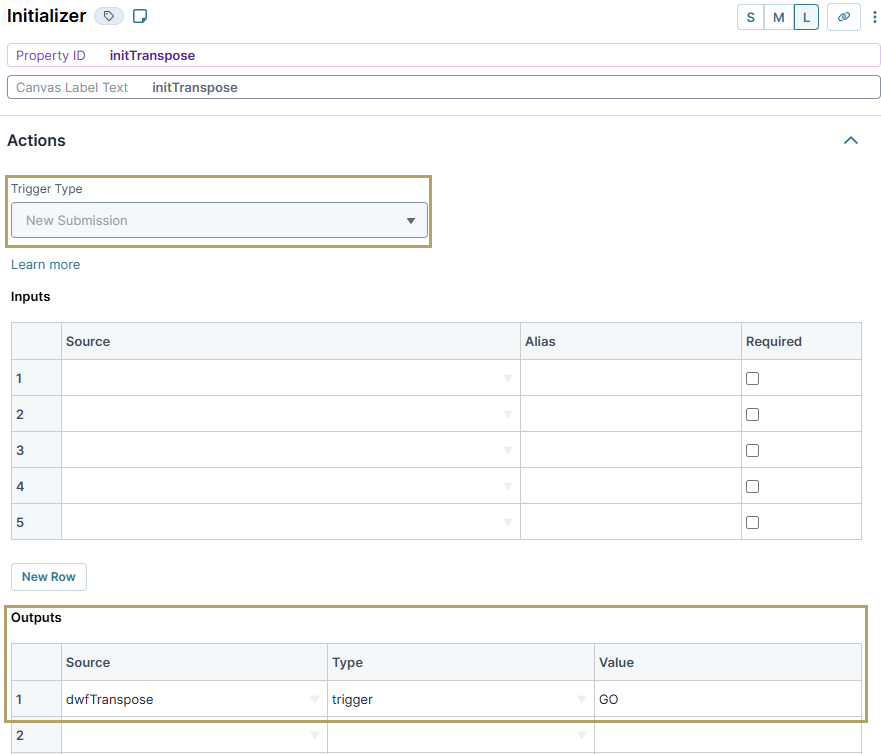
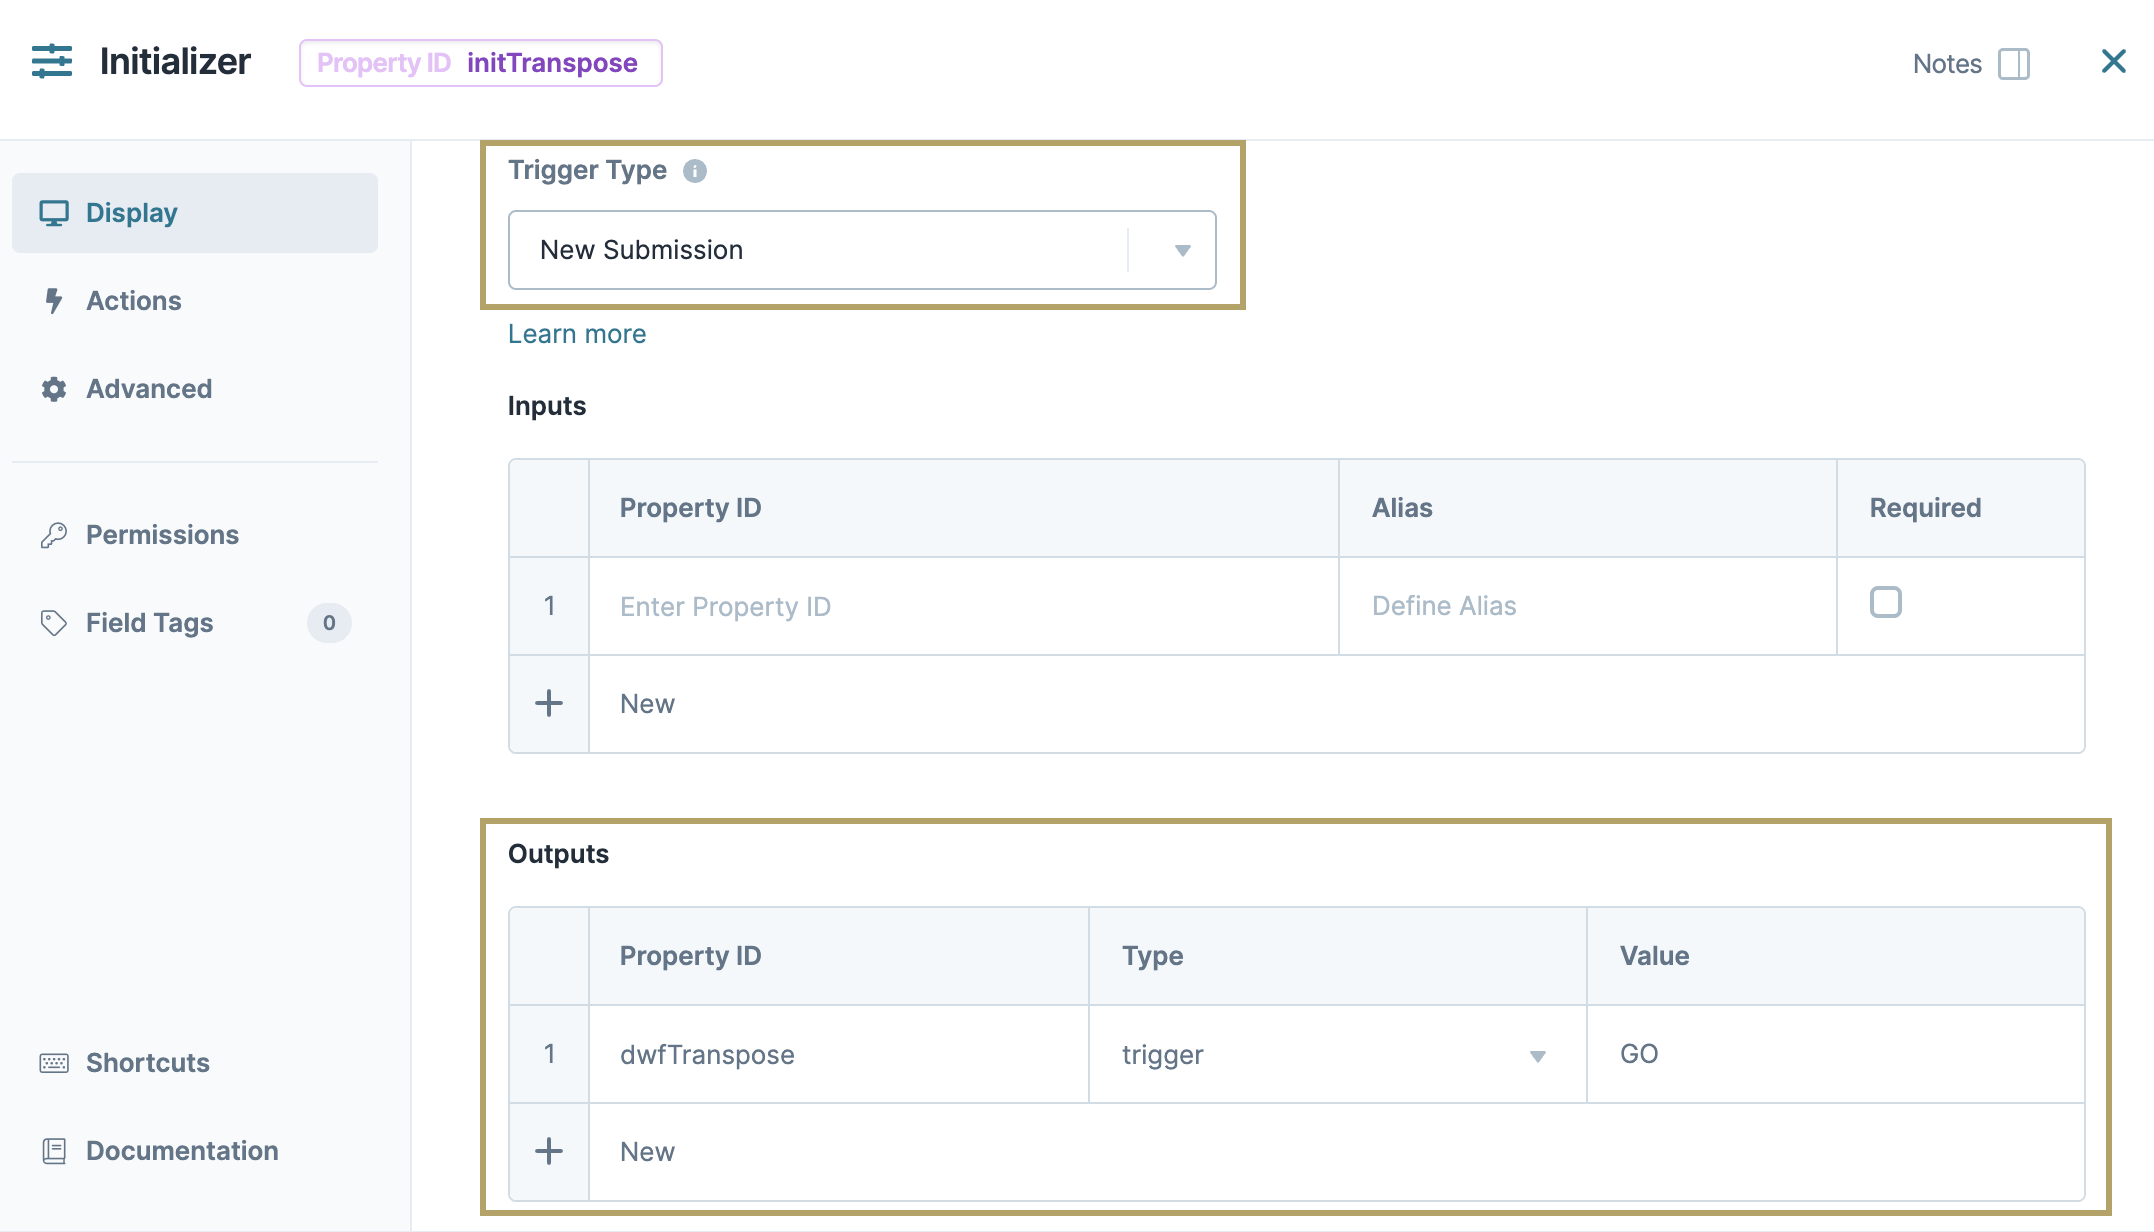
Lastly, add an Initializer component to trigger your Data Workflow. Set this Initializer component to run your Data Workflow every time you open your application.
Drag and drop an Initializer component onto your canvas, placing it above the
dtCompaniesData Table component.In the Property ID and Canvas Label Text fields, enter
initTranspose.Set the Trigger Type as New Submission.
In the Outputs table, enter the following:
#
Property ID
Type
Value
1
dwfTranspose
trigger
GO
Click Save & Close.
Save your module.
Here's how the completed example looks in the Module Builder:

This example works behind the scenes, so you won't see anything in Express View. Instead, here's a look at the DevTools Console:

In the Before Console arrays, you can see how the data looked originally:
.png)
In the Transposed Console arrays, you can see the transposed data arrays, now displayed in rows:
.png)
In the after Console arrays, you can see the transposed data arrays, now displayed in rows:
.png)
In the after2 Console arrays, you can see the transposed data arrays, now displayed in rows:

The Transpose operator transposes, or rotates, data from columns to rows in a table. Using this operator, you can also apply filters to the source data to isolate and group specific values in your output.
This operator works by adding two new columns to your data. The first new column is called Key, and it stores your previous column headers as values. The second new column is called Value, and it has the values for each row previously stored in the column you designated in the Transpose Keys setting. You can also set custom names for these columns using the Transpose Name and Transpose Value settings in the operator’s Info window.
Let’s say you have a column with the key of Name. In that column, you have the values Josephine, Art, and Lenna. You can use a Transpose operator to create a new column called Key (or any word of your choice). This new column stores three values: Name, Name, and Name. The operator also creates a new column called Value (or any word of your choice). This new column stores three values: Josephine, Art, and Lenna.
Another example of using this operator is when you have a data table that stores the worth of multiple companies. The Transpose operator converts the headers in your data table into values. These new values have their own header for clearer grouping.
You’ll find the Transpose operator under the Table Operators group to the left of the Data Workflow canvas.
About the Info Window
Here's the breakdown of each setting in the Info window:
Setting | Description |
|---|---|
Category | Grayed out and non-adjustable setting indicating the operation type. |
Label | Sets the label for your operator, displaying below the operator on your Data Workflow canvas. This field is optional, but set a label if you use more than one of the same operator type. A label helps you identify your operators without opening any Info windows. |
Do Not Sanitize Formula | When this checkbox is clear, the operator cleans values coming into or defined in the operator. For example, removing special characters. Some of those special characters include Sanitizing improves performance. But it can also lead to unexpected data behavior. If your Create Field is not behaving as expected, try selecting this box. When selected, the operator uses your values and expressions as-is. This is best when working with complex values or values that should remain unchanged. By default, this setting is selected, which means the operator does not attempt to sanitize. |
Preserve Argument Type | When selected, this setting ensures the argument data type is respected when the operator executes. |
Transpose Keys | The keys (headers) of the columns you want to transpose into values that display as rows in your data. |
Transpose Name | The new key (column header) where your transposed column headers are stored as values. This setting is optional. If left blank, your new key (column header) defaults to |
Transpose Value | The new key (column header) where the values previously held in your transposed columns are stored. This setting is optional. If left blank, your new key (column header) defaults to |
Include Condition | A formula that tells your operator which data to operate on. This setting is optional, and you’ll only use it if you do not want to transpose all data in a key (column). For example, say you’re transposing data in a column with the key of Company, but you only want to transpose data for a certain company in that column. This formula looks like the following: |
Adding a Transpose Operator
Let's begin by configuring a Data Table component with company data. All columns have headers, which are your keys. The keys are Company, Country, Type, and Worth. Below each of these column headers, you have your values. In this example, let's say you want to rearrange the data so that Company, Type, and Worth are no longer keys but values. You can use the Transpose operator to do this.
These instructions assume you have a module open, saved, and with a title.
Configure the Data Table Component
Let's begin with a four-column Data Table component to store your company details.
Drag and drop a Data Table component onto your canvas.
In the Property ID and Canvas Label Text fields, enter
dtCompanies.In the data table, enter the following:
#
A
B
C
D
1
Company
Country
Type
Worth
2
JP Morgan
US
Investment Bank
2.7B
3
RBS
UK
Retail Bank
600B
4
TD
Canada
Asset Manager
36B
Click Save & Close.
Configure the Data Workflow Component
For the Transpose operator to work, you must input the data stored in your table. To bring your data into the Data Workflow, use an Input operator. You will use three Transpose operators to view three different structures. You’ll also configure four Console operators to view how the data looks before and after each Transpose operator.
Drag and drop a Data Workflow component onto your canvas, placing it below your Data Table component.
In the Canvas Label Text and Property Name fields, enter
dwfTranspose.
Configure the Input Operator
This operator references your source data.
Drag and drop an Input operator onto your Data Workflow canvas.
Configure the operator's Info window as follows:
Setting
Value
Category
Input
Component
dtCompanies
Required
Yes
Source
Default
Configure the First Transpose Operator
You want Company, Type, and Worth to be values instead of keys. So, you’ll set these keys in the Transpose Keys field. That way, the key of Country stays the same, but Company, Type, and Worth become row values instead of keys (column names).
Drag and drop a Transpose operator onto your Data Workflow canvas.
Configure the operator's Info window as follows:
Setting
Value
Category
Transpose
Label
Company, Type, Worth
Do Not Sanitize Formula
Checked (yes)
Preserve Argument Type
Unchecked (no)
Transpose Keys
Company, Type, Worth
Transpose Name
Classification
Transpose Value
Answer
Include Condition
Connect the output port (right) of the
dtCompaniesInput operator to the input port (left) of theCompany, Type, WorthTranspose operator.
Configure the First Console Operator
A Console operator lets you view how your source data appears in the DevTools Console before it passes through the Transpose operator. This operator displays your key/value pairs in their original formatting.
Drag and drop a Console operator onto your Data Workflow canvas.
Configure the operator's Info window as follows:
Setting
Value
Category
Console
Label
Before
Connect the output port (right) of the
dtCompaniesInput operator to the input port (left) of theBeforeConsole operator.
Configure the Second Console Operator
Adding another Console operator lets you confirm the output of your Data Workflow in the DevTools Console. Doing so ensures that your Transpose operator is configured correctly.
Drag and drop a Console operator onto your Data Workflow canvas.
Configure the operator's Info window as follows:
Setting
Value
Category
Console
Label
Transposed
Connect the output port (right) of the
Company, Type, WorthTranspose operator to the input port (left) of theTransposedConsole operator.
Configure the Second Transpose Operator
This Transpose operator restructures data by pivoting values associated with the Country key.
Drag and drop a Transpose operator onto your Data Workflow canvas.
Configure the operator's Info window as follows:
Setting
Value
Category
Transpose
Label
1
Do Not Sanitize Formula
Checked (yes)
Preserve Argument Type
Unchecked (no)
Transpose Keys
Country
Transpose Name
countryname
Transpose Value
answer
Include Condition
Connect the output port (right) of the
dtCompaniesInput operator to the input port (left) of the1Transpose operator.
Configure the Third Console Operator
Adding another Console operator lets you confirm the output of your Data Workflow in the DevTools Console. Doing so ensures that your Transpose operator is configured correctly.
Drag and drop a Console operator onto your Data Workflow canvas.
Configure the operator's Info window as follows:
Setting
Value
Category
Console
Label
after
Connect the output port (right) of the
1Transpose operator to the input port (left) of theafterConsole operator.
Configure the Third Transpose Operator
This Transpose operator restructures data by pivoting, namely Country, Company, Type, and Worth.
Drag and drop a Transpose operator onto your Data Workflow canvas.
Configure the operator's Info window as follows:
Setting
Value
Category
Transpose
Label
2
Do Not Sanitize Formula
Checked (yes)
Preserve Argument Type
Unchecked (no)
Transpose Keys
Country, Company, Type, Worth
Transpose Name
Transpose Value
Include Condition
Connect the output port (right) of the
dtCompaniesInput operator to the input port (left) of the2Transpose operator.
Configure the Third Console Operator
Adding another Console operator lets you confirm the output of your Data Workflow in the DevTools Console. Doing so ensures that your Transpose operator is configured correctly.
Drag and drop a Console operator onto your Data Workflow canvas.
Configure the operator's Info window as follows:
Setting
Value
Category
Console
Label
after2
Connect the output port (right) of the
2Transpose operator to the input port (left) of theafter2Console operator.
The image below is how your completed Data Workflow looks:
Configure the Initializer Component
Lastly, add an Initializer component to trigger your Data Workflow. Set this Initializer component to run your Data Workflow every time you open your application.
Drag and drop an Initializer component onto your canvas, placing it above the
dtCompaniesData Table component.In the Property ID and Canvas Label Text fields, enter
initTranspose.Set the Trigger Type as New Submission.
In the Outputs table, enter the following:
#
Property ID
Type
Value
1
dwfTranspose
trigger
GO
Click Save & Close.
Save your module.
Here's how the completed example looks in the Module Builder:

This example works behind the scenes, so you won't see anything in Express View. Instead, here's a look at the DevTools Console:

In the Before Console arrays, you can see how the data looked originally:
.png)
In the Transposed Console arrays, you can see the transposed data arrays, now displayed in rows:
.png)
In the after Console arrays, you can see the transposed data arrays, now displayed in rows:
.png)
In the after2 Console arrays, you can see the transposed data arrays, now displayed in rows:
