There are many ways to use the Create Index operator. You can use it to add new rows of information to an existing data table. Or, you can use it to filter out a specific row of data.
Let's say you have a table of patient names, birthdays, and insurance statuses. But you are only interested in looking at one patient's information at a time. You can use the Create Index operator to assign a number to each row and filter by that number.
Configuration
In this how-to guide, you’ll configure a Create Index operator to assign a number to each row of a table and filter by it.
Configure the Data Table Component
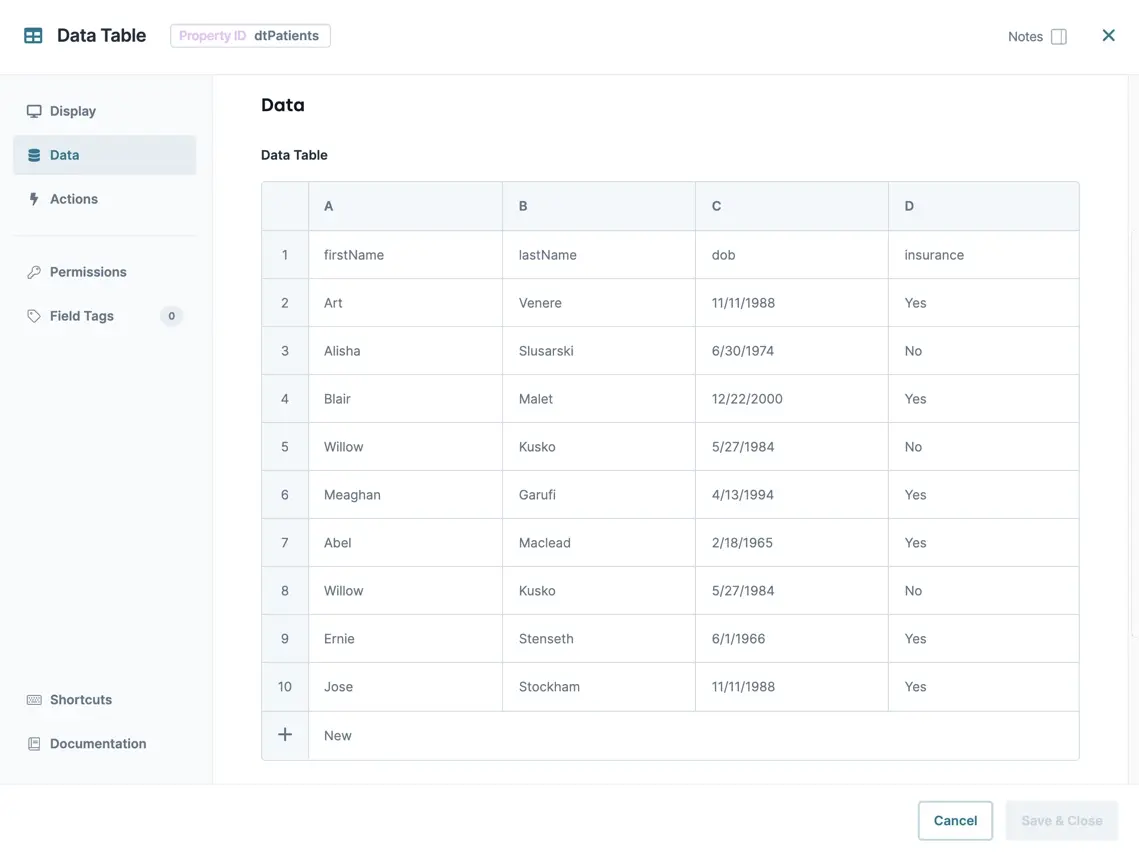
First, you'll set up a Data Table component with a list of patient names, dates of birth, and their insurance status.
In the Module Builder, drag and drop a Data Table component onto your canvas.
In the Property ID field, enter
dtPatients.In the data table, enter the following:
firstName
lastName
dob
insurance
Art
Venere
11/11/1988
Yes
Alisha
Slusarski
6/30/1974
No
Blair
Malet
12/22/2000
Yes
Willow
Kusko
5/27/1984
No
Meaghan
Garufi
4/13/1994
Yes
Abel
Maclead
2/18/1965
Yes
Willow
Kusko
5/27/1984
No
Ernie
Stenseth
6/1/1966
Yes
Jose
Stockham
11/11/1988
Yes
You've intentionally added duplicate information for other Create Index use cases.
.png)
Click Save Component.
Configure the Initializer Component
Now, you'll set up an Initializer component to trigger the Data Workflow you’ll configure in a later step.
Drag and drop an Initializer component onto your canvas, placing it below your Data Table component.
In the Property ID and Canvas Label Text fields, enter
initPatients.From the Trigger Type drop-down, select New Submission.
In the Outputs table, enter the following:
Property ID
Type
Value
dwfPatients
trigger
GO
Click Save Component.
Configure the ViewGrid Component
Next, add a ViewGrid component so your end-user can see the patient information.
Drag and drop a ViewGrid component onto the canvas, placing it below your Data Table component.
In the Property ID field, enter
gridPatients.In the Canvas Label Text field, enter
Patients.In the Source column of the Inputs and Outputs tables, enter
dtPatients.In the Display table, enter the following:
ID
Formula
Heading
index
Chart Number
firstName
First Name
lastName
Last Name
dob
Date of Birth
insurance
Insurance?
In the Action field, enter
null.Click Save Component.
Configure the Data Workflow Component
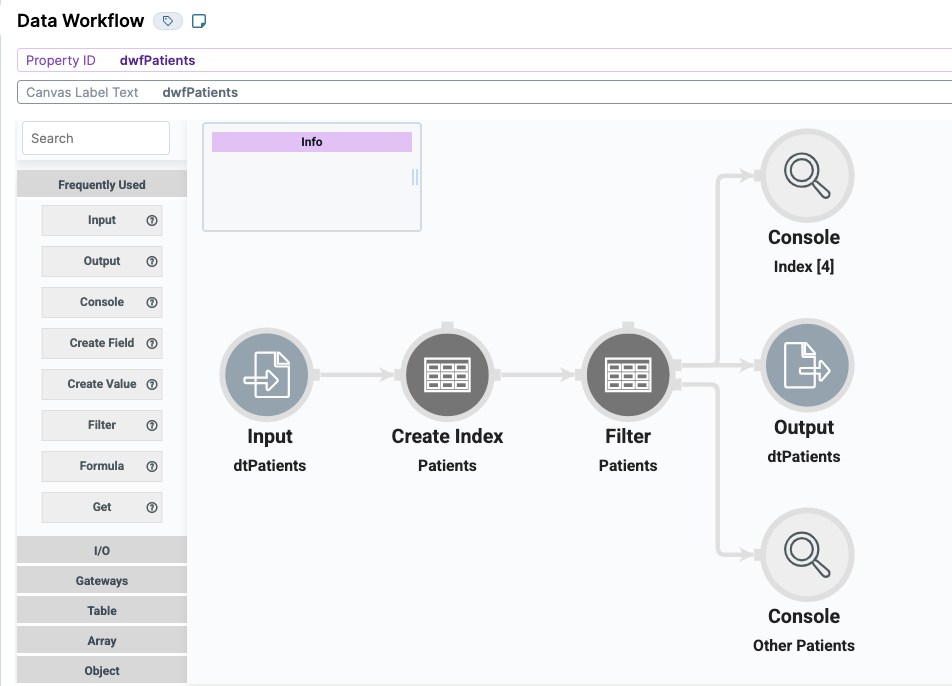
Now, you'll set up your Data Workflow. You'll configure your Create Index operator to assign a chart number to each patient. You'll configure the operator to number each row starting with [1]. After that, you'll set up a Filter operator to filter for a specific chart number and output it to your ViewGrid component. For this example, you'll configure the Data Workflow to filter chart number [4]. You'll also add a couple of Console operators to see the results of the Filter operator.
Drag and drop a Data Workflow component onto your canvas, placing it below your ViewGrid component.
In the Property ID and Canvas Label Text fields, enter
dwfPatients.
Configure the First Input Operator
Drag and drop an Input operator onto your Data Workflow canvas.
Configure the operator's Info window as follows:
Setting
Value
Category
Input
Component
dtPatients
Required
No
Source
Default
Configure the Create Index Operator
Drag and drop a Create Index operator onto your Data Workflow canvas.
Configure the operator's Info window as follows:
Setting
Value
Category
Create Index
Label
Patients
Index Name
index
Starting Index
1
Keys
Connect the output port (right) of the Input operator to the input port (left) of the Create Index operator.
Configure the Filter Operator
Drag and drop a Filter operator onto your Data Workflow canvas.
Configure the operator's Info window as follows:
Setting
Value
Category
Filter
Label
Patients
Do Not Sanitize Formula
.png) (checked)
(checked)Expression
index=4
Connect the output port (right) of the Create Index operator to the input port (left) of the Filter operator.
Configure the Output Operator
Drag and drop an Output operator onto your Data Workflow canvas.
Configure the operator's Info window as follows:
Setting
Value
Category
Output
Component
dtPatients
Action
value
Connect the upper output port (right) of the Filter operator to the input port (left) of the Output operator.
Configure the First Console Operator
Drag and drop a Console operator onto your Data Workflow canvas.
Configure the operator's Info window as follows:
Setting
Value
Category
Console
Label
Index [4]
Connect the upper output port (right) of the Filter operator to the input port (left) of the Console operator.
Configure the Second Console Operator
Drag and drop another Console operator onto your Data Workflow canvas.
Configure the operator's Info window as follows:
Setting
Value
Category
Console
Label
Other Patients
Connect the lower output port (right) of the Filter operator to the input port (left) of the Console operator.

Click Save Component.
Save the module.
Here’s how your module looks in the Module Builder:

Here's how the completed example looks in Express View, including a peek at the DevTools Console:

There are many ways to use the Create Index operator. You can use it to add new rows of information to an existing data table. Or, you can use it to filter out a specific row of data.
Let's say you have a table of patient names, birthdays, and insurance statuses. But you are only interested in looking at one patient's information at a time. You can use the Create Index operator to assign a number to each row and filter by that number.
Configuration
In this how-to guide, you’ll configure a Create Index operator to assign a number to each row of a table and filter by it.
Configure the Data Table Component
First, you'll set up a Data Table component with a list of patient names, dates of birth, and their insurance status.
In the Module Builder, drag and drop a Data Table component onto your canvas.
In the Property ID and Canvas Label Text fields, enter
dtPatients.In the data table, enter the following:
firstName
lastName
dob
insurance
Art
Venere
11/11/1988
Yes
Alisha
Slusarski
6/30/1974
No
Blair
Malet
12/22/2000
Yes
Willow
Kusko
5/27/1984
No
Meaghan
Garufi
4/13/1994
Yes
Abel
Maclead
2/18/1965
Yes
Willow
Kusko
5/27/1984
No
Ernie
Stenseth
6/1/1966
Yes
Jose
Stockham
11/11/1988
Yes
You've intentionally added duplicate information for other Create Index use cases.

Click Save & Close.
Configure the Initializer Component
Now, you'll set up an Initializer component to trigger the Data Workflow you’ll configure in a later step.
Drag and drop an Initializer component onto your canvas, placing it below your Data Table component.
In the Property ID and Canvas Label Text fields, enter
initPatients.Set the Trigger Type as New Submission.
In the Outputs table, enter the following:
Property ID
Type
Value
dwfPatients
trigger
GO
Click Save & Close.
Configure the ViewGrid Component
Next, add a ViewGrid component so your end-user can see the patient information.
Drag and drop a ViewGrid component onto the canvas, placing it below your Data Table component.
In the Label field, enter
Patients.In the Property Name field, enter
gridPatients.In the Action field, enter
null.In the id column of the Inputs and Outputs tables, enter
dtPatients.In the Display table, enter the following:
id
formula
heading
index
Chart Number
firstName
First Name
lastName
Last Name
dob
Date of Birth
insurance
Insurance?
Click Save.
Configure the Data Workflow Component
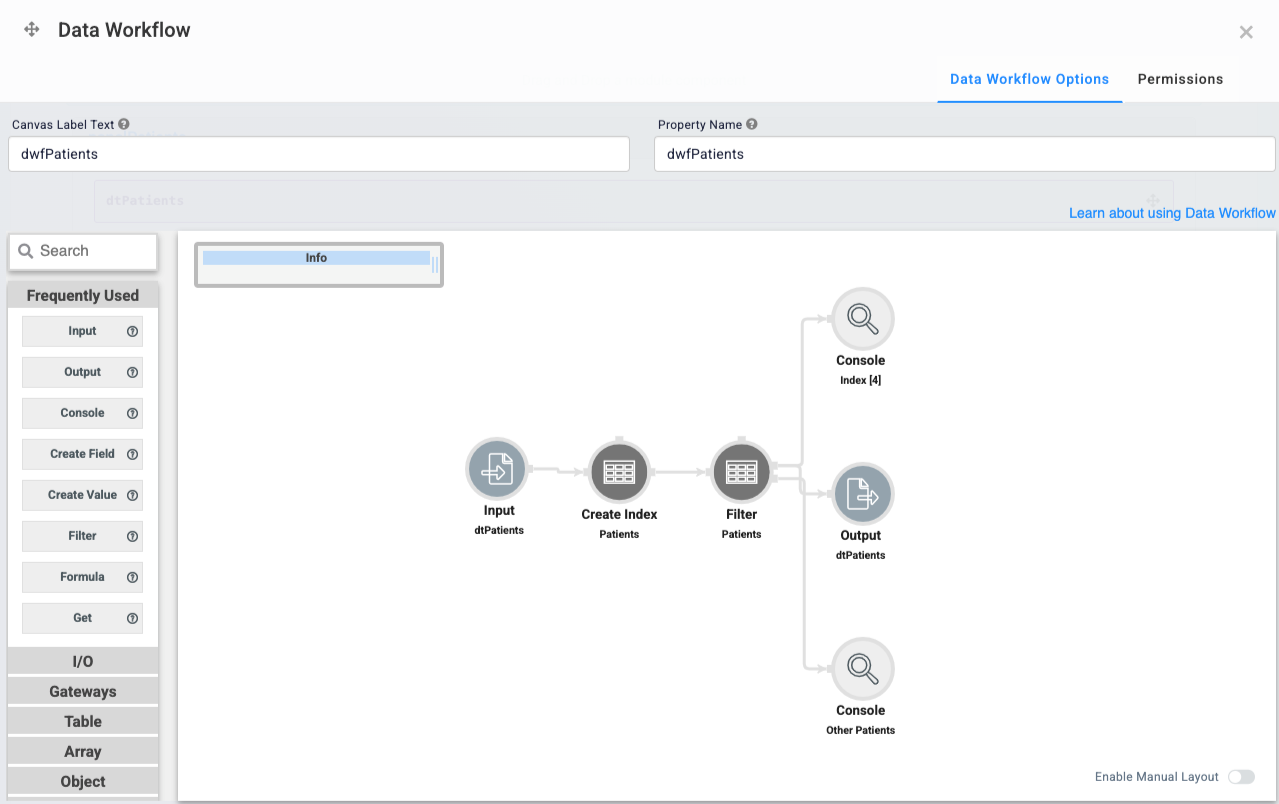
Now, you'll set up your Data Workflow. You'll configure your Create Index operator to assign a chart number to each patient. You'll configure the operator to number each row starting with [1]. After that, you'll set up a Filter operator to filter a specific chart number and output it onto your dashboard. You can filter any index of your choosing. For this example, you'll configure the Data Workflow to filter chart number [4]. You'll also add a couple of Console operators to see the results of the Filter operator.
Drag and drop a Data Workflow component onto your canvas, placing it below your ViewGrid component.
In the Canvas Label Text and Property Name fields, enter
dwfPatients.
Configure the First Input Operator
Drag and drop an Input operator onto your Data Workflow canvas.
Configure the operator's Info window as follows:
Setting
Value
Category
Input
Component
dtPatients
Required
No
Source
Default
Configure the Create Index Operator
Drag and drop a Create Index operator onto your Data Workflow canvas.
Configure the operator's Info window as follows:
Setting
Value
Category
Create Index
Label
Patients
Index Name
index
Starting Index
1
Keys
Connect the output port (right) of the Input operator to the input port (left) of the Create Index operator.
Configure the Filter Operator
Drag and drop a Filter operator onto your Data Workflow canvas.
Configure the operator's Info window as follows:
Setting
Value
Category
Filter
Label
Patients
Do Not Sanitize Formula
.png) (checked)
(checked)Expression
index=4
Connect the output port (right) of the Create Index operator to the input port (left) of the Filter operator.
Configure the Output Operator
Drag and drop an Output operator onto your Data Workflow canvas.
Configure the operator's Info window as follows:
Setting
Value
Category
Output
Component
dtPatients
Action
value
Connect the upper output port (right) of the Filter operator to the input port (left) of the Output operator.
Configure the First Console Operator
Drag and drop a Console operator onto your Data Workflow canvas.
Configure the operator's Info window as follows:
Setting
Value
Category
Console
Label
Index [4]
Connect the upper output port (right) of the Filter operator to the input port (left) of the Console operator.
Configure the Second Console Operator
Drag and drop another Console operator onto your Data Workflow canvas.
Configure the operator's Info window as follows:
Setting
Value
Category
Console
Label
Other Patients
Connect the lower output port (right) of the Filter operator to the input port (left) of the Console operator.

Click Save.
Save your module.
Here's how your module looks in the Module Builder:

Here's how the completed example looks in Express View, including a peek at the DevTools Console:
