Real-Time Configuration Analysis Tool
Estimated Reading Time: 4 minutes
WARNING How well the Real-Time Configuration Analysis tool performs is dependent to the size of your module. If your module is greater than 8 MB, use the ULDC Config Analysis Dashboard tool to submit an analysis request. To view your module size, click the ellipsis (...) at the top of the Module Builder. Then, click Settings.
Overview
The Real-Time Configuration Analysis tool provides dynamic, real-time feedback about your module's configuration. Real-Time Configuration Analysis does this by running component tests on a module every time it is saved, or after editing a component. Each of these tests analyzes a different configuration issue, and then reports it in the module outline section of the Module Builder.
Real-Time Configuration Analysis saves Creators time by informing them if their component configurations might cause issues, and offers advice on how to resolve said issues.
Real-Time Configuration Analysis helps in the following ways:
-
Runs component tests on a module's configuration every time the module is saved.
-
Categorizes issues by priority and displays them on the module outline.
-
Explains what the issue is and what areas of the application it might affect.
-
Provides recommendations on how to resolve issues.
What You'll Learn
In this article, you’ll learn how to:
- View component Real-Time Configuration Analysis in the Module Outline.
- Search for components by issue severity.
- Access and understand warning message details.
- Resolve component severity issues.
Viewing Component Real-Time Configuration Analysis in the Module Outline
Real-Time Configuration Analysis is built into the module outline portion of the Module Builder. Real-Time Configuration Analysis works within the module outline to highlight components at risk of causing issues, and provides feedback on how to resolve them.
TIP To learn more about the Module Outline, visit our Module Outline article.
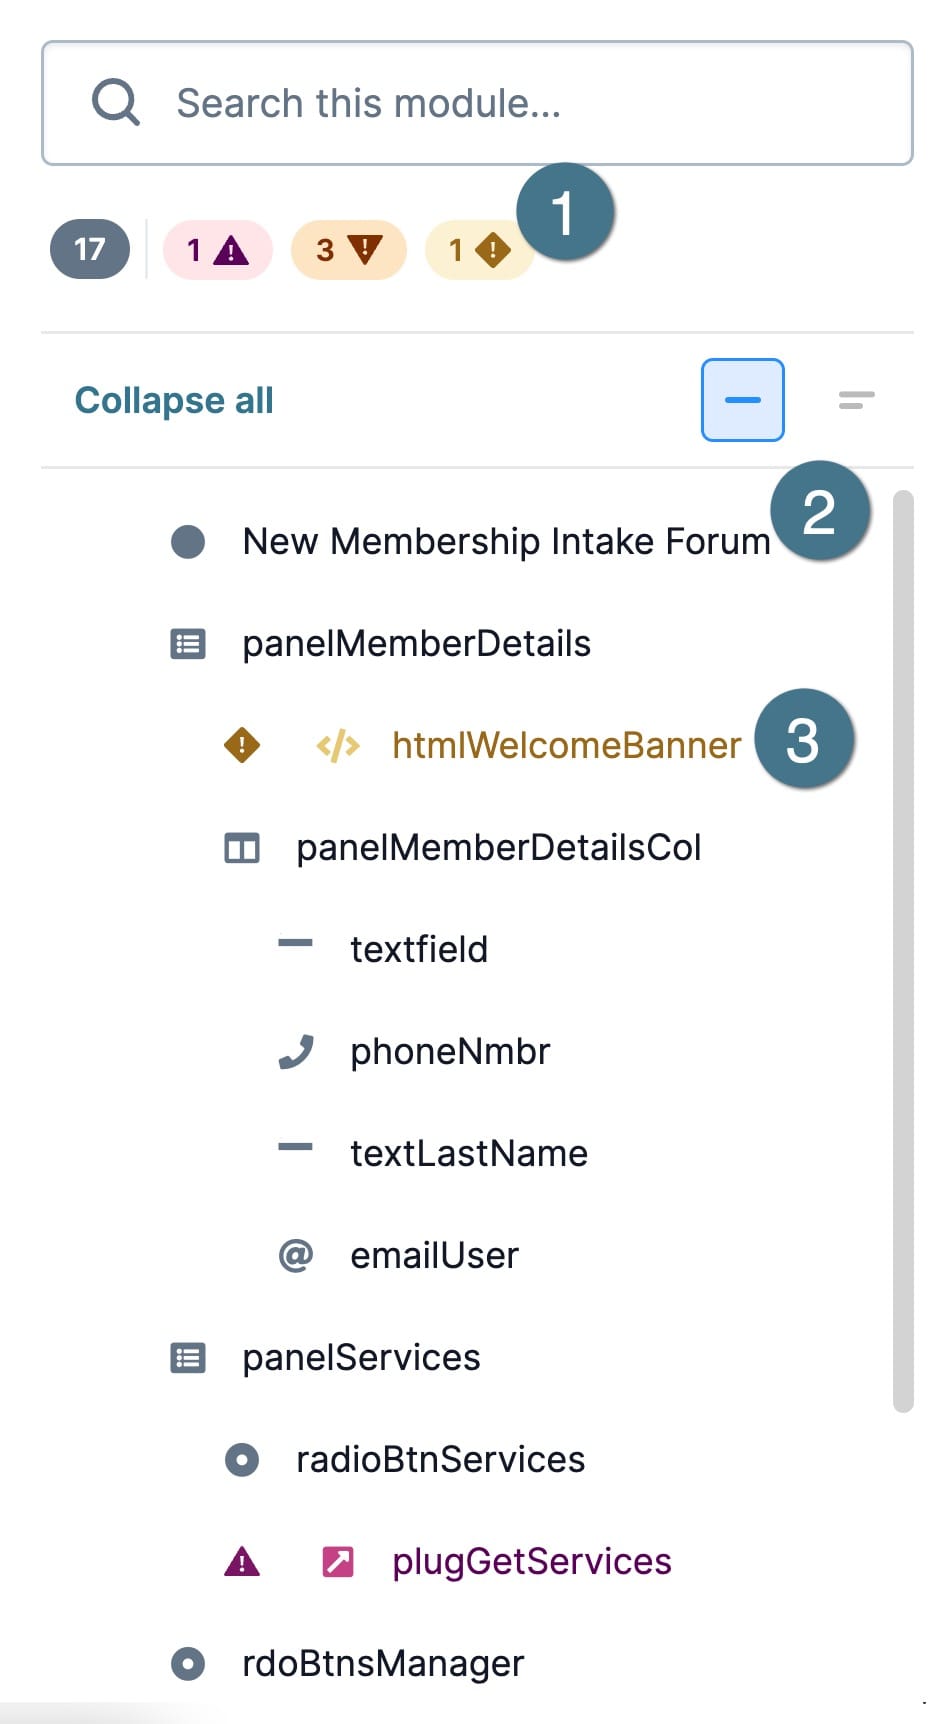
Real-Time Configuration Analysis adds the following features to the module outline:
|
# |
Setting |
Description |
|---|---|---|
|
1 |
Component Severity Filters |
Select one or multiple severity levels to limit the outline search to components with the chosen level(s) of severity. The value in each severity filter indicates how many components are affected. The levels of severity are:
|
|
2 |
Module Status |
The highest level in the module outline. All components are placed underneath the Module Status level. |
|
3 |
Affected Component(s) |
Affected components are highlighted by a warning icon and color severity. Click the warning icon to open the warning message panel. |
 )
)  )
) )
) )
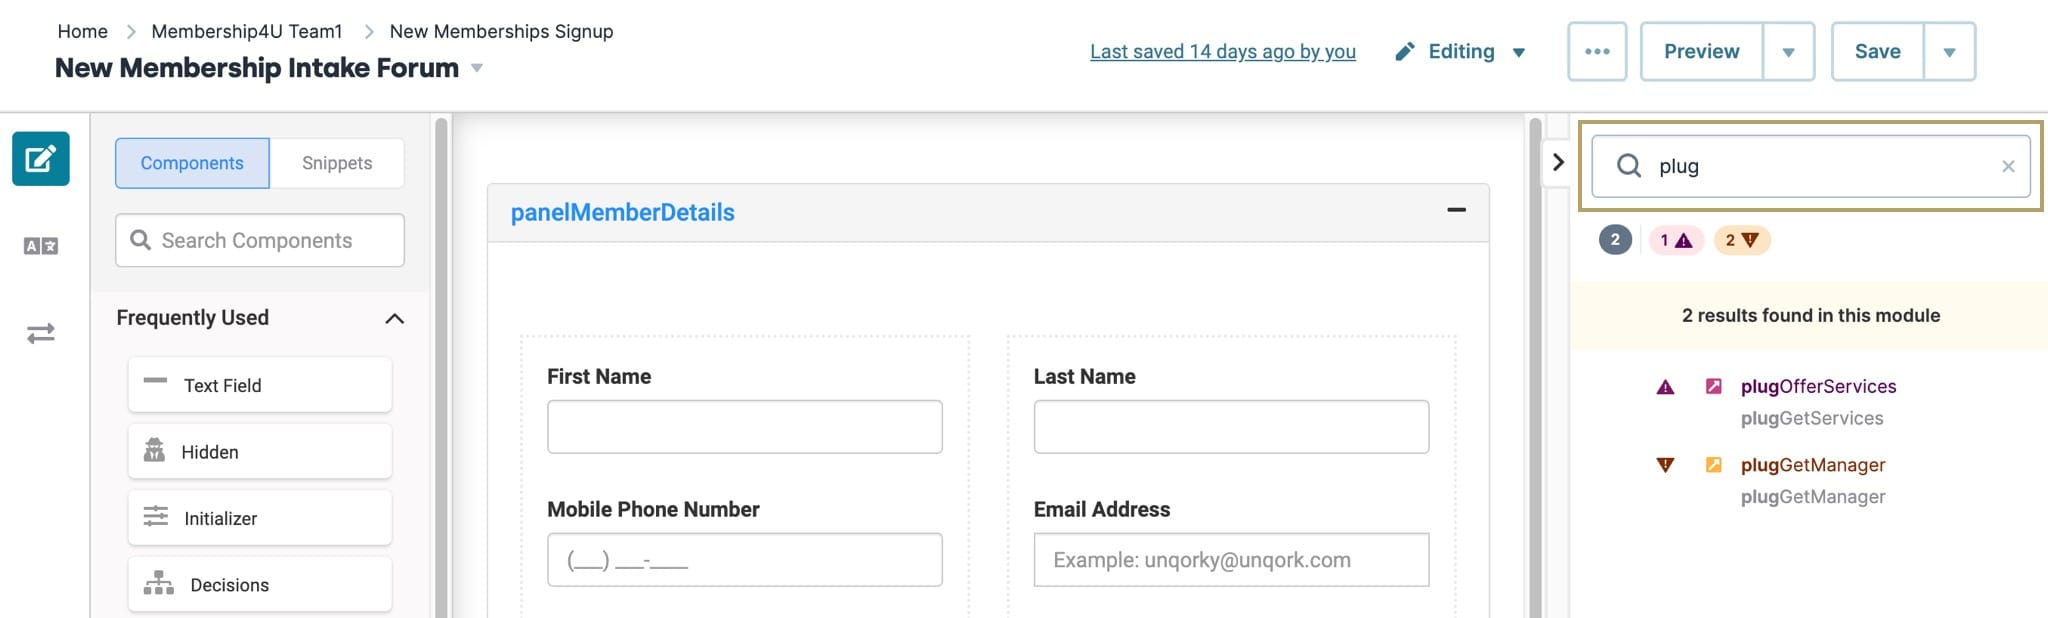
)Searching for Components by Severity
Use the Module Outline to filter for components by severity level and by component Property ID or Label Text values.
To filter components using the severity filters:
| 1. | In the Module Builder, save your work. Saving a module performs an analysis of its component configurations. |
| 2. | In the Module Outline, select one or multiple severity filters. The selected filter(s) changes color and the Module Outline filters all components that have the selected severity. |
NOTE If no severity filters exist, there might still be errors present the configuration analysis tool i sn't scanning for.
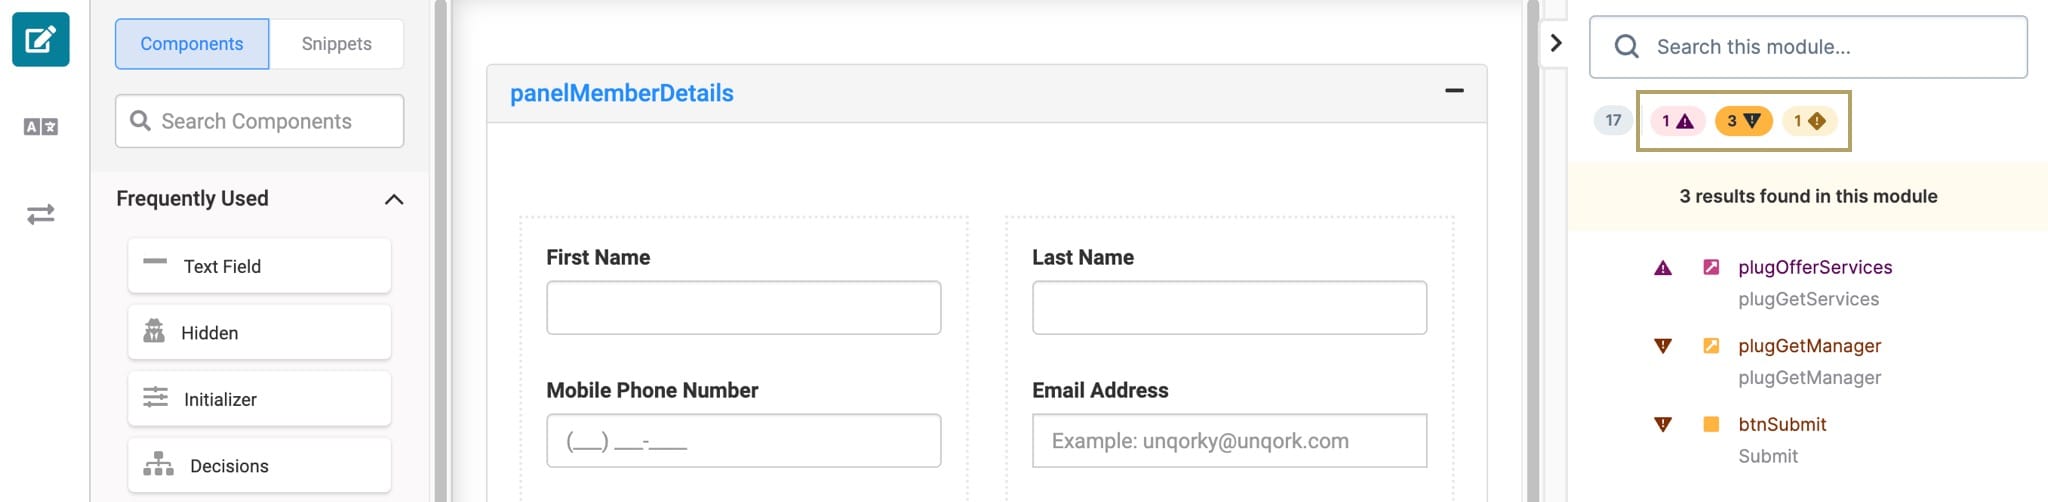
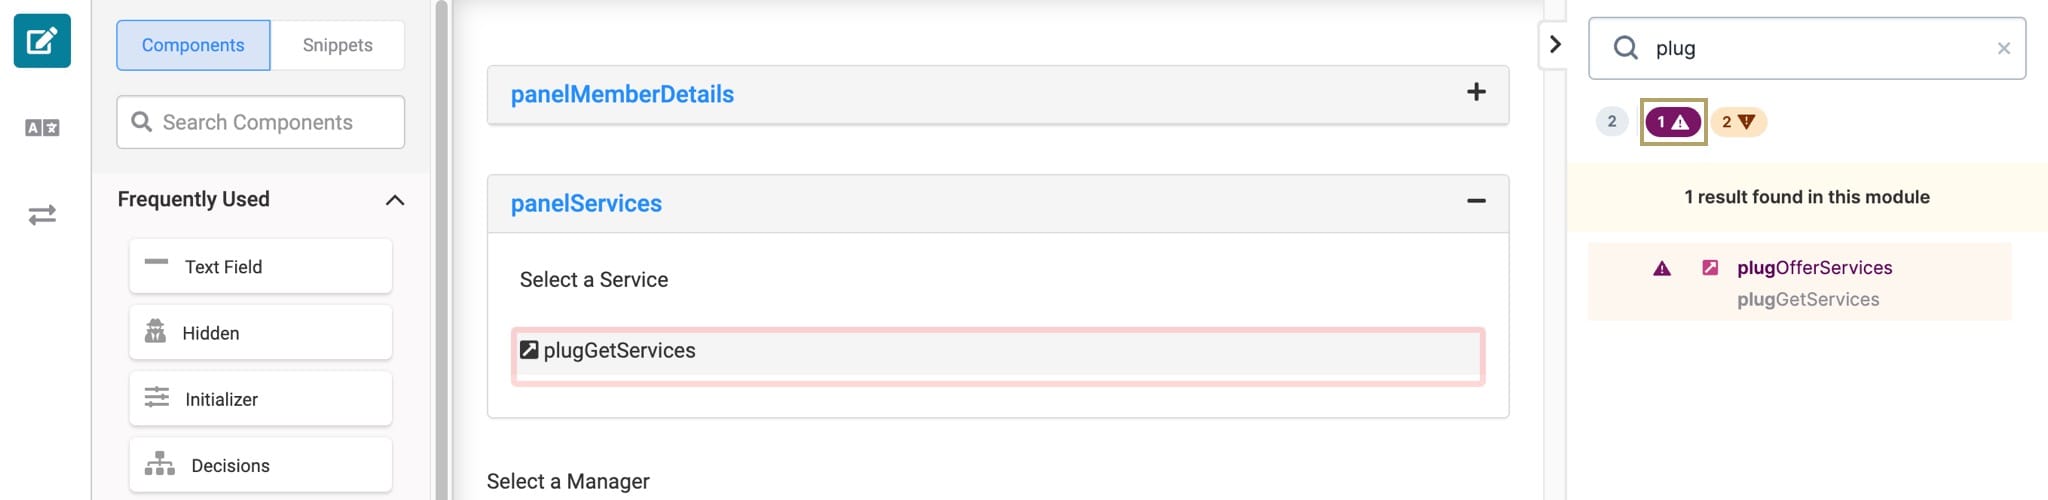
To filter components using the search field and severity filters:
| 1. | In the Module Builder, save your work. Saving a module performs an analysis of your component configurations. |
| 2. | In the Module Outline Search field, enter all or a part of the component Property ID or Label Text values. All matching component results display in the outline. |
| 3. | Select one or multiple severity filters to reduce results to components that match the search field value and the severity filter. |
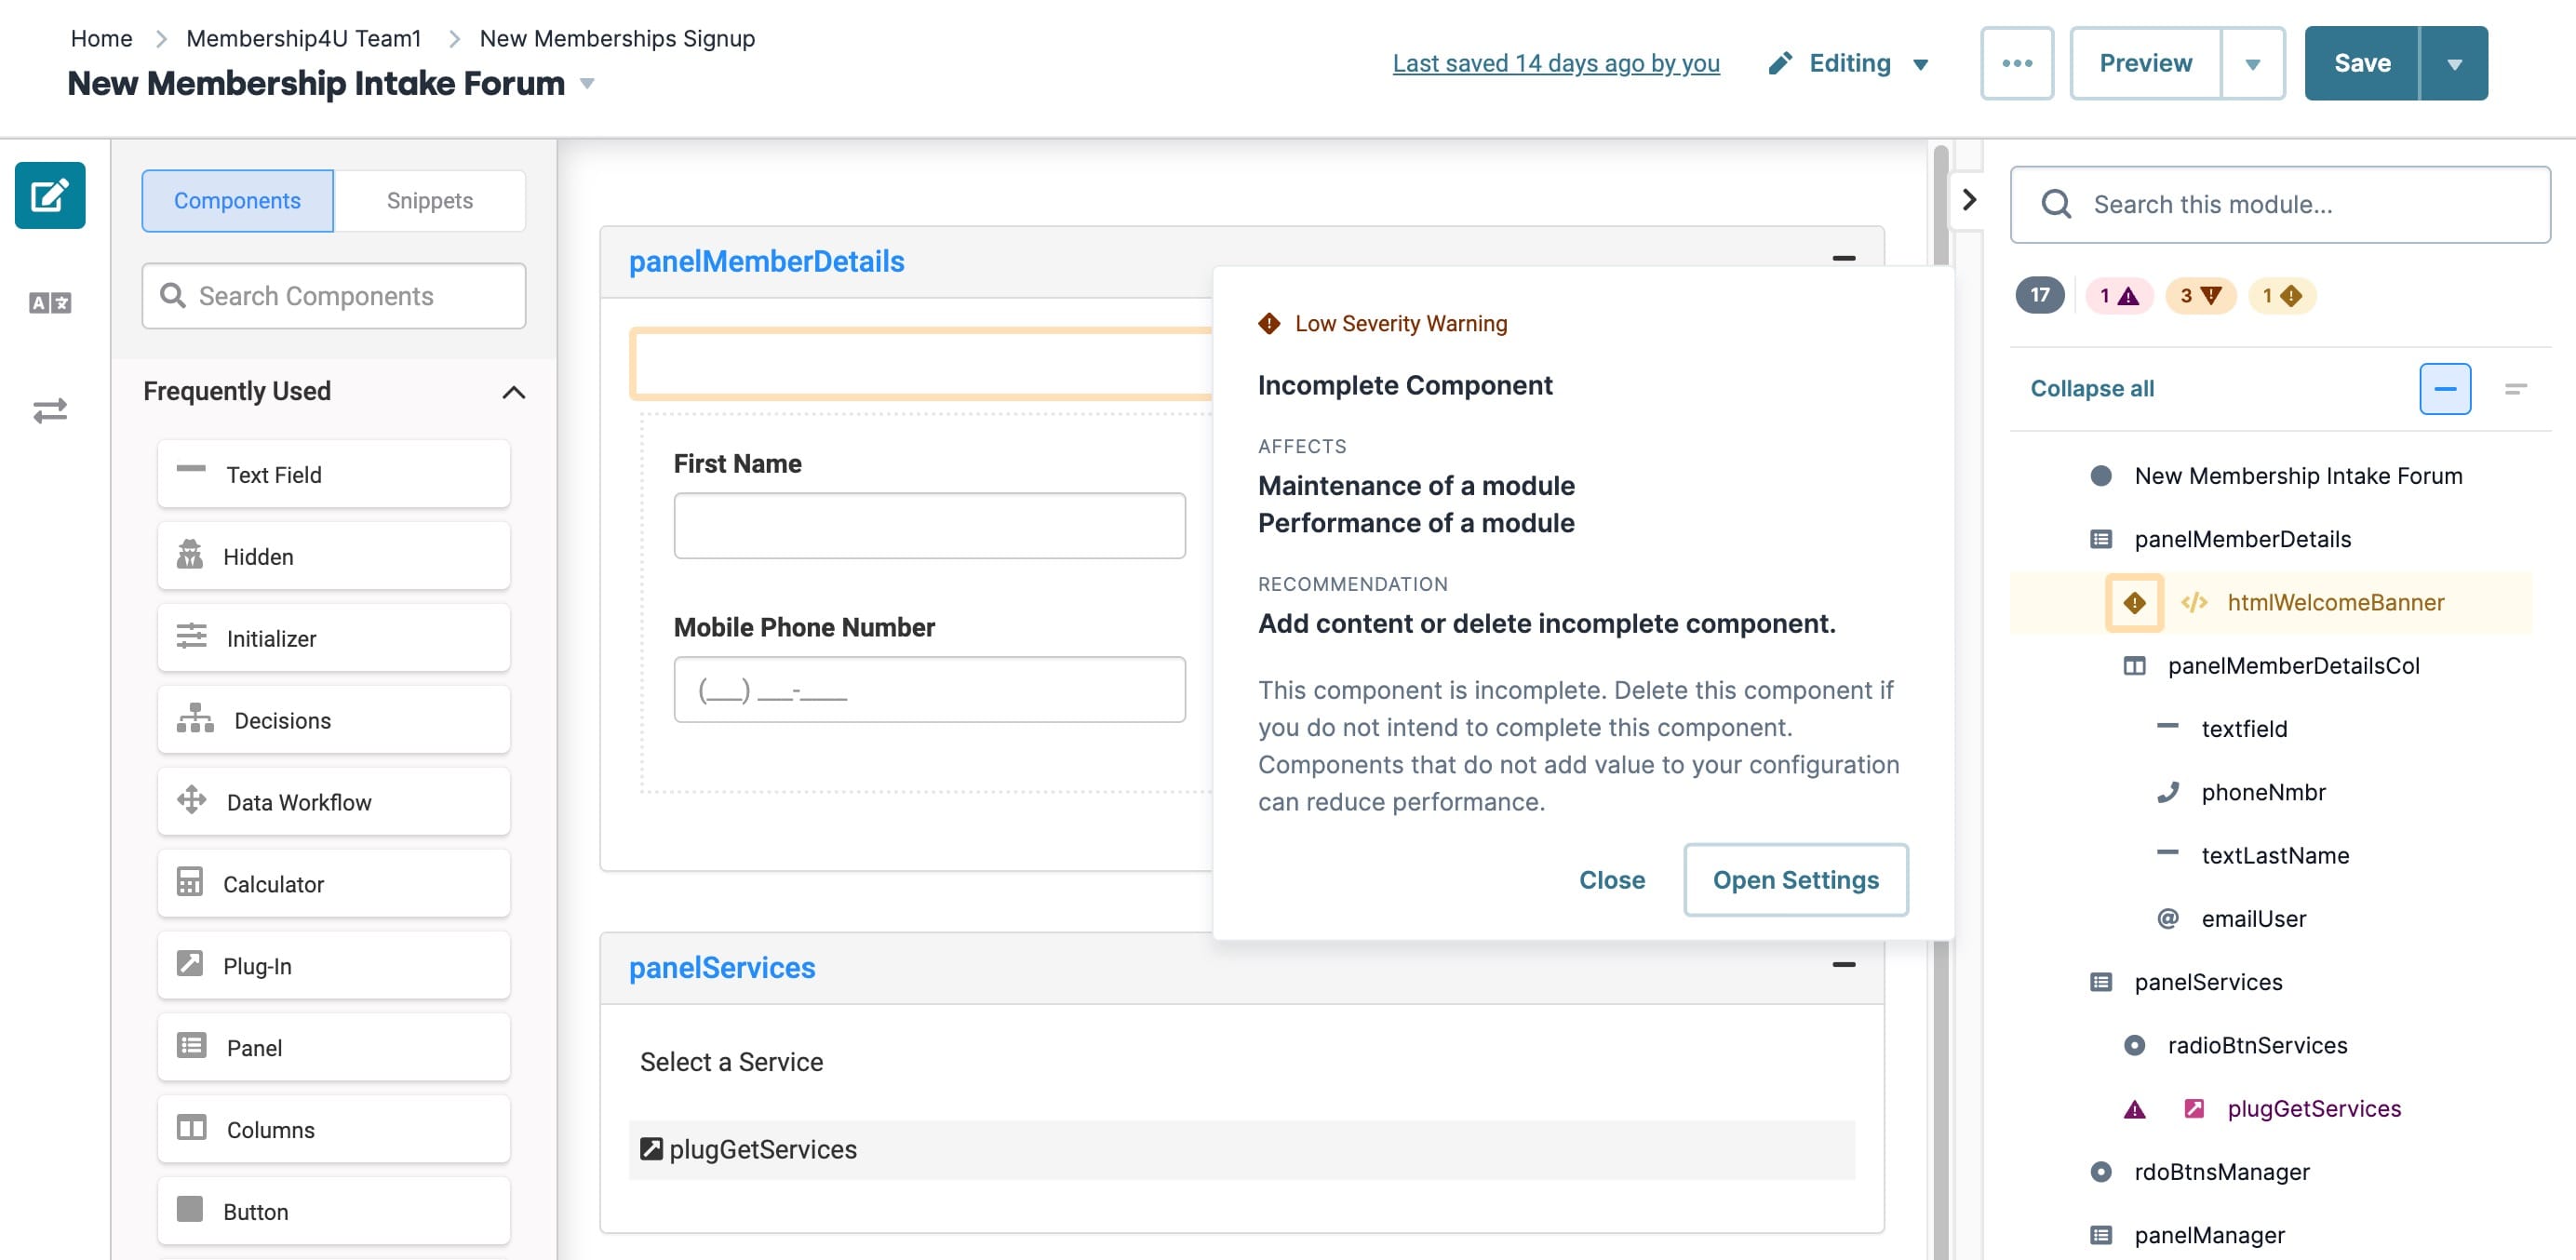
Accessing and Understanding Warning Message Details
Once you've identified a component experiencing any level of severity, open the warning panel to identify what issues are affecting the component.
To access warning message details:
| 1. | In the Module Outline, search for a component that has a severity warning. |
| 2. | Click the Warning symbol next to the component. The warning message panel opens. |
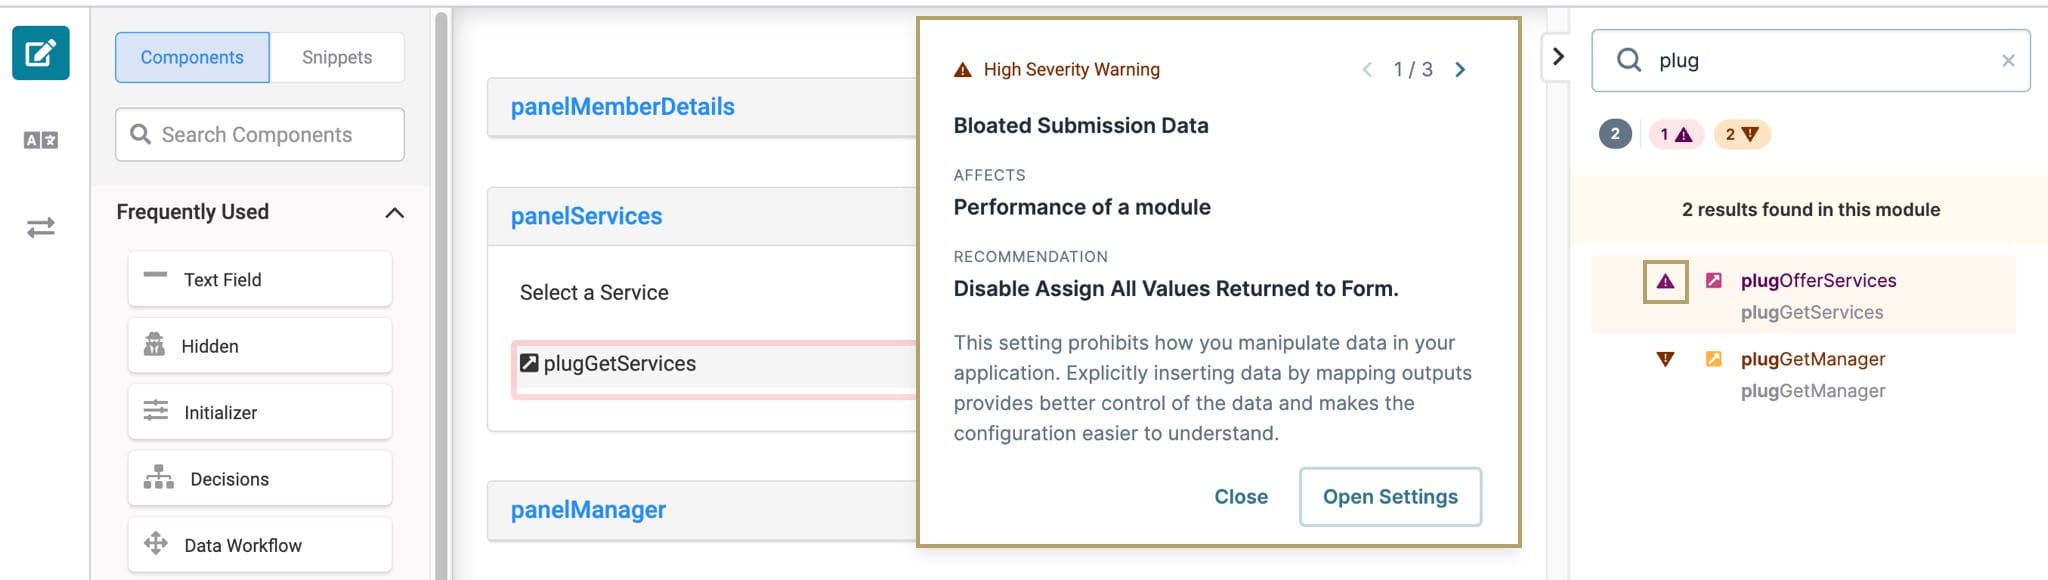
Understanding Warning Message Details
The Warning Message panel provides details on the selected issue. Details include the level of severity, what areas might be affected, and a description of how to resolve the issue.
The warning message panel consists of the six sections shown below:
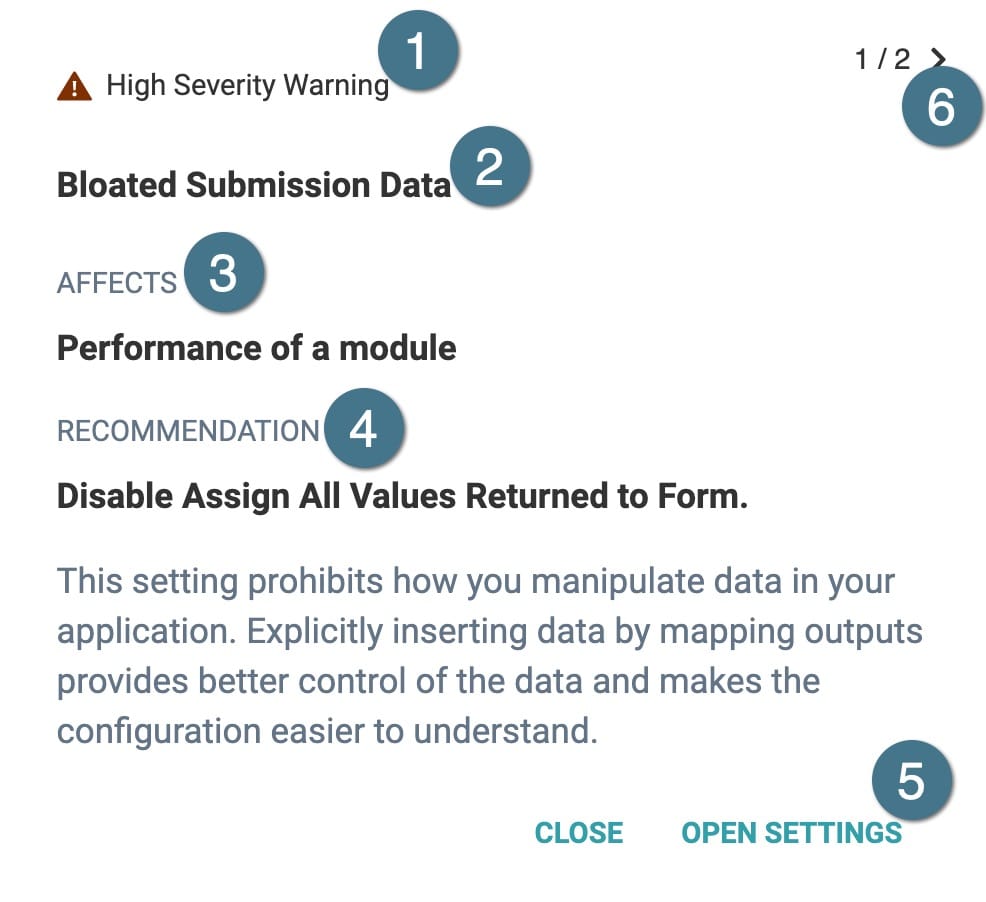
|
# |
Setting |
Description |
|---|---|---|
|
1 |
Severity Level |
The severity level of the issue. |
|
2 |
Title of Issue |
The title provides a high-level explanation of the issue. |
|
3 |
Affected Areas |
Explains what areas of your application might be affected by the issue. |
|
4 |
Recommended Solution |
The recommended solution explains how to fix the affected component. A description of the solution provides additional context as to why the issue should be fixed. |
|
5 |
Open Settings |
Click to open the configuration window of the affected component. |
|
6 |
Number of Issues |
If a component is affected by multiple issues, click the > or < arrows to navigate to the next issue affecting the component. NOTE The Number of issues value is not present if a component only has one issue. |
Resolving Component Severity Issues
To fix severity issues, follow the recommended solution provided in the warning message panel. To reduce severity issues from occurring, apply best practices found in the articles listed below:
Resources
